Mairiporã Airbnb Market Analysis 2026: Short Term Rental Data & Vacation Rental Statistics in São Paulo, Brazil
Is Airbnb profitable in Mairiporã in 2026? Explore comprehensive Airbnb analytics for Mairiporã, São Paulo, Brazil to uncover income potential. This 2026 STR market report for Mairiporã, based on AirROI data from February 2025 to January 2026, reveals key trends in the market of 451 active listings.
Whether you're considering an Airbnb investment in Mairiporã, optimizing your existing vacation rental, or exploring rental arbitrage opportunities, understanding the Mairiporã Airbnb data is crucial. Leveraging the low regulation environment is key to maximizing your short term rental income potential. Let's dive into the specifics.
Key Mairiporã Airbnb Performance Metrics Overview
Monthly Airbnb Revenue Variations & Income Potential in Mairiporã (2026)
Understanding the monthly revenue variations for Airbnb listings in Mairiporã is key to maximizing your short term rental income potential. Seasonality significantly impacts earnings. Our analysis, based on data from the past 12 months, shows that the peak revenue month for STRs in Mairiporã is typically December, while August often presents the lowest earnings, highlighting opportunities for strategic pricing adjustments during shoulder and low seasons. Explore the typical Airbnb income in Mairiporã across different performance tiers:
- Best-in-class properties (Top 10%) achieve $3,212+ monthly, often utilizing dynamic pricing and superior guest experiences.
- Strong performing properties (Top 25%) earn $2,035 or more, indicating effective management and desirable locations/amenities.
- Typical properties (Median) generate around $1,063 per month, representing the average market performance.
- Entry-level properties (Bottom 25%) see earnings around $489, often with potential for optimization.
Average Monthly Airbnb Earnings Trend in Mairiporã
Mairiporã Airbnb Occupancy Rate Trends (2026)
Maximize your bookings by understanding the Mairiporã STR occupancy trends. Seasonal demand shifts significantly influence how often properties are booked. Typically, Marchsees the highest demand (peak season occupancy), while August experiences the lowest (low season). Effective strategies, like adjusting minimum stays or offering promotions, can boost occupancy during slower periods. Here's how different property tiers perform in Mairiporã:
- Best-in-class properties (Top 10%) achieve 68%+ occupancy, indicating high desirability and potentially optimized availability.
- Strong performing properties (Top 25%) maintain 45% or higher occupancy, suggesting good market fit and guest satisfaction.
- Typical properties (Median) have an occupancy rate around 26%.
- Entry-level properties (Bottom 25%) average 13% occupancy, potentially facing higher vacancy.
Average Monthly Occupancy Rate Trend in Mairiporã
Average Daily Rate (ADR) Airbnb Trends in Mairiporã (2026)
Effective short term rental pricing strategy in Mairiporã involves understanding monthly ADR fluctuations. The Average Daily Rate (ADR) for Airbnb in Mairiporã typically peaks in December and dips lowest during April. Leveraging Airbnb dynamic pricing tools or strategies based on this seasonality can significantly boost revenue. Here's a look at the typical nightly rates achieved:
- Best-in-class properties (Top 10%) command rates of $275+ per night, often due to premium features or locations.
- Strong performing properties (Top 25%) achieve nightly rates of $195 or more.
- Typical properties (Median) charge around $138 per night.
- Entry-level properties (Bottom 25%) earn around $94 per night.
Average Daily Rate (ADR) Trend by Month in Mairiporã
Get Live Mairiporã Market Intelligence 👇

Explore Real-time Analytics
Airbnb Seasonality Analysis & Trends in Mairiporã (2026)
Peak Season (December, March, November)
- Revenue averages $1,863 per month
- Occupancy rates average 35.7%
- Daily rates average $169
Shoulder Season
- Revenue averages $1,398 per month
- Occupancy maintains around 30.6%
- Daily rates hold near $157
Low Season (February, August, September)
- Revenue drops to average $1,227 per month
- Occupancy decreases to average 29.6%
- Daily rates adjust to average $151
Seasonality Insights for Mairiporã
- The Airbnb seasonality in Mairiporã shows highly seasonal trends requiring careful strategy. While the sections above show seasonal averages, it's also insightful to look at the extremes:
- During the high season, the absolute peak month showcases Mairiporã's highest earning potential, with monthly revenues capable of climbing to $2,233, occupancy reaching a high of 36.2%, and ADRs peaking at $190.
- Conversely, the slowest single month of the year, typically falling within the low season, marks the market's lowest point. In this month, revenue might dip to $1,161, occupancy could drop to 28.1%, and ADRs may adjust down to $145.
- Understanding both the seasonal averages and these monthly peaks and troughs in revenue, occupancy, and ADR is crucial for maximizing your Airbnb profit potential in Mairiporã.
Seasonal Strategies for Maximizing Profit
- Peak Season: Maximize revenue through premium pricing and potentially longer minimum stays. Ensure high availability.
- Low Season: Offer competitive pricing, special promotions (e.g., extended stay discounts), and flexible cancellation policies. Target off-season travelers like remote workers or budget-conscious guests.
- Shoulder Seasons: Implement dynamic pricing that balances peak and low rates. Target weekend travelers or specific events. Offer slightly more flexible terms than peak season.
- Regularly analyze your own performance against these Mairiporã seasonality benchmarks and adjust your pricing and availability strategy accordingly.
Best Areas for Airbnb Investment in Mairiporã (2026)
Exploring the top neighborhoods for short-term rentals in Mairiporã? This section highlights key areas, outlining why they are attractive for hosts and guests, along with notable local attractions. Consider these locations based on your target guest profile and investment strategy.
| Neighborhood / Area | Why Host Here? (Target Guests & Appeal) | Key Attractions & Landmarks |
|---|---|---|
| Centro de Mairiporã | The city center is bustling with shops, restaurants, and local culture. It's a great spot for guests who want to experience the vibrancy of the city and have easy access to public transport. | Mairiporã Municipal Market, Cristo Redentor de Mairiporã, local restaurants, Cultural events |
| Represa de Mairiporã | This area is known for its beautiful reservoir and natural landscapes, making it ideal for guests looking for a peaceful retreat and outdoor activities like hiking, fishing, and boating. | Represa de Mairiporã, hiking trails, picnic areas, water sports, nature parks |
| Parque Estadual da Cantareira | A vast natural park located nearby that attracts nature lovers and hikers. It offers incredible views and is perfect for those seeking an eco-tourism experience. | Hiking trails, Miranda Viewpoint, nature observation, wildlife watching |
| Jardim Líbano | A charming neighborhood with beautiful scenery and a tranquil atmosphere, making it suitable for families and those who want to relax away from the city hustle. | local parks, flower gardens, family-friendly cafes |
| Vila Figueira | A developing neighborhood with a growing community, it's great for long-term stays and offers a mix of local living and proximity to nature. | local shops, community events, proximity to green areas |
| Morro Grande | Known for its scenic views and elevated terrains, it is attracting visitors interested in nature and photography, as well as those looking for unique Airbnb experiences. | viewpoints, natural trails, photography opportunities |
| Cidade São Pedro | This residential area provides a cozy atmosphere and is ideal for long-term stays, offering a local vibe with easy access to the nearby attractions of Mairiporã. | residential parks, small markets, community gatherings |
| Mairiporã Eco Park | An eco-friendly area that promotes sustainability and offers a variety of activities related to nature, appealing to environmentally conscious travelers. | eco-friendly tours, workshops on sustainability, nature walks |
Understanding Airbnb License Requirements & STR Laws in Mairiporã (2026)
While Mairiporã, São Paulo, Brazil currently shows low STR regulations, specific Airbnb license requirements might still exist or change. Always verify the latest short term rental regulations and Airbnb license requirements directly with local government authorities for Mairiporã to ensure full compliance before hosting.
(Source: AirROI data, 2026, finding no licensed listings among those analyzed)
Top Performing Airbnb Properties in Mairiporã (2026)
Benchmark your potential! Explore examples of top-performing Airbnb properties in Mairiporãbased on Trailing Twelve Month (TTM) revenue. Analyze their characteristics, revenue, occupancy rate, and ADR to understand what drives success in this market.

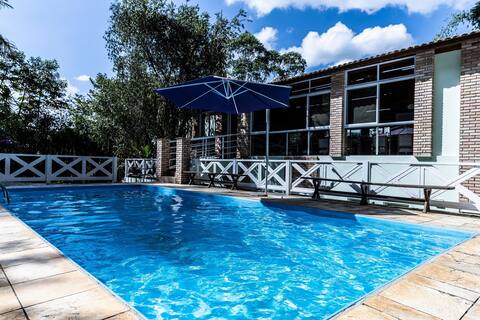
Serra da Cantareira Mairiporã Mansion
Entire Place • 3 bedrooms

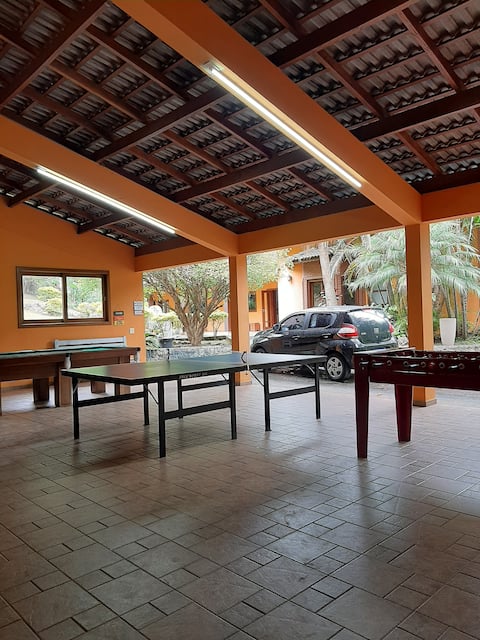
Country House with Beach, Pickleball and Tennis Court
Entire Place • 4 bedrooms
Farm w/ 8 suites, pool, grill | Brazilian Corner
Entire Place • 8 bedrooms
casa espaçosa piscina adulto e infantil
Entire Place • 11 bedrooms

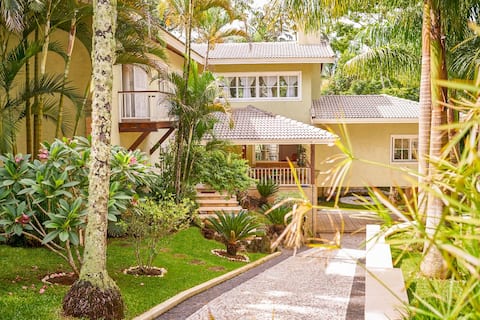
Aconchego Farmhouse
Entire Place • 6 bedrooms
Beautiful Family Farm near Buffets
Entire Place • 4 bedrooms
Note: Performance varies based on location, size, amenities, seasonality, and management quality. Data reflects the past 12 months.
Top Performing Airbnb Hosts in Mairiporã (2026)
Learn from the best! This table showcases top-performing Airbnb hosts in Mairiporã based on the number of properties managed and estimated total revenue over the past year. Analyze their scale and performance metrics.
| Host Name | Properties | Grossing Revenue | Stay Reviews | Avg Rating |
|---|---|---|---|---|
| Aline | 8 | $214,003 | 514 | 4.95/5.0 |
| Neuria | 5 | $124,546 | 238 | 4.96/5.0 |
| Marcelo Gomes | 3 | $112,689 | 353 | 4.98/5.0 |
| Margarete Hensler | 1 | $101,599 | 70 | 4.99/5.0 |
| Viviane | 2 | $82,242 | 151 | 4.83/5.0 |
| Adriana | 1 | $81,001 | 113 | 4.91/5.0 |
| Priscylla | 2 | $79,579 | 490 | 4.90/5.0 |
| Brazilian Corner | 1 | $74,014 | 32 | 4.84/5.0 |
| Maria | 3 | $70,126 | 38 | 4.95/5.0 |
| Lucas | 2 | $65,952 | 317 | 4.95/5.0 |
Analyzing the strategies of top hosts, such as their property selection, pricing, and guest communication, can offer valuable lessons for optimizing your own Airbnb operations in Mairiporã.
Dive Deeper: Advanced Mairiporã STR Market Data (2026)
Ready to unlock more insights? AirROI provides access to advanced metrics and comprehensive Airbnb data for Mairiporã. Explore detailed analytics beyond this report to refine your investment strategy, optimize pricing, and maximize your vacation rental profits.
Explore Advanced MetricsMairiporã Short-Term Rental Market Composition (2026): Property & Room Types
Room Type Distribution
Property Type Distribution
Market Composition Insights for Mairiporã
- The Mairiporã Airbnb market composition is heavily skewed towards Entire Home/Apt listings, which make up 92.7% of the 451 active rentals. This indicates strong guest preference for privacy and space.
- Looking at the property type distribution in Mairiporã, House properties are the most common (79.4%), reflecting the local real estate landscape.
- Houses represent a significant 79.4% portion, catering likely to families or larger groups.
- The presence of 6.9% Hotel/Boutique listings indicates integration with traditional hospitality.
- Smaller segments like unique stays, others, apartment/condo (combined 5.1%) offer potential for unique stay experiences.
Mairiporã Airbnb Room Capacity Analysis (2026): Bedroom Distribution
Distribution of Listings by Number of Bedrooms
Room Capacity Insights for Mairiporã
- The dominant room capacity in Mairiporã is 3 bedrooms listings, making up 27.7% of the market. This suggests a strong demand for properties suitable for families or small groups.
- Together, 3 bedrooms and 4 bedrooms properties represent 45.9% of the active Airbnb listings in Mairiporã, indicating a high concentration in these sizes.
- A significant 62.8% of listings offer 3+ bedrooms, catering to larger groups and families seeking more space in Mairiporã.
Mairiporã Vacation Rental Guest Capacity Trends (2026)
Distribution of Listings by Guest Capacity
Guest Capacity Insights for Mairiporã
- The most common guest capacity trend in Mairiporã vacation rentals is listings accommodating 8+ guests (67.8%). This suggests the primary traveler segment is likely larger groups.
- Properties designed for 8+ guests and 2 guests dominate the Mairiporã STR market, accounting for 77.6% of listings.
- 75.2% of properties accommodate 6+ guests, serving the market segment for larger families or group travel in Mairiporã.
- On average, properties in Mairiporã are equipped to host 6.4 guests.
Mairiporã Airbnb Booking Patterns (2026): Available vs. Booked Days
Available Days Distribution
Booked Days Distribution
Booking Pattern Insights for Mairiporã
- The most common availability pattern in Mairiporã falls within the 271-366 days range, representing 65.4% of listings. This suggests many properties have significant open periods on their calendars.
- Approximately 88.9% of listings show high availability (181+ days open annually), indicating potential for increased bookings or specific owner usage patterns.
- For booked days, the 31-90 days range is most frequent in Mairiporã (40.1%), reflecting common guest stay durations or potential owner blocking patterns.
- A notable 11.7% of properties secure long booking periods (181+ days booked per year), highlighting successful long-term rental strategies or significant owner usage.
Mairiporã Airbnb Minimum Stay Requirements Analysis
Distribution of Listings by Minimum Night Requirement
1 Night
176 listings
39% of total
2 Nights
139 listings
30.8% of total
3 Nights
6 listings
1.3% of total
4-6 Nights
1 listings
0.2% of total
7-29 Nights
1 listings
0.2% of total
30+ Nights
128 listings
28.4% of total
Key Insights
- The most prevalent minimum stay requirement in Mairiporã is 1 Night, adopted by 39% of listings. This highlights the market's preference for shorter, flexible bookings.
- A strong majority (69.8%) of the Mairiporã Airbnb data shows acceptance of very short stays (1-2 nights), indicating a dynamic, high-turnover market.
- A significant segment (28.4%) caters to monthly stays (30+ nights) in Mairiporã, pointing to opportunities in the extended-stay market.
Recommendations
- Align with the market by considering a 1 Night minimum stay, as 39% of Mairiporã hosts use this setting.
- Explore offering discounts for stays of 30+ nights to attract the 28.4% of the market seeking extended stays.
- Adjust minimum nights based on seasonality – potentially shorter during low season and longer during peak demand periods in Mairiporã.
Mairiporã Airbnb Cancellation Policy Trends Analysis (2026)
Limited
8 listings
1.8% of total
Super Strict 30 Days
1 listings
0.2% of total
Flexible
83 listings
18.7% of total
Moderate
114 listings
25.6% of total
Firm
169 listings
38% of total
Strict
70 listings
15.7% of total
Cancellation Policy Insights for Mairiporã
- The prevailing Airbnb cancellation policy trend in Mairiporã is Firm, used by 38% of listings.
- A majority (53.7%) of hosts in Mairiporã utilize Firm or Strict policies, indicating a market where hosts prioritize booking security.
Recommendations for Hosts
- Consider adopting a Firm policy to align with the 38% market standard in Mairiporã.
- Regularly review your cancellation policy against competitors and market demand shifts in Mairiporã.
Mairiporã STR Booking Lead Time Analysis (2026)
Average Booking Lead Time by Month
Booking Lead Time Insights for Mairiporã
- The overall average booking lead time for vacation rentals in Mairiporã is 45 days.
- Guests book furthest in advance for stays during December (average 76 days), likely coinciding with peak travel demand or local events.
- The shortest booking windows occur for stays in March (average 23 days), indicating more last-minute travel plans during this time.
- Seasonally, Winter (48 days avg.) sees the longest lead times, while Spring (29 days avg.) has the shortest, reflecting typical travel planning cycles.
Recommendations for Hosts
- Use the overall average lead time (45 days) as a baseline for your pricing and availability strategy in Mairiporã.
- For December stays, consider implementing length-of-stay discounts or slightly higher rates for bookings made less than 76 days out to capitalize on advance planning.
- Target marketing efforts for the Winter season well in advance (at least 48 days) to capture early planners.
- Monitor your own booking lead times against these Mairiporã averages to identify opportunities for dynamic pricing adjustments.
Popular & Essential Airbnb Amenities in Mairiporã (2026)
Amenity Prevalence
Amenity Insights for Mairiporã
- Essential amenities in Mairiporã that guests expect include: Wifi. Lacking these (this) could significantly impact bookings.
- Popular amenities like Kitchen, Free parking on premises, TV are common but not universal. Offering these can provide a competitive edge.
- A pool is a highly desired but not standard amenity, making it a key feature for attracting guests seeking leisure in Mairiporã.
Recommendations for Hosts
- Ensure your listing includes all essential amenities for Mairiporã: Wifi.
- Prioritize adding missing essentials: Wifi.
- Consider adding popular differentiators like Kitchen or Free parking on premises to increase appeal.
- Highlight unique or less common amenities you offer (e.g., hot tub, dedicated workspace, EV charger) in your listing description and photos.
- Regularly check competitor amenities in Mairiporã to stay competitive.
Mairiporã Airbnb Guest Demographics & Profile Analysis (2026)
Guest Profile Summary for Mairiporã
- The typical guest profile for Airbnb in Mairiporã consists of primarily domestic travelers (96%), often arriving from nearby São Paulo, typically belonging to the Post-2000s (Gen Z/Alpha) group (50%), primarily speaking Portuguese or English.
- Domestic travelers account for 95.9% of guests.
- Key international markets include Brazil (95.9%) and United States (1.2%).
- Top languages spoken are Portuguese (47.7%) followed by English (31.3%).
- A significant demographic segment is the Post-2000s (Gen Z/Alpha) group, representing 50% of guests.
Recommendations for Hosts
- Target domestic marketing efforts towards travelers from São Paulo and Guarulhos.
- Tailor amenities and listing descriptions to appeal to the dominant Post-2000s (Gen Z/Alpha) demographic (e.g., highlight fast WiFi, smart home features, local guides).
- Highlight unique local experiences or amenities relevant to the primary guest profile.
- Consider seasonal promotions aligned with peak travel times for key origin markets.
Nearby Short-Term Rental Market Comparison
How does the Mairiporã Airbnb market stack up against its neighbors? Compare key performance metrics like average monthly revenue, ADR, and occupancy rates in surrounding areas to understand the broader regional STR landscape.
| Market | Active Properties | Monthly Revenue | Daily Rate | Avg. Occupancy |
|---|---|---|---|---|
| Riviera de São Lourenço | 10 | $2,868 | $213.78 | 46% |
| Tuiuti | 18 | $1,686 | $156.45 | 30% |
| Itupeva | 136 | $1,561 | $225.82 | 28% |
| Morungaba | 31 | $1,435 | $263.39 | 27% |
| Campo Limpo Paulista | 49 | $1,428 | $181.02 | 30% |
| Valinhos | 61 | $1,370 | $176.28 | 33% |
| Itatiba | 171 | $1,331 | $177.58 | 29% |
| Vargem | 48 | $1,319 | $190.42 | 28% |
| Elias Fausto | 13 | $1,296 | $143.78 | 30% |
| Porto Feliz | 69 | $1,279 | $260.86 | 27% |