Lorena Airbnb Market Analysis 2026: Short Term Rental Data & Vacation Rental Statistics in São Paulo, Brazil
Is Airbnb profitable in Lorena in 2026? Explore comprehensive Airbnb analytics for Lorena, São Paulo, Brazil to uncover income potential. This 2026 STR market report for Lorena, based on AirROI data from February 2025 to January 2026, reveals key trends in the niche market of 22 active listings.
Whether you're considering an Airbnb investment in Lorena, optimizing your existing vacation rental, or exploring rental arbitrage opportunities, understanding the Lorena Airbnb data is crucial. Leveraging the low regulation environment is key to maximizing your short term rental income potential. Let's dive into the specifics.
Key Lorena Airbnb Performance Metrics Overview
Monthly Airbnb Revenue Variations & Income Potential in Lorena (2026)
Understanding the monthly revenue variations for Airbnb listings in Lorena is key to maximizing your short term rental income potential. Seasonality significantly impacts earnings. Our analysis, based on data from the past 12 months, shows that the peak revenue month for STRs in Lorena is typically December, while October often presents the lowest earnings, highlighting opportunities for strategic pricing adjustments during shoulder and low seasons. Explore the typical Airbnb income in Lorena across different performance tiers:
- Best-in-class properties (Top 10%) achieve $1,337+ monthly, often utilizing dynamic pricing and superior guest experiences.
- Strong performing properties (Top 25%) earn $691 or more, indicating effective management and desirable locations/amenities.
- Typical properties (Median) generate around $367 per month, representing the average market performance.
- Entry-level properties (Bottom 25%) see earnings around $158, often with potential for optimization.
Average Monthly Airbnb Earnings Trend in Lorena
Lorena Airbnb Occupancy Rate Trends (2026)
Maximize your bookings by understanding the Lorena STR occupancy trends. Seasonal demand shifts significantly influence how often properties are booked. Typically, Februarysees the highest demand (peak season occupancy), while January experiences the lowest (low season). Effective strategies, like adjusting minimum stays or offering promotions, can boost occupancy during slower periods. Here's how different property tiers perform in Lorena:
- Best-in-class properties (Top 10%) achieve 72%+ occupancy, indicating high desirability and potentially optimized availability.
- Strong performing properties (Top 25%) maintain 49% or higher occupancy, suggesting good market fit and guest satisfaction.
- Typical properties (Median) have an occupancy rate around 27%.
- Entry-level properties (Bottom 25%) average 13% occupancy, potentially facing higher vacancy.
Average Monthly Occupancy Rate Trend in Lorena
Average Daily Rate (ADR) Airbnb Trends in Lorena (2026)
Effective short term rental pricing strategy in Lorena involves understanding monthly ADR fluctuations. The Average Daily Rate (ADR) for Airbnb in Lorena typically peaks in July and dips lowest during September. Leveraging Airbnb dynamic pricing tools or strategies based on this seasonality can significantly boost revenue. Here's a look at the typical nightly rates achieved:
- Best-in-class properties (Top 10%) command rates of $154+ per night, often due to premium features or locations.
- Strong performing properties (Top 25%) achieve nightly rates of $66 or more.
- Typical properties (Median) charge around $32 per night.
- Entry-level properties (Bottom 25%) earn around $22 per night.
Average Daily Rate (ADR) Trend by Month in Lorena
Get Live Lorena Market Intelligence 👇

Explore Real-time Analytics
Airbnb Seasonality Analysis & Trends in Lorena (2026)
Peak Season (December, January, February)
- Revenue averages $756 per month
- Occupancy rates average 35.9%
- Daily rates average $61
Shoulder Season
- Revenue averages $491 per month
- Occupancy maintains around 33.4%
- Daily rates hold near $61
Low Season (June, October, November)
- Revenue drops to average $419 per month
- Occupancy decreases to average 29.6%
- Daily rates adjust to average $58
Seasonality Insights for Lorena
- The Airbnb seasonality in Lorena shows highly seasonal trends requiring careful strategy. While the sections above show seasonal averages, it's also insightful to look at the extremes:
- During the high season, the absolute peak month showcases Lorena's highest earning potential, with monthly revenues capable of climbing to $997, occupancy reaching a high of 47.4%, and ADRs peaking at $65.
- Conversely, the slowest single month of the year, typically falling within the low season, marks the market's lowest point. In this month, revenue might dip to $394, occupancy could drop to 21.2%, and ADRs may adjust down to $52.
- Understanding both the seasonal averages and these monthly peaks and troughs in revenue, occupancy, and ADR is crucial for maximizing your Airbnb profit potential in Lorena.
Seasonal Strategies for Maximizing Profit
- Peak Season: Maximize revenue through premium pricing and potentially longer minimum stays. Ensure high availability.
- Low Season: Offer competitive pricing, special promotions (e.g., extended stay discounts), and flexible cancellation policies. Target off-season travelers like remote workers or budget-conscious guests.
- Shoulder Seasons: Implement dynamic pricing that balances peak and low rates. Target weekend travelers or specific events. Offer slightly more flexible terms than peak season.
- Regularly analyze your own performance against these Lorena seasonality benchmarks and adjust your pricing and availability strategy accordingly.
Best Areas for Airbnb Investment in Lorena (2026)
Exploring the top neighborhoods for short-term rentals in Lorena? This section highlights key areas, outlining why they are attractive for hosts and guests, along with notable local attractions. Consider these locations based on your target guest profile and investment strategy.
| Neighborhood / Area | Why Host Here? (Target Guests & Appeal) | Key Attractions & Landmarks |
|---|---|---|
| Centro de Lorena | The bustling heart of Lorena, known for its historical buildings and local shops. A prime spot for tourists wanting to explore the city and its rich history. | Igreja Matriz de São Sebastião, Praça Dr. João Ribeiro, Museu de Lorena, Shopping Pátio Lorena |
| Parque da Cidade | A beautiful park area that attracts both locals and tourists for recreation and relaxation. Great for families looking for a peaceful escape. | Parque da Cidade, Caminho da Lazer, Área de Lazer, Ponte das Ladeiras |
| Bairros da Zona Oeste | Residential neighborhoods known for their local cuisine and community vibe. Attractive for guests looking for an authentic local experience. | Restaurantes tradicionais, Praças locais, Café e cultura local |
| Bairros da Zona Leste | Vibrant neighborhoods with a mix of cultures and local attractions. Offers unique lodging experiences and access to local events. | Feiras de Artesanato, Eventos culturais locais, Culinária regional |
| Região do Lago da Luz | A scenic area perfect for nature lovers and those wanting a quiet getaway. Popular among families and couples. | Lago da Luz, Trilhas e áreas para piquenique, Pesca |
| Distrito Industrial | A hub for business travelers, offering easy access to commercial areas and local industries. Suited for short-term stays for professionals. | Parques industriais, Centros administrativos, Restaurantes da região |
| Via Dutra | A major highway location that attracts highway travelers. Ideal for those looking for convenient stays while on the road. | Restaurantes de beira de estrada, Postos de combustíveis, Fácil acesso a cidades vizinhas |
| Centro Cultural e Esportivo | An area rich in cultural events and sports activities. Great for those partaking in local festivals and community events. | Eventos culturais, Praças de esportes, Atividades para a comunidade |
Understanding Airbnb License Requirements & STR Laws in Lorena (2026)
While Lorena, São Paulo, Brazil currently shows low STR regulations, specific Airbnb license requirements might still exist or change. Always verify the latest short term rental regulations and Airbnb license requirements directly with local government authorities for Lorena to ensure full compliance before hosting.
(Source: AirROI data, 2026, based on 5% licensed listings)
Top Performing Airbnb Properties in Lorena (2026)
Benchmark your potential! Explore examples of top-performing Airbnb properties in Lorenabased on Trailing Twelve Month (TTM) revenue. Analyze their characteristics, revenue, occupancy rate, and ADR to understand what drives success in this market.

Family relaxation - Sauna and pool
Entire Place • 3 bedrooms
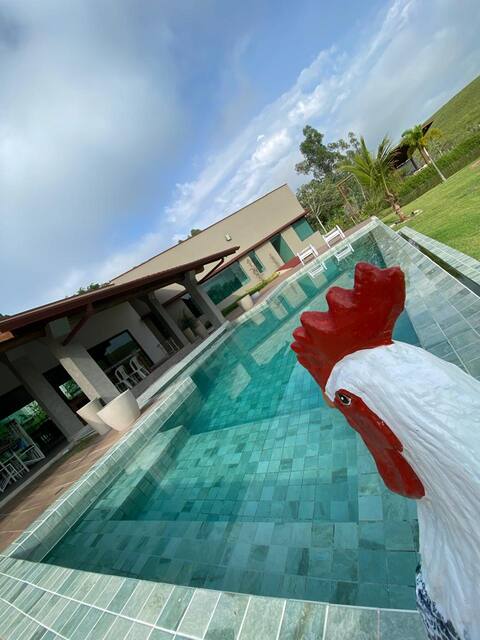
Sítio Galo Véio
Entire Place • 4 bedrooms

*House in Lorena F. Santa Cecilia*
Entire Place • 5 bedrooms

the cabin
Entire Place • 1 bedroom
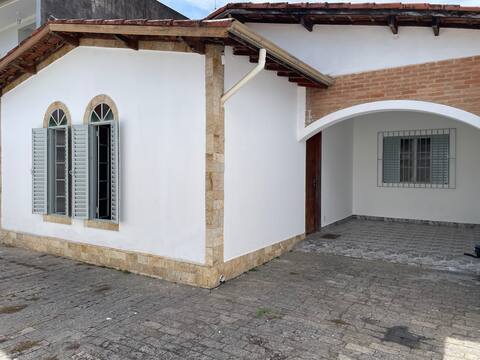
Large and Well-Located House in Lorena
Entire Place • 3 bedrooms

House of Our Lady of Fatima in the Tourist City of Faith
Entire Place • 2 bedrooms
Note: Performance varies based on location, size, amenities, seasonality, and management quality. Data reflects the past 12 months.
Top Performing Airbnb Hosts in Lorena (2026)
Learn from the best! This table showcases top-performing Airbnb hosts in Lorena based on the number of properties managed and estimated total revenue over the past year. Analyze their scale and performance metrics.
| Host Name | Properties | Grossing Revenue | Stay Reviews | Avg Rating |
|---|---|---|---|---|
| Mariara | 1 | $21,259 | 40 | 5.00/5.0 |
| Erica | 1 | $13,700 | 1 | Not Rated |
| Darcy Marques | 1 | $10,817 | 21 | 5.00/5.0 |
| Gabriel | 3 | $7,801 | 224 | 4.93/5.0 |
| Michael Wendel | 1 | $7,241 | 65 | 5.00/5.0 |
| Odirley | 1 | $6,054 | 21 | 4.81/5.0 |
| Izabel Cristina De | 1 | $5,496 | 13 | 5.00/5.0 |
| Rafael | 1 | $5,232 | 65 | 4.97/5.0 |
| Adriano Golob | 1 | $4,198 | 103 | 5.00/5.0 |
| Matheus | 1 | $3,913 | 48 | 4.88/5.0 |
Analyzing the strategies of top hosts, such as their property selection, pricing, and guest communication, can offer valuable lessons for optimizing your own Airbnb operations in Lorena.
Dive Deeper: Advanced Lorena STR Market Data (2026)
Ready to unlock more insights? AirROI provides access to advanced metrics and comprehensive Airbnb data for Lorena. Explore detailed analytics beyond this report to refine your investment strategy, optimize pricing, and maximize your vacation rental profits.
Explore Advanced MetricsLorena Short-Term Rental Market Composition (2026): Property & Room Types
Room Type Distribution
Property Type Distribution
Market Composition Insights for Lorena
- The Lorena Airbnb market composition is heavily skewed towards Entire Home/Apt listings, which make up 77.3% of the 22 active rentals. This indicates strong guest preference for privacy and space.
- Looking at the property type distribution in Lorena, House properties are the most common (54.5%), reflecting the local real estate landscape.
- Houses represent a significant 54.5% portion, catering likely to families or larger groups.
- Smaller segments like outdoor/unique (combined 4.5%) offer potential for unique stay experiences.
Lorena Airbnb Room Capacity Analysis (2026): Bedroom Distribution
Distribution of Listings by Number of Bedrooms
Room Capacity Insights for Lorena
- The dominant room capacity in Lorena is 3 bedrooms listings, making up 31.8% of the market. This suggests a strong demand for properties suitable for families or small groups.
- Together, 3 bedrooms and 2 bedrooms properties represent 54.5% of the active Airbnb listings in Lorena, indicating a high concentration in these sizes.
- A significant 45.4% of listings offer 3+ bedrooms, catering to larger groups and families seeking more space in Lorena.
Lorena Vacation Rental Guest Capacity Trends (2026)
Distribution of Listings by Guest Capacity
Guest Capacity Insights for Lorena
- The most common guest capacity trend in Lorena vacation rentals is listings accommodating 6 guests (27.3%). This suggests the primary traveler segment is likely larger groups.
- Properties designed for 6 guests and 8+ guests dominate the Lorena STR market, accounting for 45.5% of listings.
- 50.0% of properties accommodate 6+ guests, serving the market segment for larger families or group travel in Lorena.
- On average, properties in Lorena are equipped to host 4.3 guests.
Lorena Airbnb Booking Patterns (2026): Available vs. Booked Days
Available Days Distribution
Booked Days Distribution
Booking Pattern Insights for Lorena
- The most common availability pattern in Lorena falls within the 271-366 days range, representing 68.2% of listings. This suggests many properties have significant open periods on their calendars.
- Approximately 86.4% of listings show high availability (181+ days open annually), indicating potential for increased bookings or specific owner usage patterns.
- For booked days, the 31-90 days range is most frequent in Lorena (45.5%), reflecting common guest stay durations or potential owner blocking patterns.
- A notable 18.2% of properties secure long booking periods (181+ days booked per year), highlighting successful long-term rental strategies or significant owner usage.
Lorena Airbnb Minimum Stay Requirements Analysis
Distribution of Listings by Minimum Night Requirement
1 Night
9 listings
40.9% of total
2 Nights
9 listings
40.9% of total
30+ Nights
4 listings
18.2% of total
Key Insights
- The most prevalent minimum stay requirement in Lorena is 1 Night, adopted by 40.9% of listings. This highlights the market's preference for shorter, flexible bookings.
- A strong majority (81.8%) of the Lorena Airbnb data shows acceptance of very short stays (1-2 nights), indicating a dynamic, high-turnover market.
- A significant segment (18.2%) caters to monthly stays (30+ nights) in Lorena, pointing to opportunities in the extended-stay market.
Recommendations
- Align with the market by considering a 1 Night minimum stay, as 40.9% of Lorena hosts use this setting.
- Explore offering discounts for stays of 30+ nights to attract the 18.2% of the market seeking extended stays.
- Adjust minimum nights based on seasonality – potentially shorter during low season and longer during peak demand periods in Lorena.
Lorena Airbnb Cancellation Policy Trends Analysis (2026)
Flexible
4 listings
18.2% of total
Moderate
8 listings
36.4% of total
Firm
6 listings
27.3% of total
Strict
4 listings
18.2% of total
Cancellation Policy Insights for Lorena
- The prevailing Airbnb cancellation policy trend in Lorena is Moderate, used by 36.4% of listings.
- There's a relatively balanced mix between guest-friendly (54.6%) and stricter (45.5%) policies, offering choices for different guest needs.
Recommendations for Hosts
- Consider adopting a Moderate policy to align with the 36.4% market standard in Lorena.
- Regularly review your cancellation policy against competitors and market demand shifts in Lorena.
Lorena STR Booking Lead Time Analysis (2026)
Average Booking Lead Time by Month
Booking Lead Time Insights for Lorena
- The overall average booking lead time for vacation rentals in Lorena is 30 days.
- Guests book furthest in advance for stays during July (average 56 days), likely coinciding with peak travel demand or local events.
- The shortest booking windows occur for stays in February (average 8 days), indicating more last-minute travel plans during this time.
- Seasonally, Summer (35 days avg.) sees the longest lead times, while Spring (15 days avg.) has the shortest, reflecting typical travel planning cycles.
Recommendations for Hosts
- Use the overall average lead time (30 days) as a baseline for your pricing and availability strategy in Lorena.
- For July stays, consider implementing length-of-stay discounts or slightly higher rates for bookings made less than 56 days out to capitalize on advance planning.
- During February, focus on last-minute booking availability and promotions, as guests book with very short notice (8 days avg.).
- Target marketing efforts for the Summer season well in advance (at least 35 days) to capture early planners.
- Monitor your own booking lead times against these Lorena averages to identify opportunities for dynamic pricing adjustments.
Popular & Essential Airbnb Amenities in Lorena (2026)
Amenity Prevalence
Amenity Insights for Lorena
- Essential amenities in Lorena that guests expect include: Wifi. Lacking these (this) could significantly impact bookings.
- Popular amenities like Kitchen, Cooking basics, Dishes and silverware are common but not universal. Offering these can provide a competitive edge.
Recommendations for Hosts
- Ensure your listing includes all essential amenities for Lorena: Wifi.
- Prioritize adding missing essentials: Wifi.
- Consider adding popular differentiators like Kitchen or Cooking basics to increase appeal.
- Highlight unique or less common amenities you offer (e.g., hot tub, dedicated workspace, EV charger) in your listing description and photos.
- Regularly check competitor amenities in Lorena to stay competitive.
Lorena Airbnb Guest Demographics & Profile Analysis (2026)
Guest Profile Summary for Lorena
- The typical guest profile for Airbnb in Lorena consists of primarily domestic travelers (94%), often arriving from nearby São Paulo, typically belonging to the Post-2000s (Gen Z/Alpha) group (50%), primarily speaking Portuguese or English.
- Domestic travelers account for 93.6% of guests.
- Key international markets include Brazil (93.6%) and Ireland (1.3%).
- Top languages spoken are Portuguese (43.1%) followed by English (27.7%).
- A significant demographic segment is the Post-2000s (Gen Z/Alpha) group, representing 50% of guests.
Recommendations for Hosts
- Target domestic marketing efforts towards travelers from São Paulo and Rio de Janeiro.
- Tailor amenities and listing descriptions to appeal to the dominant Post-2000s (Gen Z/Alpha) demographic (e.g., highlight fast WiFi, smart home features, local guides).
- Highlight unique local experiences or amenities relevant to the primary guest profile.
- Consider seasonal promotions aligned with peak travel times for key origin markets.
Nearby Short-Term Rental Market Comparison
How does the Lorena Airbnb market stack up against its neighbors? Compare key performance metrics like average monthly revenue, ADR, and occupancy rates in surrounding areas to understand the broader regional STR landscape.
| Market | Active Properties | Monthly Revenue | Daily Rate | Avg. Occupancy |
|---|---|---|---|---|
| Riviera de São Lourenço | 10 | $2,868 | $213.78 | 46% |
| Ilha Grande | 11 | $1,783 | $166.42 | 38% |
| Tuiuti | 18 | $1,686 | $156.45 | 30% |
| Morungaba | 31 | $1,435 | $263.39 | 27% |
| Campo Limpo Paulista | 49 | $1,428 | $181.02 | 30% |
| Valinhos | 61 | $1,370 | $176.28 | 33% |
| Itatiba | 171 | $1,331 | $177.58 | 29% |
| Vargem | 48 | $1,319 | $190.42 | 28% |
| Queluz | 17 | $1,291 | $152.05 | 30% |
| Bom Jesus dos Perdões | 83 | $1,236 | $167.74 | 28% |