Juquitiba Airbnb Market Analysis 2026: Short Term Rental Data & Vacation Rental Statistics in São Paulo, Brazil
Is Airbnb profitable in Juquitiba in 2026? Explore comprehensive Airbnb analytics for Juquitiba, São Paulo, Brazil to uncover income potential. This 2026 STR market report for Juquitiba, based on AirROI data from February 2025 to January 2026, reveals key trends in the niche market of 140 active listings.
Whether you're considering an Airbnb investment in Juquitiba, optimizing your existing vacation rental, or exploring rental arbitrage opportunities, understanding the Juquitiba Airbnb data is crucial. Leveraging the low regulation environment is key to maximizing your short term rental income potential. Let's dive into the specifics.
Key Juquitiba Airbnb Performance Metrics Overview
Monthly Airbnb Revenue Variations & Income Potential in Juquitiba (2026)
Understanding the monthly revenue variations for Airbnb listings in Juquitiba is key to maximizing your short term rental income potential. Seasonality significantly impacts earnings. Our analysis, based on data from the past 12 months, shows that the peak revenue month for STRs in Juquitiba is typically December, while September often presents the lowest earnings, highlighting opportunities for strategic pricing adjustments during shoulder and low seasons. Explore the typical Airbnb income in Juquitiba across different performance tiers:
- Best-in-class properties (Top 10%) achieve $2,145+ monthly, often utilizing dynamic pricing and superior guest experiences.
- Strong performing properties (Top 25%) earn $1,156 or more, indicating effective management and desirable locations/amenities.
- Typical properties (Median) generate around $573 per month, representing the average market performance.
- Entry-level properties (Bottom 25%) see earnings around $265, often with potential for optimization.
Average Monthly Airbnb Earnings Trend in Juquitiba
Juquitiba Airbnb Occupancy Rate Trends (2026)
Maximize your bookings by understanding the Juquitiba STR occupancy trends. Seasonal demand shifts significantly influence how often properties are booked. Typically, Marchsees the highest demand (peak season occupancy), while September experiences the lowest (low season). Effective strategies, like adjusting minimum stays or offering promotions, can boost occupancy during slower periods. Here's how different property tiers perform in Juquitiba:
- Best-in-class properties (Top 10%) achieve 52%+ occupancy, indicating high desirability and potentially optimized availability.
- Strong performing properties (Top 25%) maintain 32% or higher occupancy, suggesting good market fit and guest satisfaction.
- Typical properties (Median) have an occupancy rate around 20%.
- Entry-level properties (Bottom 25%) average 11% occupancy, potentially facing higher vacancy.
Average Monthly Occupancy Rate Trend in Juquitiba
Average Daily Rate (ADR) Airbnb Trends in Juquitiba (2026)
Effective short term rental pricing strategy in Juquitiba involves understanding monthly ADR fluctuations. The Average Daily Rate (ADR) for Airbnb in Juquitiba typically peaks in December and dips lowest during February. Leveraging Airbnb dynamic pricing tools or strategies based on this seasonality can significantly boost revenue. Here's a look at the typical nightly rates achieved:
- Best-in-class properties (Top 10%) command rates of $217+ per night, often due to premium features or locations.
- Strong performing properties (Top 25%) achieve nightly rates of $151 or more.
- Typical properties (Median) charge around $98 per night.
- Entry-level properties (Bottom 25%) earn around $62 per night.
Average Daily Rate (ADR) Trend by Month in Juquitiba
Get Live Juquitiba Market Intelligence 👇

Explore Real-time Analytics
Airbnb Seasonality Analysis & Trends in Juquitiba (2026)
Peak Season (December, March, April)
- Revenue averages $1,099 per month
- Occupancy rates average 28.7%
- Daily rates average $121
Shoulder Season
- Revenue averages $877 per month
- Occupancy maintains around 24.6%
- Daily rates hold near $120
Low Season (June, August, September)
- Revenue drops to average $682 per month
- Occupancy decreases to average 20.5%
- Daily rates adjust to average $118
Seasonality Insights for Juquitiba
- The Airbnb seasonality in Juquitiba shows highly seasonal trends requiring careful strategy. While the sections above show seasonal averages, it's also insightful to look at the extremes:
- During the high season, the absolute peak month showcases Juquitiba's highest earning potential, with monthly revenues capable of climbing to $1,282, occupancy reaching a high of 30.5%, and ADRs peaking at $135.
- Conversely, the slowest single month of the year, typically falling within the low season, marks the market's lowest point. In this month, revenue might dip to $631, occupancy could drop to 19.4%, and ADRs may adjust down to $111.
- Understanding both the seasonal averages and these monthly peaks and troughs in revenue, occupancy, and ADR is crucial for maximizing your Airbnb profit potential in Juquitiba.
Seasonal Strategies for Maximizing Profit
- Peak Season: Maximize revenue through premium pricing and potentially longer minimum stays. Ensure high availability.
- Low Season: Offer competitive pricing, special promotions (e.g., extended stay discounts), and flexible cancellation policies. Target off-season travelers like remote workers or budget-conscious guests.
- Shoulder Seasons: Implement dynamic pricing that balances peak and low rates. Target weekend travelers or specific events. Offer slightly more flexible terms than peak season.
- Regularly analyze your own performance against these Juquitiba seasonality benchmarks and adjust your pricing and availability strategy accordingly.
Best Areas for Airbnb Investment in Juquitiba (2026)
Exploring the top neighborhoods for short-term rentals in Juquitiba? This section highlights key areas, outlining why they are attractive for hosts and guests, along with notable local attractions. Consider these locations based on your target guest profile and investment strategy.
| Neighborhood / Area | Why Host Here? (Target Guests & Appeal) | Key Attractions & Landmarks |
|---|---|---|
| Centro de Juquitiba | The city center with easy access to local amenities, shops, and restaurants. Great for travelers wanting to explore the local culture and community. | Juquitiba Municipal Market, Igreja Matriz de Juquitiba, Praça da Matriz, local shops and cafes |
| Cachoeiras de Juquitiba | Famous for its beautiful waterfalls, this area is perfect for nature lovers and adventure seekers looking to enjoy outdoor activities and tranquility. | Cachoeira do Sucuuba, Cachoeira do Pindaiba, nature trails, bird watching |
| Parque Estadual de Juquitiba | A natural park offering numerous hiking trails and diverse flora and fauna, ideal for eco-tourism and outdoor activities. | hiking trails, picnic areas, wildlife viewing, natural landscapes |
| Morro do Palácio | A stunning viewpoint and hiking destination, attracting tourists seeking panoramic views and outdoor adventures. | Morro do Palácio viewpoint, scenic hiking trails |
| Bairros do Jd. São Paulo | Residential area with a strong sense of community, appealing to families and longer-term guests looking for a homely experience. | local parks, community events, family-friendly amenities |
| Caminho do Ouro | Rich in history and natural beauty, this area is great for those interested in the region's gold mining past and exploration of nature. | historical sites, scenic walks, local histories |
| Represa de Juquitiba | A popular spot for fishing, kayaking, and relaxing by the water, appealing to families and group outings. | fishing spots, kayaking, picnic areas, water activities |
| Área Rural de Juquitiba | The rural areas around Juquitiba are ideal for those seeking peace and quiet, with opportunities for agro-tourism and relaxation in nature. | farm tours, local produce, rural landscapes, tranquility |
Understanding Airbnb License Requirements & STR Laws in Juquitiba (2026)
While Juquitiba, São Paulo, Brazil currently shows low STR regulations, specific Airbnb license requirements might still exist or change. Always verify the latest short term rental regulations and Airbnb license requirements directly with local government authorities for Juquitiba to ensure full compliance before hosting.
(Source: AirROI data, 2026, finding no licensed listings among those analyzed)
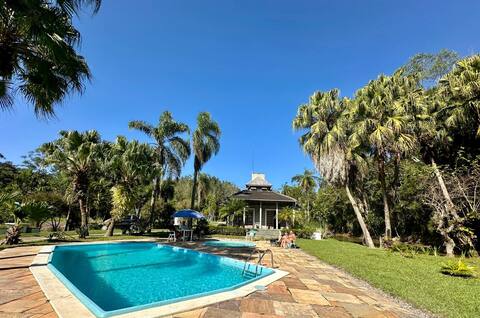
Top Performing Airbnb Properties in Juquitiba (2026)
Benchmark your potential! Explore examples of top-performing Airbnb properties in Juquitibabased on Trailing Twelve Month (TTM) revenue. Analyze their characteristics, revenue, occupancy rate, and ADR to understand what drives success in this market.

Chácara Sonho Meu Juquitiba - SP
Entire Place • 5 bedrooms
Paraíso Verde Ranch
Entire Place • 10 bedrooms

Accommodation, Leisure and Events in the midst of Nature!
Entire Place • 8 bedrooms

Chacara Farm, Heated Pool, Easy Access
Entire Place • 4 bedrooms
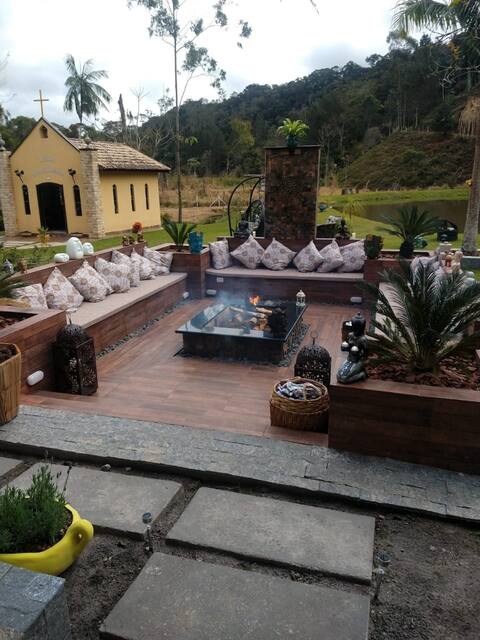
Ranch with swimming pool, barbecue area, fireplace and lake
Entire Place • 6 bedrooms

Beautiful place, heated pool.
Entire Place • 5 bedrooms
Note: Performance varies based on location, size, amenities, seasonality, and management quality. Data reflects the past 12 months.
Top Performing Airbnb Hosts in Juquitiba (2026)
Learn from the best! This table showcases top-performing Airbnb hosts in Juquitiba based on the number of properties managed and estimated total revenue over the past year. Analyze their scale and performance metrics.
| Host Name | Properties | Grossing Revenue | Stay Reviews | Avg Rating |
|---|---|---|---|---|
| Naty | 10 | $97,602 | 34 | 4.81/5.0 |
| Mônica E Léo | 1 | $45,612 | 80 | 4.88/5.0 |
| Patricia | 2 | $41,240 | 13 | 4.67/5.0 |
| Maria Fernanda | 1 | $36,038 | 21 | 4.95/5.0 |
| Daniel | 3 | $31,877 | 537 | 4.91/5.0 |
| Gabriel | 1 | $30,580 | 25 | 4.80/5.0 |
| Julia | 1 | $28,409 | 34 | 5.00/5.0 |
| Adriano | 1 | $25,408 | 92 | 4.86/5.0 |
| Larissa | 1 | $23,487 | 13 | 4.92/5.0 |
| Julia | 1 | $21,871 | 107 | 4.80/5.0 |
Analyzing the strategies of top hosts, such as their property selection, pricing, and guest communication, can offer valuable lessons for optimizing your own Airbnb operations in Juquitiba.
Dive Deeper: Advanced Juquitiba STR Market Data (2026)
Ready to unlock more insights? AirROI provides access to advanced metrics and comprehensive Airbnb data for Juquitiba. Explore detailed analytics beyond this report to refine your investment strategy, optimize pricing, and maximize your vacation rental profits.
Explore Advanced MetricsJuquitiba Short-Term Rental Market Composition (2026): Property & Room Types
Room Type Distribution
Property Type Distribution
Market Composition Insights for Juquitiba
- The Juquitiba Airbnb market composition is heavily skewed towards Entire Home/Apt listings, which make up 90% of the 140 active rentals. This indicates strong guest preference for privacy and space.
- Looking at the property type distribution in Juquitiba, House properties are the most common (69.3%), reflecting the local real estate landscape.
- Houses represent a significant 69.3% portion, catering likely to families or larger groups.
- The presence of 5.7% Hotel/Boutique listings indicates integration with traditional hospitality.
- Smaller segments like unique stays, others (combined 2.1%) offer potential for unique stay experiences.
Juquitiba Airbnb Room Capacity Analysis (2026): Bedroom Distribution
Distribution of Listings by Number of Bedrooms
Room Capacity Insights for Juquitiba
- The dominant room capacity in Juquitiba is 5+ bedrooms listings, making up 23.6% of the market. This suggests a strong demand for properties suitable for families or small groups.
- Together, 5+ bedrooms and 1 bedroom properties represent 45.0% of the active Airbnb listings in Juquitiba, indicating a high concentration in these sizes.
- A significant 60.7% of listings offer 3+ bedrooms, catering to larger groups and families seeking more space in Juquitiba.
Juquitiba Vacation Rental Guest Capacity Trends (2026)
Distribution of Listings by Guest Capacity
Guest Capacity Insights for Juquitiba
- The most common guest capacity trend in Juquitiba vacation rentals is listings accommodating 8+ guests (61.4%). This suggests the primary traveler segment is likely larger groups.
- Properties designed for 8+ guests and 2 guests dominate the Juquitiba STR market, accounting for 72.1% of listings.
- 67.8% of properties accommodate 6+ guests, serving the market segment for larger families or group travel in Juquitiba.
- On average, properties in Juquitiba are equipped to host 6.0 guests.
Juquitiba Airbnb Booking Patterns (2026): Available vs. Booked Days
Available Days Distribution
Booked Days Distribution
Booking Pattern Insights for Juquitiba
- The most common availability pattern in Juquitiba falls within the 271-366 days range, representing 84.3% of listings. This suggests many properties have significant open periods on their calendars.
- Approximately 96.4% of listings show high availability (181+ days open annually), indicating potential for increased bookings or specific owner usage patterns.
- For booked days, the 1-30 days range is most frequent in Juquitiba (41.4%), reflecting common guest stay durations or potential owner blocking patterns.
- A notable 4.3% of properties secure long booking periods (181+ days booked per year), highlighting successful long-term rental strategies or significant owner usage.
Juquitiba Airbnb Minimum Stay Requirements Analysis
Distribution of Listings by Minimum Night Requirement
1 Night
54 listings
38.6% of total
2 Nights
58 listings
41.4% of total
4-6 Nights
1 listings
0.7% of total
30+ Nights
27 listings
19.3% of total
Key Insights
- The most prevalent minimum stay requirement in Juquitiba is 2 Nights, adopted by 41.4% of listings. This highlights the market's preference for shorter, flexible bookings.
- A strong majority (80.0%) of the Juquitiba Airbnb data shows acceptance of very short stays (1-2 nights), indicating a dynamic, high-turnover market.
- A significant segment (19.3%) caters to monthly stays (30+ nights) in Juquitiba, pointing to opportunities in the extended-stay market.
Recommendations
- Align with the market by considering a 2 Nights minimum stay, as 41.4% of Juquitiba hosts use this setting.
- Explore offering discounts for stays of 30+ nights to attract the 19.3% of the market seeking extended stays.
- Adjust minimum nights based on seasonality – potentially shorter during low season and longer during peak demand periods in Juquitiba.
Juquitiba Airbnb Cancellation Policy Trends Analysis (2026)
Super Strict 60 Days
10 listings
7.1% of total
Flexible
36 listings
25.7% of total
Moderate
37 listings
26.4% of total
Firm
50 listings
35.7% of total
Strict
7 listings
5% of total
Cancellation Policy Insights for Juquitiba
- The prevailing Airbnb cancellation policy trend in Juquitiba is Firm, used by 35.7% of listings.
- There's a relatively balanced mix between guest-friendly (52.1%) and stricter (40.7%) policies, offering choices for different guest needs.
- Strict cancellation policies are quite rare (5%), potentially making listings with this policy less competitive unless justified by high demand or property type.
Recommendations for Hosts
- Consider adopting a Firm policy to align with the 35.7% market standard in Juquitiba.
- Using a Strict policy might deter some guests, as only 5% of listings use it. Evaluate if potential revenue protection outweighs possible lower booking rates.
- Regularly review your cancellation policy against competitors and market demand shifts in Juquitiba.
Juquitiba STR Booking Lead Time Analysis (2026)
Average Booking Lead Time by Month
Booking Lead Time Insights for Juquitiba
- The overall average booking lead time for vacation rentals in Juquitiba is 41 days.
- Guests book furthest in advance for stays during December (average 81 days), likely coinciding with peak travel demand or local events.
- The shortest booking windows occur for stays in June (average 18 days), indicating more last-minute travel plans during this time.
- Seasonally, Winter (47 days avg.) sees the longest lead times, while Summer (22 days avg.) has the shortest, reflecting typical travel planning cycles.
Recommendations for Hosts
- Use the overall average lead time (41 days) as a baseline for your pricing and availability strategy in Juquitiba.
- For December stays, consider implementing length-of-stay discounts or slightly higher rates for bookings made less than 81 days out to capitalize on advance planning.
- Target marketing efforts for the Winter season well in advance (at least 47 days) to capture early planners.
- Monitor your own booking lead times against these Juquitiba averages to identify opportunities for dynamic pricing adjustments.
Popular & Essential Airbnb Amenities in Juquitiba (2026)
Amenity Prevalence
Amenity Insights for Juquitiba
- Essential amenities in Juquitiba that guests expect include: Free parking on premises, Kitchen. Lacking these (any) could significantly impact bookings.
- Popular amenities like Wifi, BBQ grill, Pets allowed are common but not universal. Offering these can provide a competitive edge.
- A pool is a highly desired but not standard amenity, making it a key feature for attracting guests seeking leisure in Juquitiba.
- Warning: Wifi is not universally provided but is considered essential globally. Ensure reliable Wifi is offered.
Recommendations for Hosts
- Ensure your listing includes all essential amenities for Juquitiba: Free parking on premises, Kitchen.
- Prioritize adding missing essentials: Free parking on premises, Kitchen.
- Consider adding popular differentiators like Wifi or BBQ grill to increase appeal.
- Highlight unique or less common amenities you offer (e.g., hot tub, dedicated workspace, EV charger) in your listing description and photos.
- Regularly check competitor amenities in Juquitiba to stay competitive.
Juquitiba Airbnb Guest Demographics & Profile Analysis (2026)
Guest Profile Summary for Juquitiba
- The typical guest profile for Airbnb in Juquitiba consists of primarily domestic travelers (96%), often arriving from nearby São Paulo, typically belonging to the Post-2000s (Gen Z/Alpha) group (50%), primarily speaking Portuguese or English.
- Domestic travelers account for 96.1% of guests.
- Key international markets include Brazil (96.1%) and United States (1.3%).
- Top languages spoken are Portuguese (46.9%) followed by English (30.5%).
- A significant demographic segment is the Post-2000s (Gen Z/Alpha) group, representing 50% of guests.
Recommendations for Hosts
- Target domestic marketing efforts towards travelers from São Paulo and Santo André.
- Tailor amenities and listing descriptions to appeal to the dominant Post-2000s (Gen Z/Alpha) demographic (e.g., highlight fast WiFi, smart home features, local guides).
- Highlight unique local experiences or amenities relevant to the primary guest profile.
- Consider seasonal promotions aligned with peak travel times for key origin markets.
Nearby Short-Term Rental Market Comparison
How does the Juquitiba Airbnb market stack up against its neighbors? Compare key performance metrics like average monthly revenue, ADR, and occupancy rates in surrounding areas to understand the broader regional STR landscape.
| Market | Active Properties | Monthly Revenue | Daily Rate | Avg. Occupancy |
|---|---|---|---|---|
| Riviera de São Lourenço | 10 | $2,868 | $213.78 | 46% |
| Tuiuti | 18 | $1,686 | $156.45 | 30% |
| Itupeva | 136 | $1,561 | $225.82 | 28% |
| Morungaba | 31 | $1,435 | $263.39 | 27% |
| Campo Limpo Paulista | 49 | $1,428 | $181.02 | 30% |
| Valinhos | 61 | $1,370 | $176.28 | 33% |
| Itatiba | 171 | $1,331 | $177.58 | 29% |
| Vargem | 48 | $1,319 | $190.42 | 28% |
| Elias Fausto | 13 | $1,296 | $143.78 | 30% |
| Porto Feliz | 69 | $1,279 | $260.86 | 27% |