Itupeva Airbnb Market Analysis 2026: Short Term Rental Data & Vacation Rental Statistics in São Paulo, Brazil
Is Airbnb profitable in Itupeva in 2026? Explore comprehensive Airbnb analytics for Itupeva, São Paulo, Brazil to uncover income potential. This 2026 STR market report for Itupeva, based on AirROI data from February 2025 to January 2026, reveals key trends in the niche market of 136 active listings.
Whether you're considering an Airbnb investment in Itupeva, optimizing your existing vacation rental, or exploring rental arbitrage opportunities, understanding the Itupeva Airbnb data is crucial. Leveraging the low regulation environment is key to maximizing your short term rental income potential. Let's dive into the specifics.
Key Itupeva Airbnb Performance Metrics Overview
Monthly Airbnb Revenue Variations & Income Potential in Itupeva (2026)
Understanding the monthly revenue variations for Airbnb listings in Itupeva is key to maximizing your short term rental income potential. Seasonality significantly impacts earnings. Our analysis, based on data from the past 12 months, shows that the peak revenue month for STRs in Itupeva is typically December, while August often presents the lowest earnings, highlighting opportunities for strategic pricing adjustments during shoulder and low seasons. Explore the typical Airbnb income in Itupeva across different performance tiers:
- Best-in-class properties (Top 10%) achieve $4,912+ monthly, often utilizing dynamic pricing and superior guest experiences.
- Strong performing properties (Top 25%) earn $3,006 or more, indicating effective management and desirable locations/amenities.
- Typical properties (Median) generate around $1,434 per month, representing the average market performance.
- Entry-level properties (Bottom 25%) see earnings around $633, often with potential for optimization.
Average Monthly Airbnb Earnings Trend in Itupeva
Itupeva Airbnb Occupancy Rate Trends (2026)
Maximize your bookings by understanding the Itupeva STR occupancy trends. Seasonal demand shifts significantly influence how often properties are booked. Typically, Marchsees the highest demand (peak season occupancy), while August experiences the lowest (low season). Effective strategies, like adjusting minimum stays or offering promotions, can boost occupancy during slower periods. Here's how different property tiers perform in Itupeva:
- Best-in-class properties (Top 10%) achieve 65%+ occupancy, indicating high desirability and potentially optimized availability.
- Strong performing properties (Top 25%) maintain 46% or higher occupancy, suggesting good market fit and guest satisfaction.
- Typical properties (Median) have an occupancy rate around 26%.
- Entry-level properties (Bottom 25%) average 13% occupancy, potentially facing higher vacancy.
Average Monthly Occupancy Rate Trend in Itupeva
Average Daily Rate (ADR) Airbnb Trends in Itupeva (2026)
Effective short term rental pricing strategy in Itupeva involves understanding monthly ADR fluctuations. The Average Daily Rate (ADR) for Airbnb in Itupeva typically peaks in December and dips lowest during April. Leveraging Airbnb dynamic pricing tools or strategies based on this seasonality can significantly boost revenue. Here's a look at the typical nightly rates achieved:
- Best-in-class properties (Top 10%) command rates of $371+ per night, often due to premium features or locations.
- Strong performing properties (Top 25%) achieve nightly rates of $264 or more.
- Typical properties (Median) charge around $195 per night.
- Entry-level properties (Bottom 25%) earn around $142 per night.
Average Daily Rate (ADR) Trend by Month in Itupeva
Get Live Itupeva Market Intelligence 👇

Explore Real-time Analytics
Airbnb Seasonality Analysis & Trends in Itupeva (2026)
Peak Season (December, March, January)
- Revenue averages $2,955 per month
- Occupancy rates average 36.0%
- Daily rates average $239
Shoulder Season
- Revenue averages $1,977 per month
- Occupancy maintains around 30.8%
- Daily rates hold near $212
Low Season (June, August, September)
- Revenue drops to average $1,613 per month
- Occupancy decreases to average 25.8%
- Daily rates adjust to average $216
Seasonality Insights for Itupeva
- The Airbnb seasonality in Itupeva shows highly seasonal trends requiring careful strategy. While the sections above show seasonal averages, it's also insightful to look at the extremes:
- During the high season, the absolute peak month showcases Itupeva's highest earning potential, with monthly revenues capable of climbing to $3,510, occupancy reaching a high of 40.2%, and ADRs peaking at $262.
- Conversely, the slowest single month of the year, typically falling within the low season, marks the market's lowest point. In this month, revenue might dip to $1,429, occupancy could drop to 23.5%, and ADRs may adjust down to $200.
- Understanding both the seasonal averages and these monthly peaks and troughs in revenue, occupancy, and ADR is crucial for maximizing your Airbnb profit potential in Itupeva.
Seasonal Strategies for Maximizing Profit
- Peak Season: Maximize revenue through premium pricing and potentially longer minimum stays. Ensure high availability.
- Low Season: Offer competitive pricing, special promotions (e.g., extended stay discounts), and flexible cancellation policies. Target off-season travelers like remote workers or budget-conscious guests.
- Shoulder Seasons: Implement dynamic pricing that balances peak and low rates. Target weekend travelers or specific events. Offer slightly more flexible terms than peak season.
- Regularly analyze your own performance against these Itupeva seasonality benchmarks and adjust your pricing and availability strategy accordingly.
Best Areas for Airbnb Investment in Itupeva (2026)
Exploring the top neighborhoods for short-term rentals in Itupeva? This section highlights key areas, outlining why they are attractive for hosts and guests, along with notable local attractions. Consider these locations based on your target guest profile and investment strategy.
| Neighborhood / Area | Why Host Here? (Target Guests & Appeal) | Key Attractions & Landmarks |
|---|---|---|
| Centro de Itupeva | The central area of Itupeva is the hub of activity, with easy access to local amenities, restaurants, and shops. It's an ideal location for travelers who want to experience the local culture and convenience. | Shopping Serra Azul, Itupeva Shopping, Parque da Cidade, Igreja Matriz de Itupeva, Alameda dos Pássaros |
| Jardim São Marco | A residential neighborhood known for its tranquility and family-friendly atmosphere. It's perfect for families or groups seeking a peaceful retreat with nearby parks and leisure activities. | Parque do Teleférico, Recinto de Exposições, Colégio São Marcos, Parque Natural de Itupeva |
| Jaguaré | Located near nature reserves, this area attracts those looking for a getaway close to nature and outdoor activities. Ideal for eco-tourism and guests wanting to explore the natural landscape. | Parque Natural Municipal de Jaguari, Caminho da Luz, Trilha do Maru, Reserva Natural Serra do Japi |
| Nova Itupeva | A developing area that is becoming increasingly popular due to new construction and modern amenities. Great for discerning travelers looking for new experiences and modern accommodations. | Parque Joy, Igreja Nossa Senhora Aparecida, Caminho da Luz, Centro de Eventos de Itupeva |
| Portal dos Gramados | A gated community area with a focus on security and comfort, catering to those looking for a luxurious stay in a serene environment while still being close to urban facilities. | Shopping outlets, Restaurants at Outlet Premium, Golf Course |
| Chácara Pignatari | Known for its recreational options and rural charm. Suitable for guests looking for a countryside experience while still near urban conveniences. | Horto Florestal, Fazenda Pignatari, Trilhas para caminhadas |
| Bairro dos Pires | An emerging area with a mix of suburban and urban living. Attracting a variety of guests from families to business travelers looking for a local experience. | Vila São Francisco, Escolas locais, Mercado Municipal |
| Aldeia da Serra | A higher-end residential area known for its green spaces and leisure activities. Attractive for guests who prefer a luxurious stay with access to nature and recreation. | Lagoa do Moinho, Clube de Campo, Parque da Aldeia |
Understanding Airbnb License Requirements & STR Laws in Itupeva (2026)
While Itupeva, São Paulo, Brazil currently shows low STR regulations, specific Airbnb license requirements might still exist or change. Always verify the latest short term rental regulations and Airbnb license requirements directly with local government authorities for Itupeva to ensure full compliance before hosting.
(Source: AirROI data, 2026, based on 1% licensed listings)
Top Performing Airbnb Properties in Itupeva (2026)
Benchmark your potential! Explore examples of top-performing Airbnb properties in Itupevabased on Trailing Twelve Month (TTM) revenue. Analyze their characteristics, revenue, occupancy rate, and ADR to understand what drives success in this market.
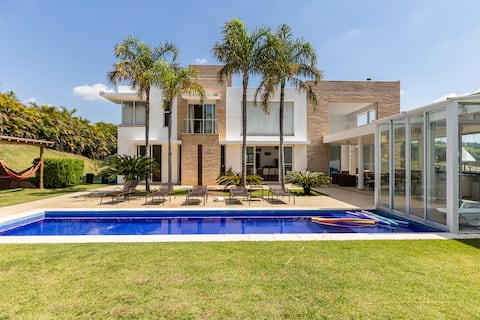
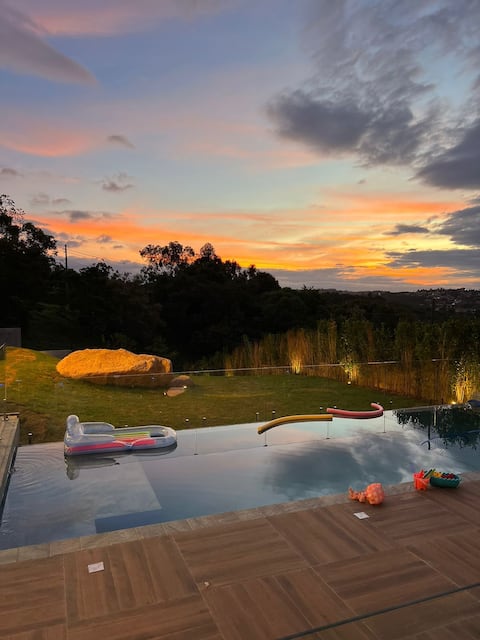
Beautiful condominium house, heated pool/sauna
Entire Place • 4 bedrooms
Modern house in a condominium with heated pool
Entire Place • 4 bedrooms

Cheerful country house with pool in Itupeva
Entire Place • 5 bedrooms

Rustic and charming house - Itupeva Forest Reserve
Entire Place • 6 bedrooms

1500 m² HOUSE CORUJAs Gated Community: Itupeva
Entire Place • 6 bedrooms

Fazenda São Pedro
Entire Place • 9 bedrooms
Note: Performance varies based on location, size, amenities, seasonality, and management quality. Data reflects the past 12 months.
Top Performing Airbnb Hosts in Itupeva (2026)
Learn from the best! This table showcases top-performing Airbnb hosts in Itupeva based on the number of properties managed and estimated total revenue over the past year. Analyze their scale and performance metrics.
| Host Name | Properties | Grossing Revenue | Stay Reviews | Avg Rating |
|---|---|---|---|---|
| Eduardo | 1 | $107,724 | 79 | 5.00/5.0 |
| Collin | 4 | $101,845 | 199 | 4.85/5.0 |
| Eduardo | 1 | $76,348 | 55 | 5.00/5.0 |
| Sonia | 1 | $72,975 | 92 | 4.99/5.0 |
| Tatiane | 1 | $70,737 | 39 | 4.92/5.0 |
| Alef | 1 | $64,152 | 168 | 4.92/5.0 |
| Isabela Moraes | 1 | $62,803 | 27 | 4.89/5.0 |
| Carla | 1 | $56,344 | 30 | 5.00/5.0 |
| Rodrigo | 1 | $56,319 | 30 | 5.00/5.0 |
| Daniel | 1 | $56,077 | 115 | 4.98/5.0 |
Analyzing the strategies of top hosts, such as their property selection, pricing, and guest communication, can offer valuable lessons for optimizing your own Airbnb operations in Itupeva.
Dive Deeper: Advanced Itupeva STR Market Data (2026)
Ready to unlock more insights? AirROI provides access to advanced metrics and comprehensive Airbnb data for Itupeva. Explore detailed analytics beyond this report to refine your investment strategy, optimize pricing, and maximize your vacation rental profits.
Explore Advanced MetricsItupeva Short-Term Rental Market Composition (2026): Property & Room Types
Room Type Distribution
Property Type Distribution
Market Composition Insights for Itupeva
- The Itupeva Airbnb market composition is heavily skewed towards Entire Home/Apt listings, which make up 97.1% of the 136 active rentals. This indicates strong guest preference for privacy and space.
- Looking at the property type distribution in Itupeva, House properties are the most common (97.1%), reflecting the local real estate landscape.
- Houses represent a significant 97.1% portion, catering likely to families or larger groups.
- Smaller segments like apartment/condo, hotel/boutique, outdoor/unique (combined 2.9%) offer potential for unique stay experiences.
Itupeva Airbnb Room Capacity Analysis (2026): Bedroom Distribution
Distribution of Listings by Number of Bedrooms
Room Capacity Insights for Itupeva
- The dominant room capacity in Itupeva is 4 bedrooms listings, making up 34.6% of the market. This suggests a strong demand for properties suitable for families or small groups.
- Together, 4 bedrooms and 3 bedrooms properties represent 62.5% of the active Airbnb listings in Itupeva, indicating a high concentration in these sizes.
- A significant 83.1% of listings offer 3+ bedrooms, catering to larger groups and families seeking more space in Itupeva.
Itupeva Vacation Rental Guest Capacity Trends (2026)
Distribution of Listings by Guest Capacity
Guest Capacity Insights for Itupeva
- The most common guest capacity trend in Itupeva vacation rentals is listings accommodating 8+ guests (84.6%). This suggests the primary traveler segment is likely larger groups.
- Properties designed for 8+ guests and 6 guests dominate the Itupeva STR market, accounting for 89.0% of listings.
- 89.0% of properties accommodate 6+ guests, serving the market segment for larger families or group travel in Itupeva.
- On average, properties in Itupeva are equipped to host 7.3 guests.
Itupeva Airbnb Booking Patterns (2026): Available vs. Booked Days
Available Days Distribution
Booked Days Distribution
Booking Pattern Insights for Itupeva
- The most common availability pattern in Itupeva falls within the 271-366 days range, representing 63.2% of listings. This suggests many properties have significant open periods on their calendars.
- Approximately 90.4% of listings show high availability (181+ days open annually), indicating potential for increased bookings or specific owner usage patterns.
- For booked days, the 31-90 days range is most frequent in Itupeva (36.8%), reflecting common guest stay durations or potential owner blocking patterns.
- A notable 10.3% of properties secure long booking periods (181+ days booked per year), highlighting successful long-term rental strategies or significant owner usage.
Itupeva Airbnb Minimum Stay Requirements Analysis
Distribution of Listings by Minimum Night Requirement
1 Night
18 listings
13.2% of total
2 Nights
71 listings
52.2% of total
3 Nights
5 listings
3.7% of total
4-6 Nights
1 listings
0.7% of total
30+ Nights
41 listings
30.1% of total
Key Insights
- The most prevalent minimum stay requirement in Itupeva is 2 Nights, adopted by 52.2% of listings. This highlights the market's preference for shorter, flexible bookings.
- A strong majority (65.4%) of the Itupeva Airbnb data shows acceptance of very short stays (1-2 nights), indicating a dynamic, high-turnover market.
- A significant segment (30.1%) caters to monthly stays (30+ nights) in Itupeva, pointing to opportunities in the extended-stay market.
Recommendations
- Align with the market by considering a 2 Nights minimum stay, as 52.2% of Itupeva hosts use this setting.
- If feasible, allowing 1-night stays, especially midweek or during low season, could capture last-minute bookings, as only 13.2% currently do.
- A 2-night minimum appears standard (52.2%). Consider this for weekends or peak periods.
- Explore offering discounts for stays of 30+ nights to attract the 30.1% of the market seeking extended stays.
- Adjust minimum nights based on seasonality – potentially shorter during low season and longer during peak demand periods in Itupeva.
Itupeva Airbnb Cancellation Policy Trends Analysis (2026)
Flexible
26 listings
19.1% of total
Moderate
36 listings
26.5% of total
Firm
57 listings
41.9% of total
Strict
17 listings
12.5% of total
Cancellation Policy Insights for Itupeva
- The prevailing Airbnb cancellation policy trend in Itupeva is Firm, used by 41.9% of listings.
- A majority (54.4%) of hosts in Itupeva utilize Firm or Strict policies, indicating a market where hosts prioritize booking security.
Recommendations for Hosts
- Consider adopting a Firm policy to align with the 41.9% market standard in Itupeva.
- Using a Strict policy might deter some guests, as only 12.5% of listings use it. Evaluate if potential revenue protection outweighs possible lower booking rates.
- Regularly review your cancellation policy against competitors and market demand shifts in Itupeva.
Itupeva STR Booking Lead Time Analysis (2026)
Average Booking Lead Time by Month
Booking Lead Time Insights for Itupeva
- The overall average booking lead time for vacation rentals in Itupeva is 34 days.
- Guests book furthest in advance for stays during December (average 69 days), likely coinciding with peak travel demand or local events.
- The shortest booking windows occur for stays in May (average 17 days), indicating more last-minute travel plans during this time.
- Seasonally, Winter (46 days avg.) sees the longest lead times, while Summer (22 days avg.) has the shortest, reflecting typical travel planning cycles.
Recommendations for Hosts
- Use the overall average lead time (34 days) as a baseline for your pricing and availability strategy in Itupeva.
- For December stays, consider implementing length-of-stay discounts or slightly higher rates for bookings made less than 69 days out to capitalize on advance planning.
- Target marketing efforts for the Winter season well in advance (at least 46 days) to capture early planners.
- Monitor your own booking lead times against these Itupeva averages to identify opportunities for dynamic pricing adjustments.
Popular & Essential Airbnb Amenities in Itupeva (2026)
Amenity Prevalence
Amenity Insights for Itupeva
- Essential amenities in Itupeva that guests expect include: TV, Wifi, Free parking on premises, Kitchen. Lacking these (any) could significantly impact bookings.
- Popular amenities like Pool, BBQ grill, Dishes and silverware are common but not universal. Offering these can provide a competitive edge.
- A pool is a highly desired but not standard amenity, making it a key feature for attracting guests seeking leisure in Itupeva.
Recommendations for Hosts
- Ensure your listing includes all essential amenities for Itupeva: TV, Wifi, Free parking on premises, Kitchen.
- Prioritize adding missing essentials: TV, Wifi, Free parking on premises, Kitchen.
- Consider adding popular differentiators like Pool or BBQ grill to increase appeal.
- Highlight unique or less common amenities you offer (e.g., hot tub, dedicated workspace, EV charger) in your listing description and photos.
- Regularly check competitor amenities in Itupeva to stay competitive.
Itupeva Airbnb Guest Demographics & Profile Analysis (2026)
Guest Profile Summary for Itupeva
- The typical guest profile for Airbnb in Itupeva consists of primarily domestic travelers (95%), often arriving from nearby São Paulo, typically belonging to the Post-2000s (Gen Z/Alpha) group (50%), primarily speaking Portuguese or English.
- Domestic travelers account for 95.0% of guests.
- Key international markets include Brazil (95%) and United States (2%).
- Top languages spoken are Portuguese (43.6%) followed by English (35.5%).
- A significant demographic segment is the Post-2000s (Gen Z/Alpha) group, representing 50% of guests.
Recommendations for Hosts
- Target domestic marketing efforts towards travelers from São Paulo and Jundiaí.
- Tailor amenities and listing descriptions to appeal to the dominant Post-2000s (Gen Z/Alpha) demographic (e.g., highlight fast WiFi, smart home features, local guides).
- Highlight unique local experiences or amenities relevant to the primary guest profile.
- Consider seasonal promotions aligned with peak travel times for key origin markets.
Nearby Short-Term Rental Market Comparison
How does the Itupeva Airbnb market stack up against its neighbors? Compare key performance metrics like average monthly revenue, ADR, and occupancy rates in surrounding areas to understand the broader regional STR landscape.
| Market | Active Properties | Monthly Revenue | Daily Rate | Avg. Occupancy |
|---|---|---|---|---|
| Riviera de São Lourenço | 10 | $2,868 | $213.78 | 46% |
| Tuiuti | 18 | $1,686 | $156.45 | 30% |
| Morungaba | 31 | $1,435 | $263.39 | 27% |
| Campo Limpo Paulista | 49 | $1,428 | $181.02 | 30% |
| Valinhos | 61 | $1,370 | $176.28 | 33% |
| Itatiba | 171 | $1,331 | $177.58 | 29% |
| Vargem | 48 | $1,319 | $190.42 | 28% |
| Elias Fausto | 13 | $1,296 | $143.78 | 30% |
| Porto Feliz | 69 | $1,279 | $260.86 | 27% |
| Tietê | 14 | $1,245 | $237.69 | 25% |