Itaí Airbnb Market Analysis 2026: Short Term Rental Data & Vacation Rental Statistics in São Paulo, Brazil
Is Airbnb profitable in Itaí in 2026? Explore comprehensive Airbnb analytics for Itaí, São Paulo, Brazil to uncover income potential. This 2026 STR market report for Itaí, based on AirROI data from February 2025 to January 2026, reveals key trends in the niche market of 88 active listings.
Whether you're considering an Airbnb investment in Itaí, optimizing your existing vacation rental, or exploring rental arbitrage opportunities, understanding the Itaí Airbnb data is crucial. Leveraging the low regulation environment is key to maximizing your short term rental income potential. Let's dive into the specifics.
Key Itaí Airbnb Performance Metrics Overview
Monthly Airbnb Revenue Variations & Income Potential in Itaí (2026)
Understanding the monthly revenue variations for Airbnb listings in Itaí is key to maximizing your short term rental income potential. Seasonality significantly impacts earnings. Our analysis, based on data from the past 12 months, shows that the peak revenue month for STRs in Itaí is typically July, while August often presents the lowest earnings, highlighting opportunities for strategic pricing adjustments during shoulder and low seasons. Explore the typical Airbnb income in Itaí across different performance tiers:
- Best-in-class properties (Top 10%) achieve $5,346+ monthly, often utilizing dynamic pricing and superior guest experiences.
- Strong performing properties (Top 25%) earn $2,628 or more, indicating effective management and desirable locations/amenities.
- Typical properties (Median) generate around $1,126 per month, representing the average market performance.
- Entry-level properties (Bottom 25%) see earnings around $591, often with potential for optimization.
Average Monthly Airbnb Earnings Trend in Itaí
Itaí Airbnb Occupancy Rate Trends (2026)
Maximize your bookings by understanding the Itaí STR occupancy trends. Seasonal demand shifts significantly influence how often properties are booked. Typically, Julysees the highest demand (peak season occupancy), while August experiences the lowest (low season). Effective strategies, like adjusting minimum stays or offering promotions, can boost occupancy during slower periods. Here's how different property tiers perform in Itaí:
- Best-in-class properties (Top 10%) achieve 51%+ occupancy, indicating high desirability and potentially optimized availability.
- Strong performing properties (Top 25%) maintain 32% or higher occupancy, suggesting good market fit and guest satisfaction.
- Typical properties (Median) have an occupancy rate around 19%.
- Entry-level properties (Bottom 25%) average 10% occupancy, potentially facing higher vacancy.
Average Monthly Occupancy Rate Trend in Itaí
Average Daily Rate (ADR) Airbnb Trends in Itaí (2026)
Effective short term rental pricing strategy in Itaí involves understanding monthly ADR fluctuations. The Average Daily Rate (ADR) for Airbnb in Itaí typically peaks in December and dips lowest during April. Leveraging Airbnb dynamic pricing tools or strategies based on this seasonality can significantly boost revenue. Here's a look at the typical nightly rates achieved:
- Best-in-class properties (Top 10%) command rates of $458+ per night, often due to premium features or locations.
- Strong performing properties (Top 25%) achieve nightly rates of $262 or more.
- Typical properties (Median) charge around $179 per night.
- Entry-level properties (Bottom 25%) earn around $138 per night.
Average Daily Rate (ADR) Trend by Month in Itaí
Get Live Itaí Market Intelligence 👇

Explore Real-time Analytics
Airbnb Seasonality Analysis & Trends in Itaí (2026)
Peak Season (July, November, March)
- Revenue averages $3,165 per month
- Occupancy rates average 29.4%
- Daily rates average $240
Shoulder Season
- Revenue averages $2,256 per month
- Occupancy maintains around 23.1%
- Daily rates hold near $251
Low Season (February, May, August)
- Revenue drops to average $1,881 per month
- Occupancy decreases to average 21.2%
- Daily rates adjust to average $229
Seasonality Insights for Itaí
- The Airbnb seasonality in Itaí shows highly seasonal trends requiring careful strategy. While the sections above show seasonal averages, it's also insightful to look at the extremes:
- During the high season, the absolute peak month showcases Itaí's highest earning potential, with monthly revenues capable of climbing to $3,822, occupancy reaching a high of 32.1%, and ADRs peaking at $285.
- Conversely, the slowest single month of the year, typically falling within the low season, marks the market's lowest point. In this month, revenue might dip to $1,723, occupancy could drop to 18.6%, and ADRs may adjust down to $222.
- Understanding both the seasonal averages and these monthly peaks and troughs in revenue, occupancy, and ADR is crucial for maximizing your Airbnb profit potential in Itaí.
Seasonal Strategies for Maximizing Profit
- Peak Season: Maximize revenue through premium pricing and potentially longer minimum stays. Ensure high availability.
- Low Season: Offer competitive pricing, special promotions (e.g., extended stay discounts), and flexible cancellation policies. Target off-season travelers like remote workers or budget-conscious guests.
- Shoulder Seasons: Implement dynamic pricing that balances peak and low rates. Target weekend travelers or specific events. Offer slightly more flexible terms than peak season.
- Regularly analyze your own performance against these Itaí seasonality benchmarks and adjust your pricing and availability strategy accordingly.
Best Areas for Airbnb Investment in Itaí (2026)
Exploring the top neighborhoods for short-term rentals in Itaí? This section highlights key areas, outlining why they are attractive for hosts and guests, along with notable local attractions. Consider these locations based on your target guest profile and investment strategy.
| Neighborhood / Area | Why Host Here? (Target Guests & Appeal) | Key Attractions & Landmarks |
|---|---|---|
| Centro de Itaí | The heart of Itaí with easy access to local shops, restaurants, and services. Perfect for short stays and local experiences. | Itaí Municipal Market, Local cafes, Cultural events, Nearby parks, Historical landmarks |
| Praça da Matriz | A vibrant square that hosts community events and offers a picturesque setting. Great for tourists wanting to experience local culture. | Matriz Church, Artisan fairs, Food stalls, Local festivals, Scenic views |
| Parque Ecológico | A beautiful ecological park perfect for families and nature lovers, providing outdoor activities and a peaceful retreat. | Nature trails, Picnic areas, Wildlife watching, Playgrounds, Walking and cycling paths |
| Itaí Rural Area | For those seeking tranquility and nature, the rural areas around Itaí provide a serene environment, ideal for eco-tourism. | Farmland, Nature reserves, Agro-tourism experiences, Local farm products |
| Cachoeira do Itambé | A stunning waterfall nearby that attracts visitors for its natural beauty and outdoor activities such as hiking and picnicking. | Waterfall viewing, Hiking trails, Swimming spots, Photography opportunities |
| Itaí Shopping Center | Convenient shopping destination for visitors seeking local and international brands, offering a great place for leisure activities. | Shopping options, Cafes and restaurants, Entertainment areas, Seasonal events |
| Estação Ferroviária de Itaí | Historical railway station with cultural significance; a charming site for history enthusiasts and photography | Historical exhibitions, Photography spots, Cultural events |
| Itaí Cultural Space | A center for arts and culture that hosts performances, workshops, and exhibitions, drawing cultural enthusiasts. | Art exhibitions, Theater performances, Workshops, Community events |
Understanding Airbnb License Requirements & STR Laws in Itaí (2026)
While Itaí, São Paulo, Brazil currently shows low STR regulations, specific Airbnb license requirements might still exist or change. Always verify the latest short term rental regulations and Airbnb license requirements directly with local government authorities for Itaí to ensure full compliance before hosting.
(Source: AirROI data, 2026, based on 1% licensed listings)
Top Performing Airbnb Properties in Itaí (2026)
Benchmark your potential! Explore examples of top-performing Airbnb properties in Itaíbased on Trailing Twelve Month (TTM) revenue. Analyze their characteristics, revenue, occupancy rate, and ADR to understand what drives success in this market.

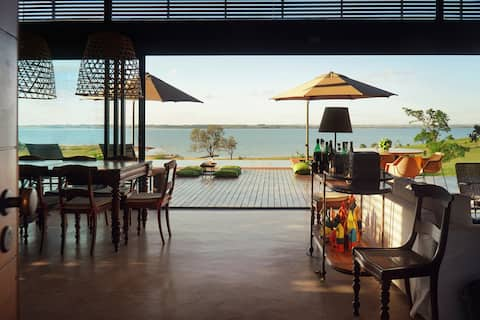
Charming, high-end and romantic lake house
Entire Place • 9 bedrooms

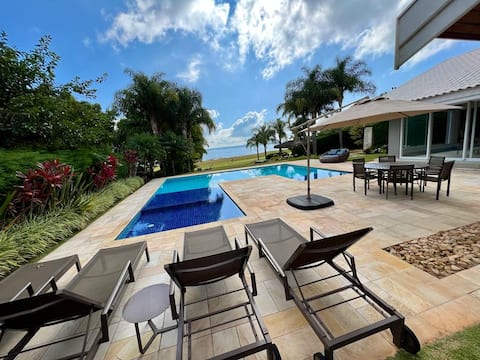
Casa Santorini - “on the sand” at the Avaré dam
Entire Place • 4 bedrooms
The House of Jurumirim's dam
Entire Place • 5 bedrooms

House in front of Avaré Dam
Entire Place • 5 bedrooms
SPECTACULAR HOUSE IN ITAI/AVARÉ
Entire Place • 6 bedrooms

Sunset House at the Avaré Dam
Entire Place • 4 bedrooms
Note: Performance varies based on location, size, amenities, seasonality, and management quality. Data reflects the past 12 months.
Top Performing Airbnb Hosts in Itaí (2026)
Learn from the best! This table showcases top-performing Airbnb hosts in Itaí based on the number of properties managed and estimated total revenue over the past year. Analyze their scale and performance metrics.
| Host Name | Properties | Grossing Revenue | Stay Reviews | Avg Rating |
|---|---|---|---|---|
| Nelson Alvarenga | 1 | $199,938 | 27 | 4.96/5.0 |
| Omar | 5 | $121,922 | 107 | 5.00/5.0 |
| Cristina | 1 | $116,665 | 75 | 4.92/5.0 |
| Dora Guerreiro | 1 | $108,140 | 179 | 4.96/5.0 |
| Marcos | 1 | $90,618 | 32 | 5.00/5.0 |
| Marilia | 1 | $67,813 | 43 | 4.95/5.0 |
| Vera Secaf | 1 | $62,198 | 34 | 4.97/5.0 |
| Clayton | 15 | $58,088 | 132 | 4.87/5.0 |
| Richard Fiorucci | 1 | $37,095 | 110 | 4.97/5.0 |
| Giovanna | 1 | $33,720 | 61 | 4.80/5.0 |
Analyzing the strategies of top hosts, such as their property selection, pricing, and guest communication, can offer valuable lessons for optimizing your own Airbnb operations in Itaí.
Dive Deeper: Advanced Itaí STR Market Data (2026)
Ready to unlock more insights? AirROI provides access to advanced metrics and comprehensive Airbnb data for Itaí. Explore detailed analytics beyond this report to refine your investment strategy, optimize pricing, and maximize your vacation rental profits.
Explore Advanced MetricsItaí Short-Term Rental Market Composition (2026): Property & Room Types
Room Type Distribution
Property Type Distribution
Market Composition Insights for Itaí
- The Itaí Airbnb market composition is heavily skewed towards Entire Home/Apt listings, which make up 96.6% of the 88 active rentals. This indicates strong guest preference for privacy and space.
- Looking at the property type distribution in Itaí, House properties are the most common (95.5%), reflecting the local real estate landscape.
- Houses represent a significant 95.5% portion, catering likely to families or larger groups.
- Smaller segments like outdoor/unique, hotel/boutique (combined 4.5%) offer potential for unique stay experiences.
Itaí Airbnb Room Capacity Analysis (2026): Bedroom Distribution
Distribution of Listings by Number of Bedrooms
Room Capacity Insights for Itaí
- The dominant room capacity in Itaí is 3 bedrooms listings, making up 39.8% of the market. This suggests a strong demand for properties suitable for families or small groups.
- Together, 3 bedrooms and 4 bedrooms properties represent 63.7% of the active Airbnb listings in Itaí, indicating a high concentration in these sizes.
- A significant 86.4% of listings offer 3+ bedrooms, catering to larger groups and families seeking more space in Itaí.
Itaí Vacation Rental Guest Capacity Trends (2026)
Distribution of Listings by Guest Capacity
Guest Capacity Insights for Itaí
- The most common guest capacity trend in Itaí vacation rentals is listings accommodating 8+ guests (86.4%). This suggests the primary traveler segment is likely larger groups.
- Properties designed for 8+ guests and 2 guests dominate the Itaí STR market, accounting for 92.1% of listings.
- 89.8% of properties accommodate 6+ guests, serving the market segment for larger families or group travel in Itaí.
- On average, properties in Itaí are equipped to host 7.3 guests.
Itaí Airbnb Booking Patterns (2026): Available vs. Booked Days
Available Days Distribution
Booked Days Distribution
Booking Pattern Insights for Itaí
- The most common availability pattern in Itaí falls within the 271-366 days range, representing 84.1% of listings. This suggests many properties have significant open periods on their calendars.
- Approximately 98.9% of listings show high availability (181+ days open annually), indicating potential for increased bookings or specific owner usage patterns.
- For booked days, the 1-30 days range is most frequent in Itaí (50%), reflecting common guest stay durations or potential owner blocking patterns.
- A notable 1.1% of properties secure long booking periods (181+ days booked per year), highlighting successful long-term rental strategies or significant owner usage.
Itaí Airbnb Minimum Stay Requirements Analysis
Distribution of Listings by Minimum Night Requirement
1 Night
24 listings
27.3% of total
2 Nights
42 listings
47.7% of total
3 Nights
4 listings
4.5% of total
30+ Nights
18 listings
20.5% of total
Key Insights
- The most prevalent minimum stay requirement in Itaí is 2 Nights, adopted by 47.7% of listings. This highlights the market's preference for shorter, flexible bookings.
- A strong majority (75.0%) of the Itaí Airbnb data shows acceptance of very short stays (1-2 nights), indicating a dynamic, high-turnover market.
- A significant segment (20.5%) caters to monthly stays (30+ nights) in Itaí, pointing to opportunities in the extended-stay market.
Recommendations
- Align with the market by considering a 2 Nights minimum stay, as 47.7% of Itaí hosts use this setting.
- If feasible, allowing 1-night stays, especially midweek or during low season, could capture last-minute bookings, as only 27.3% currently do.
- Explore offering discounts for stays of 30+ nights to attract the 20.5% of the market seeking extended stays.
- Adjust minimum nights based on seasonality – potentially shorter during low season and longer during peak demand periods in Itaí.
Itaí Airbnb Cancellation Policy Trends Analysis (2026)
Limited
1 listings
1.1% of total
Flexible
14 listings
16.1% of total
Moderate
12 listings
13.8% of total
Firm
48 listings
55.2% of total
Strict
12 listings
13.8% of total
Cancellation Policy Insights for Itaí
- The prevailing Airbnb cancellation policy trend in Itaí is Firm, used by 55.2% of listings.
- A majority (69.0%) of hosts in Itaí utilize Firm or Strict policies, indicating a market where hosts prioritize booking security.
Recommendations for Hosts
- Consider adopting a Firm policy to align with the 55.2% market standard in Itaí.
- Using a Strict policy might deter some guests, as only 13.8% of listings use it. Evaluate if potential revenue protection outweighs possible lower booking rates.
- Regularly review your cancellation policy against competitors and market demand shifts in Itaí.
Itaí STR Booking Lead Time Analysis (2026)
Average Booking Lead Time by Month
Booking Lead Time Insights for Itaí
- The overall average booking lead time for vacation rentals in Itaí is 40 days.
- Guests book furthest in advance for stays during December (average 70 days), likely coinciding with peak travel demand or local events.
- The shortest booking windows occur for stays in August (average 13 days), indicating more last-minute travel plans during this time.
- Seasonally, Winter (49 days avg.) sees the longest lead times, while Summer (22 days avg.) has the shortest, reflecting typical travel planning cycles.
Recommendations for Hosts
- Use the overall average lead time (40 days) as a baseline for your pricing and availability strategy in Itaí.
- For December stays, consider implementing length-of-stay discounts or slightly higher rates for bookings made less than 70 days out to capitalize on advance planning.
- During August, focus on last-minute booking availability and promotions, as guests book with very short notice (13 days avg.).
- Target marketing efforts for the Winter season well in advance (at least 49 days) to capture early planners.
- Monitor your own booking lead times against these Itaí averages to identify opportunities for dynamic pricing adjustments.
Popular & Essential Airbnb Amenities in Itaí (2026)
Amenity Prevalence
Amenity Insights for Itaí
- Essential amenities in Itaí that guests expect include: Free parking on premises, TV, Wifi, Kitchen. Lacking these (any) could significantly impact bookings.
- Popular amenities like BBQ grill, Pool, Dishes and silverware are common but not universal. Offering these can provide a competitive edge.
- A pool is a highly desired but not standard amenity, making it a key feature for attracting guests seeking leisure in Itaí.
Recommendations for Hosts
- Ensure your listing includes all essential amenities for Itaí: Free parking on premises, TV, Wifi, Kitchen.
- Prioritize adding missing essentials: TV, Wifi, Kitchen.
- Consider adding popular differentiators like BBQ grill or Pool to increase appeal.
- Highlight unique or less common amenities you offer (e.g., hot tub, dedicated workspace, EV charger) in your listing description and photos.
- Regularly check competitor amenities in Itaí to stay competitive.
Itaí Airbnb Guest Demographics & Profile Analysis (2026)
Guest Profile Summary for Itaí
- The typical guest profile for Airbnb in Itaí consists of primarily domestic travelers (98%), often arriving from nearby São Paulo, typically belonging to the Post-2000s (Gen Z/Alpha) group (50%), primarily speaking Portuguese or English.
- Domestic travelers account for 98.3% of guests.
- Key international markets include Brazil (98.3%) and United States (0.6%).
- Top languages spoken are Portuguese (49.2%) followed by English (32.3%).
- A significant demographic segment is the Post-2000s (Gen Z/Alpha) group, representing 50% of guests.
Recommendations for Hosts
- Target domestic marketing efforts towards travelers from São Paulo and Bauru.
- Tailor amenities and listing descriptions to appeal to the dominant Post-2000s (Gen Z/Alpha) demographic (e.g., highlight fast WiFi, smart home features, local guides).
- Highlight unique local experiences or amenities relevant to the primary guest profile.
- Consider seasonal promotions aligned with peak travel times for key origin markets.
Nearby Short-Term Rental Market Comparison
How does the Itaí Airbnb market stack up against its neighbors? Compare key performance metrics like average monthly revenue, ADR, and occupancy rates in surrounding areas to understand the broader regional STR landscape.
| Market | Active Properties | Monthly Revenue | Daily Rate | Avg. Occupancy |
|---|---|---|---|---|
| Arandu | 36 | $1,896 | $275.63 | 25% |
| Paranapanema | 169 | $1,088 | $188.08 | 25% |
| Bofete | 26 | $969 | $133.84 | 24% |
| Ribeirão Claro | 30 | $814 | $152.27 | 24% |
| Pardinho | 120 | $814 | $133.84 | 26% |
| Carlópolis | 33 | $797 | $145.43 | 25% |
| Quadra | 56 | $789 | $153.80 | 22% |
| Avaré | 74 | $708 | $167.26 | 23% |
| Águas de Santa Bárbara | 104 | $700 | $135.30 | 24% |
| Porangaba | 53 | $629 | $148.21 | 24% |