Itatiba Airbnb Market Analysis 2026: Short Term Rental Data & Vacation Rental Statistics in São Paulo, Brazil
Is Airbnb profitable in Itatiba in 2026? Explore comprehensive Airbnb analytics for Itatiba, São Paulo, Brazil to uncover income potential. This 2026 STR market report for Itatiba, based on AirROI data from February 2025 to January 2026, reveals key trends in the niche market of 171 active listings.
Whether you're considering an Airbnb investment in Itatiba, optimizing your existing vacation rental, or exploring rental arbitrage opportunities, understanding the Itatiba Airbnb data is crucial. Leveraging the low regulation environment is key to maximizing your short term rental income potential. Let's dive into the specifics.
Key Itatiba Airbnb Performance Metrics Overview
Monthly Airbnb Revenue Variations & Income Potential in Itatiba (2026)
Understanding the monthly revenue variations for Airbnb listings in Itatiba is key to maximizing your short term rental income potential. Seasonality significantly impacts earnings. Our analysis, based on data from the past 12 months, shows that the peak revenue month for STRs in Itatiba is typically December, while September often presents the lowest earnings, highlighting opportunities for strategic pricing adjustments during shoulder and low seasons. Explore the typical Airbnb income in Itatiba across different performance tiers:
- Best-in-class properties (Top 10%) achieve $4,104+ monthly, often utilizing dynamic pricing and superior guest experiences.
- Strong performing properties (Top 25%) earn $1,938 or more, indicating effective management and desirable locations/amenities.
- Typical properties (Median) generate around $826 per month, representing the average market performance.
- Entry-level properties (Bottom 25%) see earnings around $365, often with potential for optimization.
Average Monthly Airbnb Earnings Trend in Itatiba
Itatiba Airbnb Occupancy Rate Trends (2026)
Maximize your bookings by understanding the Itatiba STR occupancy trends. Seasonal demand shifts significantly influence how often properties are booked. Typically, Marchsees the highest demand (peak season occupancy), while August experiences the lowest (low season). Effective strategies, like adjusting minimum stays or offering promotions, can boost occupancy during slower periods. Here's how different property tiers perform in Itatiba:
- Best-in-class properties (Top 10%) achieve 67%+ occupancy, indicating high desirability and potentially optimized availability.
- Strong performing properties (Top 25%) maintain 46% or higher occupancy, suggesting good market fit and guest satisfaction.
- Typical properties (Median) have an occupancy rate around 26%.
- Entry-level properties (Bottom 25%) average 13% occupancy, potentially facing higher vacancy.
Average Monthly Occupancy Rate Trend in Itatiba
Average Daily Rate (ADR) Airbnb Trends in Itatiba (2026)
Effective short term rental pricing strategy in Itatiba involves understanding monthly ADR fluctuations. The Average Daily Rate (ADR) for Airbnb in Itatiba typically peaks in December and dips lowest during February. Leveraging Airbnb dynamic pricing tools or strategies based on this seasonality can significantly boost revenue. Here's a look at the typical nightly rates achieved:
- Best-in-class properties (Top 10%) command rates of $300+ per night, often due to premium features or locations.
- Strong performing properties (Top 25%) achieve nightly rates of $200 or more.
- Typical properties (Median) charge around $118 per night.
- Entry-level properties (Bottom 25%) earn around $53 per night.
Average Daily Rate (ADR) Trend by Month in Itatiba
Get Live Itatiba Market Intelligence 👇

Explore Real-time Analytics
Airbnb Seasonality Analysis & Trends in Itatiba (2026)
Peak Season (December, March, January)
- Revenue averages $2,350 per month
- Occupancy rates average 34.0%
- Daily rates average $192
Shoulder Season
- Revenue averages $1,808 per month
- Occupancy maintains around 33.2%
- Daily rates hold near $167
Low Season (June, August, September)
- Revenue drops to average $1,457 per month
- Occupancy decreases to average 28.1%
- Daily rates adjust to average $174
Seasonality Insights for Itatiba
- The Airbnb seasonality in Itatiba shows highly seasonal trends requiring careful strategy. While the sections above show seasonal averages, it's also insightful to look at the extremes:
- During the high season, the absolute peak month showcases Itatiba's highest earning potential, with monthly revenues capable of climbing to $2,760, occupancy reaching a high of 39.3%, and ADRs peaking at $215.
- Conversely, the slowest single month of the year, typically falling within the low season, marks the market's lowest point. In this month, revenue might dip to $1,404, occupancy could drop to 26.7%, and ADRs may adjust down to $149.
- Understanding both the seasonal averages and these monthly peaks and troughs in revenue, occupancy, and ADR is crucial for maximizing your Airbnb profit potential in Itatiba.
Seasonal Strategies for Maximizing Profit
- Peak Season: Maximize revenue through premium pricing and potentially longer minimum stays. Ensure high availability.
- Low Season: Offer competitive pricing, special promotions (e.g., extended stay discounts), and flexible cancellation policies. Target off-season travelers like remote workers or budget-conscious guests.
- Shoulder Seasons: Implement dynamic pricing that balances peak and low rates. Target weekend travelers or specific events. Offer slightly more flexible terms than peak season.
- Regularly analyze your own performance against these Itatiba seasonality benchmarks and adjust your pricing and availability strategy accordingly.
Best Areas for Airbnb Investment in Itatiba (2026)
Exploring the top neighborhoods for short-term rentals in Itatiba? This section highlights key areas, outlining why they are attractive for hosts and guests, along with notable local attractions. Consider these locations based on your target guest profile and investment strategy.
| Neighborhood / Area | Why Host Here? (Target Guests & Appeal) | Key Attractions & Landmarks |
|---|---|---|
| Centro | The city's central area with rich history, local markets, cafes, and restaurants. Ideal for travelers who want to experience local culture and accessibility to transportation. | Praca Rui Barbosa, Igreja Matriz de Itatiba, Museu Municipal, Feira de Artesanato, Palacete Leonor de Barros |
| Jardim São Vicente | A residential area known for its parks and family-friendly atmosphere, attracting visitors looking for a quiet stay close to nature. | Parque da Juventude, Parque Natural de Itatiba, Quinta da Boa Vista |
| Vila Nogueira | A neighborhood popular with locals, offering a more authentic Brazilian experience. Appealing for guests interested in enjoying local cuisine and culture. | Praça do Cemitério, Restaurantes Locais, Centro Cultural |
| Santa Rita de Cássia | Known for its beautiful views and serene environment, appealing to guests who prefer tranquility and relaxation during their stay. | Mirante do Vale, Sítio São João |
| Água Branca | A charming area with rural characteristics, perfect for those who enjoy agricultural tourism and nature-related activities. | Rural Tours, Estâncias, Nature Trails |
| Jardim América | A safe and quiet neighborhood with local amenities and easy access to services, suitable for families and longer stays. | Comércio Local, Parques e Praças |
| Itatiba Parque | An eco-friendly area featuring parks and green spaces, ideal for outdoor enthusiasts and nature lovers. | Parque do Lago, Caminhadas, Eventos ao ar livre |
| Condomínios Fechados | Luxurious gated communities that offer high-end accommodations and a secure environment, attracting affluent travelers seeking comfort and exclusivity. | Clubes e Lazer, Vida Noturna |
Understanding Airbnb License Requirements & STR Laws in Itatiba (2026)
While Itatiba, São Paulo, Brazil currently shows low STR regulations, specific Airbnb license requirements might still exist or change. Always verify the latest short term rental regulations and Airbnb license requirements directly with local government authorities for Itatiba to ensure full compliance before hosting.
(Source: AirROI data, 2026, finding no licensed listings among those analyzed)
Top Performing Airbnb Properties in Itatiba (2026)
Benchmark your potential! Explore examples of top-performing Airbnb properties in Itatibabased on Trailing Twelve Month (TTM) revenue. Analyze their characteristics, revenue, occupancy rate, and ADR to understand what drives success in this market.

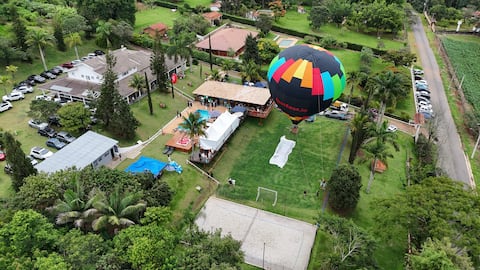
Country House with Beach Tennis Court in Itatiba
Entire Place • 7 bedrooms
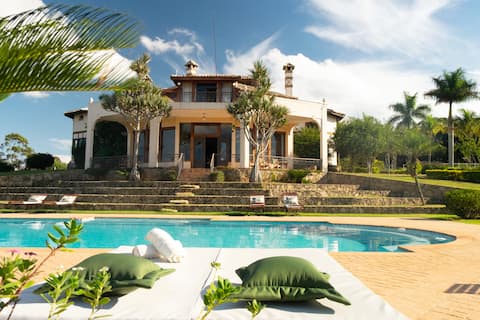
Rancho Bella Vista - All Inclusive and VIP Service
Entire Place • 10 bedrooms

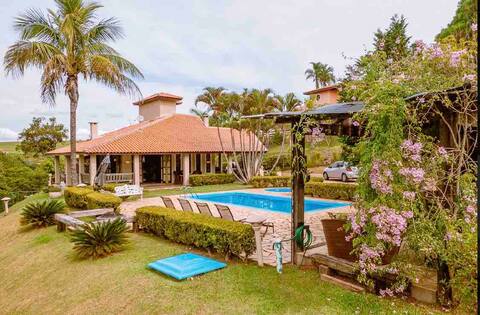
Recanto Bruna a paradise in the midst of nature
Entire Place • 8 bedrooms
Farm Boutique Villa Realli Atibaia • Main House
Entire Place • 8 bedrooms
6x interest-free Good Energy Heated Pool Wifi300
Entire Place • 4 bedrooms

Recanto do Campo. Heated pool, sauna, court+
Entire Place • 5 bedrooms
Note: Performance varies based on location, size, amenities, seasonality, and management quality. Data reflects the past 12 months.
Top Performing Airbnb Hosts in Itatiba (2026)
Learn from the best! This table showcases top-performing Airbnb hosts in Itatiba based on the number of properties managed and estimated total revenue over the past year. Analyze their scale and performance metrics.
| Host Name | Properties | Grossing Revenue | Stay Reviews | Avg Rating |
|---|---|---|---|---|
| Andrea | 1 | $282,208 | 90 | 4.97/5.0 |
| Bruno | 1 | $208,128 | 56 | 5.00/5.0 |
| Fatima | 1 | $172,345 | 147 | 4.98/5.0 |
| Fazenda Villa Realli | 1 | $102,580 | 29 | 4.93/5.0 |
| Eliana | 1 | $64,295 | 83 | 5.00/5.0 |
| Rodrigo Vidal Sj | 1 | $62,307 | 175 | 4.87/5.0 |
| Ricardo | 1 | $56,469 | 80 | 5.00/5.0 |
| Vaner | 1 | $54,195 | 93 | 4.97/5.0 |
| Alemão | 1 | $53,308 | 44 | 4.93/5.0 |
| Michel | 1 | $52,323 | 48 | 5.00/5.0 |
Analyzing the strategies of top hosts, such as their property selection, pricing, and guest communication, can offer valuable lessons for optimizing your own Airbnb operations in Itatiba.
Dive Deeper: Advanced Itatiba STR Market Data (2026)
Ready to unlock more insights? AirROI provides access to advanced metrics and comprehensive Airbnb data for Itatiba. Explore detailed analytics beyond this report to refine your investment strategy, optimize pricing, and maximize your vacation rental profits.
Explore Advanced MetricsItatiba Short-Term Rental Market Composition (2026): Property & Room Types
Room Type Distribution
Property Type Distribution
Market Composition Insights for Itatiba
- The Itatiba Airbnb market composition is heavily skewed towards Entire Home/Apt listings, which make up 94.7% of the 171 active rentals. This indicates strong guest preference for privacy and space.
- Looking at the property type distribution in Itatiba, House properties are the most common (73.7%), reflecting the local real estate landscape.
- Houses represent a significant 73.7% portion, catering likely to families or larger groups.
- Smaller segments like hotel/boutique, others (combined 6.4%) offer potential for unique stay experiences.
Itatiba Airbnb Room Capacity Analysis (2026): Bedroom Distribution
Distribution of Listings by Number of Bedrooms
Room Capacity Insights for Itatiba
- The dominant room capacity in Itatiba is 4 bedrooms listings, making up 22.2% of the market. This suggests a strong demand for properties suitable for families or small groups.
- Together, 4 bedrooms and 2 bedrooms properties represent 43.3% of the active Airbnb listings in Itatiba, indicating a high concentration in these sizes.
- A significant 55.0% of listings offer 3+ bedrooms, catering to larger groups and families seeking more space in Itatiba.
Itatiba Vacation Rental Guest Capacity Trends (2026)
Distribution of Listings by Guest Capacity
Guest Capacity Insights for Itatiba
- The most common guest capacity trend in Itatiba vacation rentals is listings accommodating 8+ guests (57.9%). This suggests the primary traveler segment is likely larger groups.
- Properties designed for 8+ guests and 2 guests dominate the Itatiba STR market, accounting for 71.4% of listings.
- 64.9% of properties accommodate 6+ guests, serving the market segment for larger families or group travel in Itatiba.
- On average, properties in Itatiba are equipped to host 6.1 guests.
Itatiba Airbnb Booking Patterns (2026): Available vs. Booked Days
Available Days Distribution
Booked Days Distribution
Booking Pattern Insights for Itatiba
- The most common availability pattern in Itatiba falls within the 271-366 days range, representing 64.9% of listings. This suggests many properties have significant open periods on their calendars.
- Approximately 88.3% of listings show high availability (181+ days open annually), indicating potential for increased bookings or specific owner usage patterns.
- For booked days, the 31-90 days range is most frequent in Itatiba (38.6%), reflecting common guest stay durations or potential owner blocking patterns.
- A notable 11.7% of properties secure long booking periods (181+ days booked per year), highlighting successful long-term rental strategies or significant owner usage.
Itatiba Airbnb Minimum Stay Requirements Analysis
Distribution of Listings by Minimum Night Requirement
1 Night
48 listings
28.1% of total
2 Nights
63 listings
36.8% of total
3 Nights
3 listings
1.8% of total
4-6 Nights
3 listings
1.8% of total
30+ Nights
54 listings
31.6% of total
Key Insights
- The most prevalent minimum stay requirement in Itatiba is 2 Nights, adopted by 36.8% of listings. This highlights the market's preference for shorter, flexible bookings.
- A strong majority (64.9%) of the Itatiba Airbnb data shows acceptance of very short stays (1-2 nights), indicating a dynamic, high-turnover market.
- A significant segment (31.6%) caters to monthly stays (30+ nights) in Itatiba, pointing to opportunities in the extended-stay market.
Recommendations
- Align with the market by considering a 2 Nights minimum stay, as 36.8% of Itatiba hosts use this setting.
- If feasible, allowing 1-night stays, especially midweek or during low season, could capture last-minute bookings, as only 28.1% currently do.
- Explore offering discounts for stays of 30+ nights to attract the 31.6% of the market seeking extended stays.
- Adjust minimum nights based on seasonality – potentially shorter during low season and longer during peak demand periods in Itatiba.
Itatiba Airbnb Cancellation Policy Trends Analysis (2026)
Flexible
38 listings
22.5% of total
Moderate
41 listings
24.3% of total
Firm
62 listings
36.7% of total
Strict
28 listings
16.6% of total
Cancellation Policy Insights for Itatiba
- The prevailing Airbnb cancellation policy trend in Itatiba is Firm, used by 36.7% of listings.
- A majority (53.3%) of hosts in Itatiba utilize Firm or Strict policies, indicating a market where hosts prioritize booking security.
Recommendations for Hosts
- Consider adopting a Firm policy to align with the 36.7% market standard in Itatiba.
- Regularly review your cancellation policy against competitors and market demand shifts in Itatiba.
Itatiba STR Booking Lead Time Analysis (2026)
Average Booking Lead Time by Month
Booking Lead Time Insights for Itatiba
- The overall average booking lead time for vacation rentals in Itatiba is 37 days.
- Guests book furthest in advance for stays during December (average 70 days), likely coinciding with peak travel demand or local events.
- The shortest booking windows occur for stays in May (average 23 days), indicating more last-minute travel plans during this time.
- Seasonally, Winter (43 days avg.) sees the longest lead times, while Spring (28 days avg.) has the shortest, reflecting typical travel planning cycles.
Recommendations for Hosts
- Use the overall average lead time (37 days) as a baseline for your pricing and availability strategy in Itatiba.
- For December stays, consider implementing length-of-stay discounts or slightly higher rates for bookings made less than 70 days out to capitalize on advance planning.
- Target marketing efforts for the Winter season well in advance (at least 43 days) to capture early planners.
- Monitor your own booking lead times against these Itatiba averages to identify opportunities for dynamic pricing adjustments.
Popular & Essential Airbnb Amenities in Itatiba (2026)
Amenity Prevalence
Amenity Insights for Itatiba
- Essential amenities in Itatiba that guests expect include: Kitchen. Lacking these (this) could significantly impact bookings.
- Popular amenities like Wifi, Free parking on premises, TV are common but not universal. Offering these can provide a competitive edge.
- A pool is a highly desired but not standard amenity, making it a key feature for attracting guests seeking leisure in Itatiba.
- Warning: Wifi is not universally provided but is considered essential globally. Ensure reliable Wifi is offered.
Recommendations for Hosts
- Ensure your listing includes all essential amenities for Itatiba: Kitchen.
- Prioritize adding missing essentials: Kitchen.
- Consider adding popular differentiators like Wifi or Free parking on premises to increase appeal.
- Highlight unique or less common amenities you offer (e.g., hot tub, dedicated workspace, EV charger) in your listing description and photos.
- Regularly check competitor amenities in Itatiba to stay competitive.
Itatiba Airbnb Guest Demographics & Profile Analysis (2026)
Guest Profile Summary for Itatiba
- The typical guest profile for Airbnb in Itatiba consists of primarily domestic travelers (95%), often arriving from nearby São Paulo, typically belonging to the Post-2000s (Gen Z/Alpha) group (50%), primarily speaking Portuguese or English.
- Domestic travelers account for 95.0% of guests.
- Key international markets include Brazil (95%) and United States (2.3%).
- Top languages spoken are Portuguese (43.6%) followed by English (32.5%).
- A significant demographic segment is the Post-2000s (Gen Z/Alpha) group, representing 50% of guests.
Recommendations for Hosts
- Target domestic marketing efforts towards travelers from São Paulo and Campinas.
- Tailor amenities and listing descriptions to appeal to the dominant Post-2000s (Gen Z/Alpha) demographic (e.g., highlight fast WiFi, smart home features, local guides).
- Highlight unique local experiences or amenities relevant to the primary guest profile.
- Consider seasonal promotions aligned with peak travel times for key origin markets.
Nearby Short-Term Rental Market Comparison
How does the Itatiba Airbnb market stack up against its neighbors? Compare key performance metrics like average monthly revenue, ADR, and occupancy rates in surrounding areas to understand the broader regional STR landscape.
| Market | Active Properties | Monthly Revenue | Daily Rate | Avg. Occupancy |
|---|---|---|---|---|
| Riviera de São Lourenço | 10 | $2,868 | $213.78 | 46% |
| Tuiuti | 18 | $1,686 | $156.45 | 30% |
| Itupeva | 136 | $1,561 | $225.82 | 28% |
| Morungaba | 31 | $1,435 | $263.39 | 27% |
| Campo Limpo Paulista | 49 | $1,428 | $181.02 | 30% |
| Valinhos | 61 | $1,370 | $176.28 | 33% |
| Vargem | 48 | $1,319 | $190.42 | 28% |
| Elias Fausto | 13 | $1,296 | $143.78 | 30% |
| Porto Feliz | 69 | $1,279 | $260.86 | 27% |
| Tietê | 14 | $1,245 | $237.69 | 25% |