Itapecerica da Serra Airbnb Market Analysis 2026: Short Term Rental Data & Vacation Rental Statistics in São Paulo, Brazil
Is Airbnb profitable in Itapecerica da Serra in 2026? Explore comprehensive Airbnb analytics for Itapecerica da Serra, São Paulo, Brazil to uncover income potential. This 2026 STR market report for Itapecerica da Serra, based on AirROI data from February 2025 to January 2026, reveals key trends in the niche market of 51 active listings.
Whether you're considering an Airbnb investment in Itapecerica da Serra, optimizing your existing vacation rental, or exploring rental arbitrage opportunities, understanding the Itapecerica da Serra Airbnb data is crucial. Leveraging the low regulation environment is key to maximizing your short term rental income potential. Let's dive into the specifics.
Key Itapecerica da Serra Airbnb Performance Metrics Overview
Monthly Airbnb Revenue Variations & Income Potential in Itapecerica da Serra (2026)
Understanding the monthly revenue variations for Airbnb listings in Itapecerica da Serra is key to maximizing your short term rental income potential. Seasonality significantly impacts earnings. Our analysis, based on data from the past 12 months, shows that the peak revenue month for STRs in Itapecerica da Serra is typically December, while August often presents the lowest earnings, highlighting opportunities for strategic pricing adjustments during shoulder and low seasons. Explore the typical Airbnb income in Itapecerica da Serra across different performance tiers:
- Best-in-class properties (Top 10%) achieve $2,007+ monthly, often utilizing dynamic pricing and superior guest experiences.
- Strong performing properties (Top 25%) earn $1,434 or more, indicating effective management and desirable locations/amenities.
- Typical properties (Median) generate around $837 per month, representing the average market performance.
- Entry-level properties (Bottom 25%) see earnings around $417, often with potential for optimization.
Average Monthly Airbnb Earnings Trend in Itapecerica da Serra
Itapecerica da Serra Airbnb Occupancy Rate Trends (2026)
Maximize your bookings by understanding the Itapecerica da Serra STR occupancy trends. Seasonal demand shifts significantly influence how often properties are booked. Typically, Marchsees the highest demand (peak season occupancy), while January experiences the lowest (low season). Effective strategies, like adjusting minimum stays or offering promotions, can boost occupancy during slower periods. Here's how different property tiers perform in Itapecerica da Serra:
- Best-in-class properties (Top 10%) achieve 76%+ occupancy, indicating high desirability and potentially optimized availability.
- Strong performing properties (Top 25%) maintain 46% or higher occupancy, suggesting good market fit and guest satisfaction.
- Typical properties (Median) have an occupancy rate around 24%.
- Entry-level properties (Bottom 25%) average 13% occupancy, potentially facing higher vacancy.
Average Monthly Occupancy Rate Trend in Itapecerica da Serra
Average Daily Rate (ADR) Airbnb Trends in Itapecerica da Serra (2026)
Effective short term rental pricing strategy in Itapecerica da Serra involves understanding monthly ADR fluctuations. The Average Daily Rate (ADR) for Airbnb in Itapecerica da Serra typically peaks in December and dips lowest during September. Leveraging Airbnb dynamic pricing tools or strategies based on this seasonality can significantly boost revenue. Here's a look at the typical nightly rates achieved:
- Best-in-class properties (Top 10%) command rates of $344+ per night, often due to premium features or locations.
- Strong performing properties (Top 25%) achieve nightly rates of $244 or more.
- Typical properties (Median) charge around $134 per night.
- Entry-level properties (Bottom 25%) earn around $64 per night.
Average Daily Rate (ADR) Trend by Month in Itapecerica da Serra
Get Live Itapecerica da Serra Market Intelligence 👇

Explore Real-time Analytics
Airbnb Seasonality Analysis & Trends in Itapecerica da Serra (2026)
Peak Season (December, March, January)
- Revenue averages $1,420 per month
- Occupancy rates average 33.1%
- Daily rates average $178
Shoulder Season
- Revenue averages $924 per month
- Occupancy maintains around 33.8%
- Daily rates hold near $165
Low Season (June, August, October)
- Revenue drops to average $763 per month
- Occupancy decreases to average 28.6%
- Daily rates adjust to average $171
Seasonality Insights for Itapecerica da Serra
- The Airbnb seasonality in Itapecerica da Serra shows highly seasonal trends requiring careful strategy. While the sections above show seasonal averages, it's also insightful to look at the extremes:
- During the high season, the absolute peak month showcases Itapecerica da Serra's highest earning potential, with monthly revenues capable of climbing to $1,765, occupancy reaching a high of 40.2%, and ADRs peaking at $189.
- Conversely, the slowest single month of the year, typically falling within the low season, marks the market's lowest point. In this month, revenue might dip to $706, occupancy could drop to 25.0%, and ADRs may adjust down to $152.
- Understanding both the seasonal averages and these monthly peaks and troughs in revenue, occupancy, and ADR is crucial for maximizing your Airbnb profit potential in Itapecerica da Serra.
Seasonal Strategies for Maximizing Profit
- Peak Season: Maximize revenue through premium pricing and potentially longer minimum stays. Ensure high availability.
- Low Season: Offer competitive pricing, special promotions (e.g., extended stay discounts), and flexible cancellation policies. Target off-season travelers like remote workers or budget-conscious guests.
- Shoulder Seasons: Implement dynamic pricing that balances peak and low rates. Target weekend travelers or specific events. Offer slightly more flexible terms than peak season.
- Regularly analyze your own performance against these Itapecerica da Serra seasonality benchmarks and adjust your pricing and availability strategy accordingly.
Best Areas for Airbnb Investment in Itapecerica da Serra (2026)
Exploring the top neighborhoods for short-term rentals in Itapecerica da Serra? This section highlights key areas, outlining why they are attractive for hosts and guests, along with notable local attractions. Consider these locations based on your target guest profile and investment strategy.
| Neighborhood / Area | Why Host Here? (Target Guests & Appeal) | Key Attractions & Landmarks |
|---|---|---|
| Centro | The heart of Itapecerica da Serra, featuring historical sites, local commerce, and easy access to public transport. Ideal for travelers looking for convenience and culture. | Church of São Miguel Arcanjo, Itapecerica da Serra Municipal Market, Public parks, Local shops and restaurants |
| Parque Rizzo | A residential area known for its calm atmosphere and proximity to nature. This area is popular with families and those looking for a peaceful stay. | Parque da Represa, Natural parks, Outdoor activities, Family-friendly restaurants |
| Engenheiro Marsilac | A charming district that combines urban and rural lifestyles, offering a unique experience with access to green areas and trails. | Ecological parks, Walking and biking trails, Natural landscapes, Local restaurants offering regional cuisine |
| Jardim Paulista | A vibrant neighborhood with a mix of modern and traditional influences, featuring local shops and eateries that cater to diverse tastes. | Local shops, Coffee houses, Cultural events, Community parks |
| Vila Esperança | An up-and-coming neighborhood with a growing number of amenities and attractions, ideal for budget travelers looking for local experiences. | Street markets, Art galleries, Local eateries, Community parks |
| Canta Galo | A serene area known for its natural beauty, ideal for those looking for eco-tourism opportunities and tranquility close to the city. | Nature trails, Eco-tourism activities, Parks, Rural tourism options |
| São Miguel | A bustling area with a mix of local culture and amenities, attracting a diverse crowd looking for an urban experience with local flavor. | Local markets, Cultural festivals, Restaurants with traditional cuisine, Community activities |
| Recanto Verde | A picturesque neighborhood known for its quiet streets and green spaces, perfect for visitors seeking a relaxing getaway in nature. | Green parks, Nature walks, Relaxing cafes, Scenic viewpoints |
Understanding Airbnb License Requirements & STR Laws in Itapecerica da Serra (2026)
While Itapecerica da Serra, São Paulo, Brazil currently shows low STR regulations, specific Airbnb license requirements might still exist or change. Always verify the latest short term rental regulations and Airbnb license requirements directly with local government authorities for Itapecerica da Serra to ensure full compliance before hosting.
(Source: AirROI data, 2026, finding no licensed listings among those analyzed)
Top Performing Airbnb Properties in Itapecerica da Serra (2026)
Benchmark your potential! Explore examples of top-performing Airbnb properties in Itapecerica da Serrabased on Trailing Twelve Month (TTM) revenue. Analyze their characteristics, revenue, occupancy rate, and ADR to understand what drives success in this market.

Beautiful, Modern, Isolated Near SP
Entire Place • 8 bedrooms

Star Chalet - Hydro, Ofuro, Fireplace, Streaming
Entire Place • 1 bedroom
Chácara 40 min from SP 2000 meters
Entire Place • 4 bedrooms
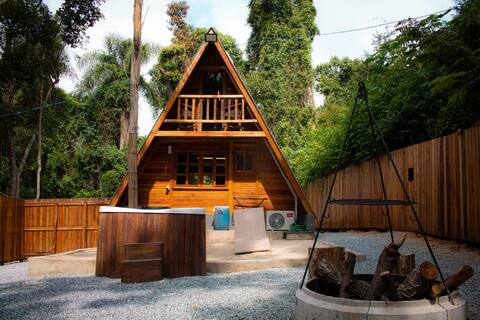
Sun Chalet - Hydro, Hot Tub, Fireplace, Streaming
Entire Place • 1 bedroom

Lua Chalet - Hydro, Ofuro, Fireplace, Streaming
Entire Place • 1 bedroom

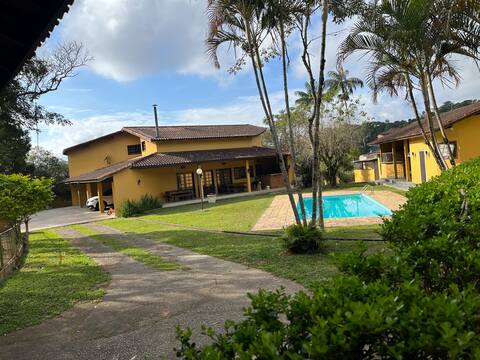
Farm in Itapecerica da Serra
Entire Place • 3 bedrooms
Note: Performance varies based on location, size, amenities, seasonality, and management quality. Data reflects the past 12 months.
Top Performing Airbnb Hosts in Itapecerica da Serra (2026)
Learn from the best! This table showcases top-performing Airbnb hosts in Itapecerica da Serra based on the number of properties managed and estimated total revenue over the past year. Analyze their scale and performance metrics.
| Host Name | Properties | Grossing Revenue | Stay Reviews | Avg Rating |
|---|---|---|---|---|
| Netinhos Sítio | 3 | $60,819 | 447 | 4.84/5.0 |
| Alexandre Tetsuo | 1 | $35,331 | 33 | 5.00/5.0 |
| Daniele | 3 | $28,733 | 293 | 4.94/5.0 |
| Mariana | 1 | $19,207 | 27 | 4.96/5.0 |
| Gabriel | 1 | $17,966 | 45 | 4.96/5.0 |
| Adrienne | 1 | $17,513 | 33 | 4.94/5.0 |
| Maria | 1 | $17,409 | 57 | 4.95/5.0 |
| Marina | 1 | $17,271 | 27 | 5.00/5.0 |
| Elis | 1 | $15,298 | 35 | 5.00/5.0 |
| Talita | 1 | $14,344 | 2 | Not Rated |
Analyzing the strategies of top hosts, such as their property selection, pricing, and guest communication, can offer valuable lessons for optimizing your own Airbnb operations in Itapecerica da Serra.
Dive Deeper: Advanced Itapecerica da Serra STR Market Data (2026)
Ready to unlock more insights? AirROI provides access to advanced metrics and comprehensive Airbnb data for Itapecerica da Serra. Explore detailed analytics beyond this report to refine your investment strategy, optimize pricing, and maximize your vacation rental profits.
Explore Advanced MetricsItapecerica da Serra Short-Term Rental Market Composition (2026): Property & Room Types
Room Type Distribution
Property Type Distribution
Market Composition Insights for Itapecerica da Serra
- The Itapecerica da Serra Airbnb market composition is heavily skewed towards Entire Home/Apt listings, which make up 94.1% of the 51 active rentals. This indicates strong guest preference for privacy and space.
- Looking at the property type distribution in Itapecerica da Serra, House properties are the most common (72.5%), reflecting the local real estate landscape.
- Houses represent a significant 72.5% portion, catering likely to families or larger groups.
- The presence of 13.7% Hotel/Boutique listings indicates integration with traditional hospitality.
- Smaller segments like others, apartment/condo (combined 4.0%) offer potential for unique stay experiences.
Itapecerica da Serra Airbnb Room Capacity Analysis (2026): Bedroom Distribution
Distribution of Listings by Number of Bedrooms
Room Capacity Insights for Itapecerica da Serra
- The dominant room capacity in Itapecerica da Serra is 1 bedroom listings, making up 27.5% of the market. This suggests a strong demand for properties suitable for couples or solo travelers.
- Together, 1 bedroom and 4 bedrooms properties represent 51.0% of the active Airbnb listings in Itapecerica da Serra, indicating a high concentration in these sizes.
- A significant 54.9% of listings offer 3+ bedrooms, catering to larger groups and families seeking more space in Itapecerica da Serra.
Itapecerica da Serra Vacation Rental Guest Capacity Trends (2026)
Distribution of Listings by Guest Capacity
Guest Capacity Insights for Itapecerica da Serra
- The most common guest capacity trend in Itapecerica da Serra vacation rentals is listings accommodating 8+ guests (62.7%). This suggests the primary traveler segment is likely larger groups.
- Properties designed for 8+ guests and 2 guests dominate the Itapecerica da Serra STR market, accounting for 86.2% of listings.
- 68.6% of properties accommodate 6+ guests, serving the market segment for larger families or group travel in Itapecerica da Serra.
- On average, properties in Itapecerica da Serra are equipped to host 6.0 guests.
Itapecerica da Serra Airbnb Booking Patterns (2026): Available vs. Booked Days
Available Days Distribution
Booked Days Distribution
Booking Pattern Insights for Itapecerica da Serra
- The most common availability pattern in Itapecerica da Serra falls within the 271-366 days range, representing 62.7% of listings. This suggests many properties have significant open periods on their calendars.
- Approximately 88.2% of listings show high availability (181+ days open annually), indicating potential for increased bookings or specific owner usage patterns.
- For booked days, the 1-30 days range is most frequent in Itapecerica da Serra (35.3%), reflecting common guest stay durations or potential owner blocking patterns.
- A notable 11.8% of properties secure long booking periods (181+ days booked per year), highlighting successful long-term rental strategies or significant owner usage.
Itapecerica da Serra Airbnb Minimum Stay Requirements Analysis
Distribution of Listings by Minimum Night Requirement
1 Night
25 listings
49% of total
2 Nights
12 listings
23.5% of total
3 Nights
2 listings
3.9% of total
7-29 Nights
1 listings
2% of total
30+ Nights
11 listings
21.6% of total
Key Insights
- The most prevalent minimum stay requirement in Itapecerica da Serra is 1 Night, adopted by 49% of listings. This highlights the market's preference for shorter, flexible bookings.
- A strong majority (72.5%) of the Itapecerica da Serra Airbnb data shows acceptance of very short stays (1-2 nights), indicating a dynamic, high-turnover market.
- A significant segment (21.6%) caters to monthly stays (30+ nights) in Itapecerica da Serra, pointing to opportunities in the extended-stay market.
Recommendations
- Align with the market by considering a 1 Night minimum stay, as 49% of Itapecerica da Serra hosts use this setting.
- Explore offering discounts for stays of 30+ nights to attract the 21.6% of the market seeking extended stays.
- Adjust minimum nights based on seasonality – potentially shorter during low season and longer during peak demand periods in Itapecerica da Serra.
Itapecerica da Serra Airbnb Cancellation Policy Trends Analysis (2026)
Limited
1 listings
2% of total
Flexible
12 listings
24% of total
Moderate
14 listings
28% of total
Firm
18 listings
36% of total
Strict
5 listings
10% of total
Cancellation Policy Insights for Itapecerica da Serra
- The prevailing Airbnb cancellation policy trend in Itapecerica da Serra is Firm, used by 36% of listings.
- There's a relatively balanced mix between guest-friendly (52.0%) and stricter (46.0%) policies, offering choices for different guest needs.
Recommendations for Hosts
- Consider adopting a Firm policy to align with the 36% market standard in Itapecerica da Serra.
- Using a Strict policy might deter some guests, as only 10% of listings use it. Evaluate if potential revenue protection outweighs possible lower booking rates.
- Regularly review your cancellation policy against competitors and market demand shifts in Itapecerica da Serra.
Itapecerica da Serra STR Booking Lead Time Analysis (2026)
Average Booking Lead Time by Month
Booking Lead Time Insights for Itapecerica da Serra
- The overall average booking lead time for vacation rentals in Itapecerica da Serra is 48 days.
- Guests book furthest in advance for stays during December (average 90 days), likely coinciding with peak travel demand or local events.
- The shortest booking windows occur for stays in March (average 28 days), indicating more last-minute travel plans during this time.
- Seasonally, Winter (59 days avg.) sees the longest lead times, while Spring (35 days avg.) has the shortest, reflecting typical travel planning cycles.
Recommendations for Hosts
- Use the overall average lead time (48 days) as a baseline for your pricing and availability strategy in Itapecerica da Serra.
- For December stays, consider implementing length-of-stay discounts or slightly higher rates for bookings made less than 90 days out to capitalize on advance planning.
- Target marketing efforts for the Winter season well in advance (at least 59 days) to capture early planners.
- Monitor your own booking lead times against these Itapecerica da Serra averages to identify opportunities for dynamic pricing adjustments.
Popular & Essential Airbnb Amenities in Itapecerica da Serra (2026)
Amenity Prevalence
Amenity Insights for Itapecerica da Serra
- Essential amenities in Itapecerica da Serra that guests expect include: Wifi. Lacking these (this) could significantly impact bookings.
- Popular amenities like TV, Free parking on premises, Kitchen are common but not universal. Offering these can provide a competitive edge.
- A pool is a highly desired but not standard amenity, making it a key feature for attracting guests seeking leisure in Itapecerica da Serra.
Recommendations for Hosts
- Ensure your listing includes all essential amenities for Itapecerica da Serra: Wifi.
- Prioritize adding missing essentials: Wifi.
- Consider adding popular differentiators like TV or Free parking on premises to increase appeal.
- Highlight unique or less common amenities you offer (e.g., hot tub, dedicated workspace, EV charger) in your listing description and photos.
- Regularly check competitor amenities in Itapecerica da Serra to stay competitive.
Itapecerica da Serra Airbnb Guest Demographics & Profile Analysis (2026)
Guest Profile Summary for Itapecerica da Serra
- The typical guest profile for Airbnb in Itapecerica da Serra consists of primarily domestic travelers (97%), often arriving from nearby São Paulo, typically belonging to the Post-2000s (Gen Z/Alpha) group (50%), primarily speaking Portuguese or English.
- Domestic travelers account for 97.2% of guests.
- Key international markets include Brazil (97.2%) and Australia (0.6%).
- Top languages spoken are Portuguese (54.6%) followed by English (27.7%).
- A significant demographic segment is the Post-2000s (Gen Z/Alpha) group, representing 50% of guests.
Recommendations for Hosts
- Target domestic marketing efforts towards travelers from São Paulo and Osasco.
- Tailor amenities and listing descriptions to appeal to the dominant Post-2000s (Gen Z/Alpha) demographic (e.g., highlight fast WiFi, smart home features, local guides).
- Highlight unique local experiences or amenities relevant to the primary guest profile.
- Consider seasonal promotions aligned with peak travel times for key origin markets.
Nearby Short-Term Rental Market Comparison
How does the Itapecerica da Serra Airbnb market stack up against its neighbors? Compare key performance metrics like average monthly revenue, ADR, and occupancy rates in surrounding areas to understand the broader regional STR landscape.
| Market | Active Properties | Monthly Revenue | Daily Rate | Avg. Occupancy |
|---|---|---|---|---|
| Riviera de São Lourenço | 10 | $2,868 | $213.78 | 46% |
| Tuiuti | 18 | $1,686 | $156.45 | 30% |
| Itupeva | 136 | $1,561 | $225.82 | 28% |
| Morungaba | 31 | $1,435 | $263.39 | 27% |
| Campo Limpo Paulista | 49 | $1,428 | $181.02 | 30% |
| Valinhos | 61 | $1,370 | $176.28 | 33% |
| Itatiba | 171 | $1,331 | $177.58 | 29% |
| Vargem | 48 | $1,319 | $190.42 | 28% |
| Elias Fausto | 13 | $1,296 | $143.78 | 30% |
| Porto Feliz | 69 | $1,279 | $260.86 | 27% |