Iperó Airbnb Market Analysis 2026: Short Term Rental Data & Vacation Rental Statistics in São Paulo, Brazil
Is Airbnb profitable in Iperó in 2026? Explore comprehensive Airbnb analytics for Iperó, São Paulo, Brazil to uncover income potential. This 2026 STR market report for Iperó, based on AirROI data from February 2025 to January 2026, reveals key trends in the niche market of 25 active listings.
Whether you're considering an Airbnb investment in Iperó, optimizing your existing vacation rental, or exploring rental arbitrage opportunities, understanding the Iperó Airbnb data is crucial. Leveraging the low regulation environment is key to maximizing your short term rental income potential. Let's dive into the specifics.
Key Iperó Airbnb Performance Metrics Overview
Monthly Airbnb Revenue Variations & Income Potential in Iperó (2026)
Understanding the monthly revenue variations for Airbnb listings in Iperó is key to maximizing your short term rental income potential. Seasonality significantly impacts earnings. Our analysis, based on data from the past 12 months, shows that the peak revenue month for STRs in Iperó is typically December, while September often presents the lowest earnings, highlighting opportunities for strategic pricing adjustments during shoulder and low seasons. Explore the typical Airbnb income in Iperó across different performance tiers:
- Best-in-class properties (Top 10%) achieve $3,525+ monthly, often utilizing dynamic pricing and superior guest experiences.
- Strong performing properties (Top 25%) earn $983 or more, indicating effective management and desirable locations/amenities.
- Typical properties (Median) generate around $538 per month, representing the average market performance.
- Entry-level properties (Bottom 25%) see earnings around $341, often with potential for optimization.
Average Monthly Airbnb Earnings Trend in Iperó
Iperó Airbnb Occupancy Rate Trends (2026)
Maximize your bookings by understanding the Iperó STR occupancy trends. Seasonal demand shifts significantly influence how often properties are booked. Typically, Marchsees the highest demand (peak season occupancy), while September experiences the lowest (low season). Effective strategies, like adjusting minimum stays or offering promotions, can boost occupancy during slower periods. Here's how different property tiers perform in Iperó:
- Best-in-class properties (Top 10%) achieve 50%+ occupancy, indicating high desirability and potentially optimized availability.
- Strong performing properties (Top 25%) maintain 27% or higher occupancy, suggesting good market fit and guest satisfaction.
- Typical properties (Median) have an occupancy rate around 14%.
- Entry-level properties (Bottom 25%) average 9% occupancy, potentially facing higher vacancy.
Average Monthly Occupancy Rate Trend in Iperó
Average Daily Rate (ADR) Airbnb Trends in Iperó (2026)
Effective short term rental pricing strategy in Iperó involves understanding monthly ADR fluctuations. The Average Daily Rate (ADR) for Airbnb in Iperó typically peaks in December and dips lowest during February. Leveraging Airbnb dynamic pricing tools or strategies based on this seasonality can significantly boost revenue. Here's a look at the typical nightly rates achieved:
- Best-in-class properties (Top 10%) command rates of $303+ per night, often due to premium features or locations.
- Strong performing properties (Top 25%) achieve nightly rates of $178 or more.
- Typical properties (Median) charge around $133 per night.
- Entry-level properties (Bottom 25%) earn around $101 per night.
Average Daily Rate (ADR) Trend by Month in Iperó
Get Live Iperó Market Intelligence 👇

Explore Real-time Analytics
Airbnb Seasonality Analysis & Trends in Iperó (2026)
Peak Season (December, November, March)
- Revenue averages $1,715 per month
- Occupancy rates average 27.9%
- Daily rates average $162
Shoulder Season
- Revenue averages $1,058 per month
- Occupancy maintains around 19.3%
- Daily rates hold near $158
Low Season (May, June, September)
- Revenue drops to average $514 per month
- Occupancy decreases to average 14.6%
- Daily rates adjust to average $155
Seasonality Insights for Iperó
- The Airbnb seasonality in Iperó shows highly seasonal trends requiring careful strategy. While the sections above show seasonal averages, it's also insightful to look at the extremes:
- During the high season, the absolute peak month showcases Iperó's highest earning potential, with monthly revenues capable of climbing to $1,840, occupancy reaching a high of 31.7%, and ADRs peaking at $172.
- Conversely, the slowest single month of the year, typically falling within the low season, marks the market's lowest point. In this month, revenue might dip to $292, occupancy could drop to 7.8%, and ADRs may adjust down to $148.
- Understanding both the seasonal averages and these monthly peaks and troughs in revenue, occupancy, and ADR is crucial for maximizing your Airbnb profit potential in Iperó.
Seasonal Strategies for Maximizing Profit
- Peak Season: Maximize revenue through premium pricing and potentially longer minimum stays. Ensure high availability.
- Low Season: Offer competitive pricing, special promotions (e.g., extended stay discounts), and flexible cancellation policies. Target off-season travelers like remote workers or budget-conscious guests.
- Shoulder Seasons: Implement dynamic pricing that balances peak and low rates. Target weekend travelers or specific events. Offer slightly more flexible terms than peak season.
- Regularly analyze your own performance against these Iperó seasonality benchmarks and adjust your pricing and availability strategy accordingly.
Best Areas for Airbnb Investment in Iperó (2026)
Exploring the top neighborhoods for short-term rentals in Iperó? This section highlights key areas, outlining why they are attractive for hosts and guests, along with notable local attractions. Consider these locations based on your target guest profile and investment strategy.
| Neighborhood / Area | Why Host Here? (Target Guests & Appeal) | Key Attractions & Landmarks |
|---|---|---|
| Iperó Centro | The heart of Iperó with easy access to local shops, restaurants, and markets. Ideal for guests wanting to experience local culture and convenience. | Iperó Municipal Market, Iperó Heritage Museum, Plaza da Matriz, Iperó Church |
| Capela do Alto | A serene location near nature and outdoor activities. Attracts visitors looking for a peaceful getaway with opportunities for hiking and relaxation. | Cachoeira do Salto, Parque Municipal, Lago do Capela |
| Iperó Rural Area | Perfect for those seeking a taste of rural life in Brazil with beautiful landscapes and local farms, great for families and nature lovers. | Local farms, Hiking trails, Nature reserves |
| Areia Branca | A charming district known for its scenic views and close-knit community. Offers a unique experience for visitors looking for tranquility. | Pico do Itapeva, Scenic viewpoints, Charming countryside |
| Caxambu | A small but accessible area near Iperó, popular for those looking to escape the city and enjoy nature. | Caxambu State Park, Nature trails, Local dining options |
| Piedade | Known for adventure tourism, including waterfalls and hiking trails. Attracts thrill-seekers and nature enthusiasts. | Cascata do Piedade, Piedade Tourist Complex, Adventure sports activities |
| Sorocaba | A nearby city with a larger urban experience and more attractions. Good for guests wanting to explore nearby city life and entertainment. | Sorocaba Historical Center, Shopping Cidade Sorocaba, Parque Zoológico de Sorocaba |
| Votorantim | Adjacent to Iperó and offers attractions suitable for families and recreational activities. A good alternative for guests looking for variety. | Votorantim Municipal Park, Arena Votorantim, Shopping Votorantim |
Understanding Airbnb License Requirements & STR Laws in Iperó (2026)
While Iperó, São Paulo, Brazil currently shows low STR regulations, specific Airbnb license requirements might still exist or change. Always verify the latest short term rental regulations and Airbnb license requirements directly with local government authorities for Iperó to ensure full compliance before hosting.
(Source: AirROI data, 2026, finding no licensed listings among those analyzed)
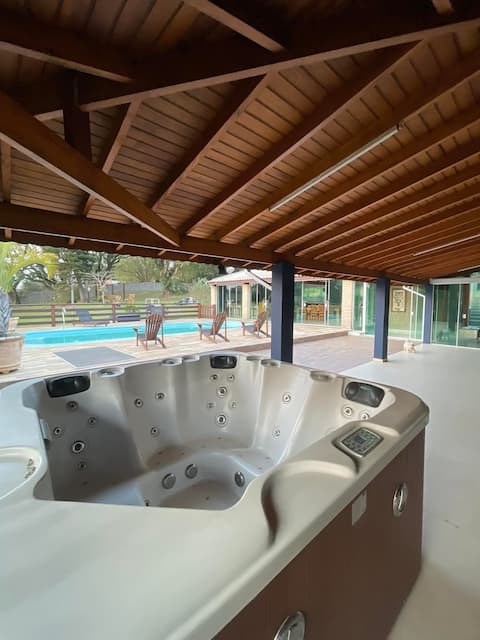
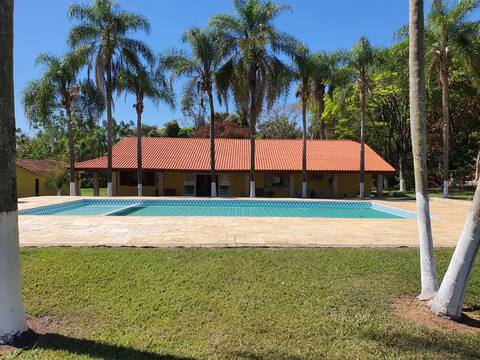
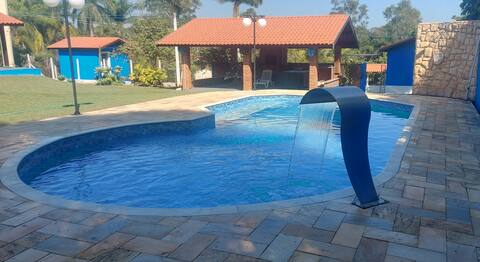
Top Performing Airbnb Properties in Iperó (2026)
Benchmark your potential! Explore examples of top-performing Airbnb properties in Iperóbased on Trailing Twelve Month (TTM) revenue. Analyze their characteristics, revenue, occupancy rate, and ADR to understand what drives success in this market.

Chácara IPERÓ.
Entire Place • 5 bedrooms
Farm in the countryside of SP (KM116 Castelo)
Entire Place • 4 bedrooms
Sítio Iperó
Entire Place • 5 bedrooms

Family Corner
Entire Place • 5 bedrooms

Chácara in Araçoiabinha/Iperó.
Entire Place • 12 bedrooms
Farmhouse with Pool in Iperó (Boituva)/SP
Entire Place • 2 bedrooms
Note: Performance varies based on location, size, amenities, seasonality, and management quality. Data reflects the past 12 months.
Top Performing Airbnb Hosts in Iperó (2026)
Learn from the best! This table showcases top-performing Airbnb hosts in Iperó based on the number of properties managed and estimated total revenue over the past year. Analyze their scale and performance metrics.
| Host Name | Properties | Grossing Revenue | Stay Reviews | Avg Rating |
|---|---|---|---|---|
| Adriano De Sousa | 1 | $67,479 | 53 | 5.00/5.0 |
| Cristiane Oliveira | 2 | $15,121 | 93 | 4.47/5.0 |
| Henrique | 1 | $12,484 | 22 | 4.86/5.0 |
| Maria Cristina | 1 | $11,001 | 1 | Not Rated |
| Eduardo | 1 | $9,368 | 65 | 4.54/5.0 |
| Renato | 1 | $7,987 | 16 | 5.00/5.0 |
| Michele | 1 | $6,049 | 27 | 4.52/5.0 |
| Leticia | 1 | $5,825 | 7 | 5.00/5.0 |
| Patricia | 1 | $4,661 | 2 | Not Rated |
| Diogo | 1 | $4,593 | 4 | 4.50/5.0 |
Analyzing the strategies of top hosts, such as their property selection, pricing, and guest communication, can offer valuable lessons for optimizing your own Airbnb operations in Iperó.
Dive Deeper: Advanced Iperó STR Market Data (2026)
Ready to unlock more insights? AirROI provides access to advanced metrics and comprehensive Airbnb data for Iperó. Explore detailed analytics beyond this report to refine your investment strategy, optimize pricing, and maximize your vacation rental profits.
Explore Advanced MetricsIperó Short-Term Rental Market Composition (2026): Property & Room Types
Room Type Distribution
Property Type Distribution
Market Composition Insights for Iperó
- The Iperó Airbnb market composition is heavily skewed towards Entire Home/Apt listings, which make up 96% of the 25 active rentals. This indicates strong guest preference for privacy and space.
- Looking at the property type distribution in Iperó, House properties are the most common (96%), reflecting the local real estate landscape.
- Houses represent a significant 96% portion, catering likely to families or larger groups.
- Smaller segments like outdoor/unique (combined 4.0%) offer potential for unique stay experiences.
Iperó Airbnb Room Capacity Analysis (2026): Bedroom Distribution
Distribution of Listings by Number of Bedrooms
Room Capacity Insights for Iperó
- The dominant room capacity in Iperó is 3 bedrooms listings, making up 48% of the market. This suggests a strong demand for properties suitable for families or small groups.
- Together, 3 bedrooms and 5+ bedrooms properties represent 68.0% of the active Airbnb listings in Iperó, indicating a high concentration in these sizes.
- A significant 84.0% of listings offer 3+ bedrooms, catering to larger groups and families seeking more space in Iperó.
Iperó Vacation Rental Guest Capacity Trends (2026)
Distribution of Listings by Guest Capacity
Guest Capacity Insights for Iperó
- The most common guest capacity trend in Iperó vacation rentals is listings accommodating 8+ guests (96%). This suggests the primary traveler segment is likely larger groups.
- 96.0% of properties accommodate 6+ guests, serving the market segment for larger families or group travel in Iperó.
- On average, properties in Iperó are equipped to host 7.7 guests.
Iperó Airbnb Booking Patterns (2026): Available vs. Booked Days
Available Days Distribution
Booked Days Distribution
Booking Pattern Insights for Iperó
- The most common availability pattern in Iperó falls within the 271-366 days range, representing 92% of listings. This suggests many properties have significant open periods on their calendars.
- Approximately 100.0% of listings show high availability (181+ days open annually), indicating potential for increased bookings or specific owner usage patterns.
- For booked days, the 1-30 days range is most frequent in Iperó (56%), reflecting common guest stay durations or potential owner blocking patterns.
Iperó Airbnb Minimum Stay Requirements Analysis
Distribution of Listings by Minimum Night Requirement
1 Night
9 listings
36% of total
2 Nights
13 listings
52% of total
30+ Nights
3 listings
12% of total
Key Insights
- The most prevalent minimum stay requirement in Iperó is 2 Nights, adopted by 52% of listings. This highlights the market's preference for shorter, flexible bookings.
- A strong majority (88.0%) of the Iperó Airbnb data shows acceptance of very short stays (1-2 nights), indicating a dynamic, high-turnover market.
- A significant segment (12%) caters to monthly stays (30+ nights) in Iperó, pointing to opportunities in the extended-stay market.
Recommendations
- Align with the market by considering a 2 Nights minimum stay, as 52% of Iperó hosts use this setting.
- Explore offering discounts for stays of 30+ nights to attract the 12% of the market seeking extended stays.
- Adjust minimum nights based on seasonality – potentially shorter during low season and longer during peak demand periods in Iperó.
Iperó Airbnb Cancellation Policy Trends Analysis (2026)
Flexible
7 listings
30.4% of total
Moderate
6 listings
26.1% of total
Firm
9 listings
39.1% of total
Strict
1 listings
4.3% of total
Cancellation Policy Insights for Iperó
- The prevailing Airbnb cancellation policy trend in Iperó is Firm, used by 39.1% of listings.
- There's a relatively balanced mix between guest-friendly (56.5%) and stricter (43.4%) policies, offering choices for different guest needs.
- Strict cancellation policies are quite rare (4.3%), potentially making listings with this policy less competitive unless justified by high demand or property type.
Recommendations for Hosts
- Consider adopting a Firm policy to align with the 39.1% market standard in Iperó.
- Using a Strict policy might deter some guests, as only 4.3% of listings use it. Evaluate if potential revenue protection outweighs possible lower booking rates.
- Regularly review your cancellation policy against competitors and market demand shifts in Iperó.
Iperó STR Booking Lead Time Analysis (2026)
Average Booking Lead Time by Month
Booking Lead Time Insights for Iperó
- The overall average booking lead time for vacation rentals in Iperó is 45 days.
- Guests book furthest in advance for stays during December (average 101 days), likely coinciding with peak travel demand or local events.
- The shortest booking windows occur for stays in September (average 8 days), indicating more last-minute travel plans during this time.
- Seasonally, Winter (77 days avg.) sees the longest lead times, while Spring (24 days avg.) has the shortest, reflecting typical travel planning cycles.
Recommendations for Hosts
- Use the overall average lead time (45 days) as a baseline for your pricing and availability strategy in Iperó.
- For December stays, consider implementing length-of-stay discounts or slightly higher rates for bookings made less than 101 days out to capitalize on advance planning.
- During September, focus on last-minute booking availability and promotions, as guests book with very short notice (8 days avg.).
- Target marketing efforts for the Winter season well in advance (at least 77 days) to capture early planners.
- Monitor your own booking lead times against these Iperó averages to identify opportunities for dynamic pricing adjustments.
Popular & Essential Airbnb Amenities in Iperó (2026)
Amenity Prevalence
Amenity Insights for Iperó
- Essential amenities in Iperó that guests expect include: Kitchen, TV, Free parking on premises, Pool. Lacking these (any) could significantly impact bookings.
- Popular amenities like Wifi, BBQ grill, Refrigerator are common but not universal. Offering these can provide a competitive edge.
- Warning: Wifi is not universally provided but is considered essential globally. Ensure reliable Wifi is offered.
Recommendations for Hosts
- Ensure your listing includes all essential amenities for Iperó: Kitchen, TV, Free parking on premises, Pool.
- Prioritize adding missing essentials: Pool.
- Consider adding popular differentiators like Wifi or BBQ grill to increase appeal.
- Highlight unique or less common amenities you offer (e.g., hot tub, dedicated workspace, EV charger) in your listing description and photos.
- Regularly check competitor amenities in Iperó to stay competitive.
Iperó Airbnb Guest Demographics & Profile Analysis (2026)
Guest Profile Summary for Iperó
- The typical guest profile for Airbnb in Iperó consists of primarily domestic travelers (100%), often arriving from nearby São Paulo, typically belonging to the Post-2000s (Gen Z/Alpha) group (50%), primarily speaking Portuguese or English.
- Domestic travelers account for 100.0% of guests.
- Top languages spoken are Portuguese (66.7%) followed by English (16.7%).
- A significant demographic segment is the Post-2000s (Gen Z/Alpha) group, representing 50% of guests.
Recommendations for Hosts
- Target domestic marketing efforts towards travelers from São Paulo and Osasco.
- Tailor amenities and listing descriptions to appeal to the dominant Post-2000s (Gen Z/Alpha) demographic (e.g., highlight fast WiFi, smart home features, local guides).
- Highlight unique local experiences or amenities relevant to the primary guest profile.
- Consider seasonal promotions aligned with peak travel times for key origin markets.
Nearby Short-Term Rental Market Comparison
How does the Iperó Airbnb market stack up against its neighbors? Compare key performance metrics like average monthly revenue, ADR, and occupancy rates in surrounding areas to understand the broader regional STR landscape.
| Market | Active Properties | Monthly Revenue | Daily Rate | Avg. Occupancy |
|---|---|---|---|---|
| Riviera de São Lourenço | 10 | $2,868 | $213.78 | 46% |
| Tuiuti | 18 | $1,686 | $156.45 | 30% |
| Itupeva | 136 | $1,561 | $225.82 | 28% |
| Morungaba | 31 | $1,435 | $263.39 | 27% |
| Campo Limpo Paulista | 49 | $1,428 | $181.02 | 30% |
| Valinhos | 61 | $1,370 | $176.28 | 33% |
| Itatiba | 171 | $1,331 | $177.58 | 29% |
| Vargem | 48 | $1,319 | $190.42 | 28% |
| Elias Fausto | 13 | $1,296 | $143.78 | 30% |
| Porto Feliz | 69 | $1,279 | $260.86 | 27% |