Guararema Airbnb Market Analysis 2026: Short Term Rental Data & Vacation Rental Statistics in São Paulo, Brazil
Is Airbnb profitable in Guararema in 2026? Explore comprehensive Airbnb analytics for Guararema, São Paulo, Brazil to uncover income potential. This 2026 STR market report for Guararema, based on AirROI data from February 2025 to January 2026, reveals key trends in the niche market of 171 active listings.
Whether you're considering an Airbnb investment in Guararema, optimizing your existing vacation rental, or exploring rental arbitrage opportunities, understanding the Guararema Airbnb data is crucial. Leveraging the low regulation environment is key to maximizing your short term rental income potential. Let's dive into the specifics.
Key Guararema Airbnb Performance Metrics Overview
Monthly Airbnb Revenue Variations & Income Potential in Guararema (2026)
Understanding the monthly revenue variations for Airbnb listings in Guararema is key to maximizing your short term rental income potential. Seasonality significantly impacts earnings. Our analysis, based on data from the past 12 months, shows that the peak revenue month for STRs in Guararema is typically December, while August often presents the lowest earnings, highlighting opportunities for strategic pricing adjustments during shoulder and low seasons. Explore the typical Airbnb income in Guararema across different performance tiers:
- Best-in-class properties (Top 10%) achieve $3,096+ monthly, often utilizing dynamic pricing and superior guest experiences.
- Strong performing properties (Top 25%) earn $1,788 or more, indicating effective management and desirable locations/amenities.
- Typical properties (Median) generate around $848 per month, representing the average market performance.
- Entry-level properties (Bottom 25%) see earnings around $369, often with potential for optimization.
Average Monthly Airbnb Earnings Trend in Guararema
Guararema Airbnb Occupancy Rate Trends (2026)
Maximize your bookings by understanding the Guararema STR occupancy trends. Seasonal demand shifts significantly influence how often properties are booked. Typically, Decembersees the highest demand (peak season occupancy), while September experiences the lowest (low season). Effective strategies, like adjusting minimum stays or offering promotions, can boost occupancy during slower periods. Here's how different property tiers perform in Guararema:
- Best-in-class properties (Top 10%) achieve 59%+ occupancy, indicating high desirability and potentially optimized availability.
- Strong performing properties (Top 25%) maintain 38% or higher occupancy, suggesting good market fit and guest satisfaction.
- Typical properties (Median) have an occupancy rate around 23%.
- Entry-level properties (Bottom 25%) average 11% occupancy, potentially facing higher vacancy.
Average Monthly Occupancy Rate Trend in Guararema
Average Daily Rate (ADR) Airbnb Trends in Guararema (2026)
Effective short term rental pricing strategy in Guararema involves understanding monthly ADR fluctuations. The Average Daily Rate (ADR) for Airbnb in Guararema typically peaks in December and dips lowest during April. Leveraging Airbnb dynamic pricing tools or strategies based on this seasonality can significantly boost revenue. Here's a look at the typical nightly rates achieved:
- Best-in-class properties (Top 10%) command rates of $272+ per night, often due to premium features or locations.
- Strong performing properties (Top 25%) achieve nightly rates of $197 or more.
- Typical properties (Median) charge around $144 per night.
- Entry-level properties (Bottom 25%) earn around $89 per night.
Average Daily Rate (ADR) Trend by Month in Guararema
Get Live Guararema Market Intelligence 👇

Explore Real-time Analytics
Airbnb Seasonality Analysis & Trends in Guararema (2026)
Peak Season (December, November, March)
- Revenue averages $1,728 per month
- Occupancy rates average 32.6%
- Daily rates average $162
Shoulder Season
- Revenue averages $1,290 per month
- Occupancy maintains around 27.4%
- Daily rates hold near $155
Low Season (May, June, August)
- Revenue drops to average $994 per month
- Occupancy decreases to average 23.9%
- Daily rates adjust to average $151
Seasonality Insights for Guararema
- The Airbnb seasonality in Guararema shows highly seasonal trends requiring careful strategy. While the sections above show seasonal averages, it's also insightful to look at the extremes:
- During the high season, the absolute peak month showcases Guararema's highest earning potential, with monthly revenues capable of climbing to $2,102, occupancy reaching a high of 35.3%, and ADRs peaking at $177.
- Conversely, the slowest single month of the year, typically falling within the low season, marks the market's lowest point. In this month, revenue might dip to $974, occupancy could drop to 22.0%, and ADRs may adjust down to $145.
- Understanding both the seasonal averages and these monthly peaks and troughs in revenue, occupancy, and ADR is crucial for maximizing your Airbnb profit potential in Guararema.
Seasonal Strategies for Maximizing Profit
- Peak Season: Maximize revenue through premium pricing and potentially longer minimum stays. Ensure high availability.
- Low Season: Offer competitive pricing, special promotions (e.g., extended stay discounts), and flexible cancellation policies. Target off-season travelers like remote workers or budget-conscious guests.
- Shoulder Seasons: Implement dynamic pricing that balances peak and low rates. Target weekend travelers or specific events. Offer slightly more flexible terms than peak season.
- Regularly analyze your own performance against these Guararema seasonality benchmarks and adjust your pricing and availability strategy accordingly.
Best Areas for Airbnb Investment in Guararema (2026)
Exploring the top neighborhoods for short-term rentals in Guararema? This section highlights key areas, outlining why they are attractive for hosts and guests, along with notable local attractions. Consider these locations based on your target guest profile and investment strategy.
| Neighborhood / Area | Why Host Here? (Target Guests & Appeal) | Key Attractions & Landmarks |
|---|---|---|
| Centro de Guararema | The heart of Guararema, where visitors can experience local culture, shops, and dining options. It's a great area for those looking to immerse themselves in the charm of the town. | Guararema River, Matriz de Nossa Senhora da Conceição Church, Centro Histórico, Parque Municipal da Pedra Montada, local artisan shops |
| Parque Municipal da Pedra Montada | A beautiful natural park that attracts nature lovers and families looking for outdoor activities. This area is perfect for those wanting peace and tranquility near nature. | Pedra Montada, hiking trails, picnic areas, local wildlife, scenic viewpoints |
| Bairro Pousada | A popular area for tourists seeking accommodations, featuring pousadas and boutique hotels with picturesque views and easy access to attractions. | local pousadas, scenic views of nature, close to hiking trails, cafes and small restaurants, community events |
| Cachoeira dos Rodrigues | This beautiful waterfall is a popular spot for visitors seeking adventure and nature experiences. A great place for outdoor activities, such as swimming and picnicking. | Cachoeira dos Rodrigues, waterfall views, nature trails, swimming areas, family picnic spots |
| Bairro Vista Alegre | A charming neighborhood that offers a mix of residential and recreational spaces, appealing to visitors looking for a quieter stay with easy access to the town's attractions. | views of the Guararema River, local parks, friendly community atmosphere, cafes, proximity to centro |
| Estação Guararema | The historic train station area that offers cultural experiences and access to regional train services, attracting history buffs and tourists. | historic train station, train rides to neighboring towns, cultural workshops, local market, town events |
| Jardim Silveira | A residential area known for its family-friendly environment and proximity to nature, making it suitable for longer-term stays. | parks and playgrounds, community events, nature activities, local markets, quiet streets |
| Igreja de São Benedito | An essential landmark in Guararema attracting visitors interested in local history, architecture, and community life. | Igreja de São Benedito, local festivals, architectural tours, cultural heritage, community gatherings |
Understanding Airbnb License Requirements & STR Laws in Guararema (2026)
While Guararema, São Paulo, Brazil currently shows low STR regulations, specific Airbnb license requirements might still exist or change. Always verify the latest short term rental regulations and Airbnb license requirements directly with local government authorities for Guararema to ensure full compliance before hosting.
(Source: AirROI data, 2026, finding no licensed listings among those analyzed)
Top Performing Airbnb Properties in Guararema (2026)
Benchmark your potential! Explore examples of top-performing Airbnb properties in Guararemabased on Trailing Twelve Month (TTM) revenue. Analyze their characteristics, revenue, occupancy rate, and ADR to understand what drives success in this market.
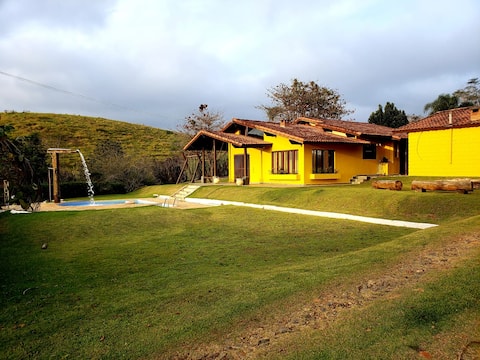
Farm for Rent with great accommodations
Entire Place • 11 bedrooms

Quinta do Itaoca - Guararema
Entire Place • 6 bedrooms

Refuge in the heart of Guararema "Landim Refuges"
Entire Place • 10 bedrooms

“Casa Roma” Farmhouse in Guararema
Entire Place • 4 bedrooms

Itaoca Forest - Riverfront, Lake, Native Forest
Entire Place • 5 bedrooms
Farm (Grandpa's place) + Poly sand court
Entire Place • 3 bedrooms
Note: Performance varies based on location, size, amenities, seasonality, and management quality. Data reflects the past 12 months.
Top Performing Airbnb Hosts in Guararema (2026)
Learn from the best! This table showcases top-performing Airbnb hosts in Guararema based on the number of properties managed and estimated total revenue over the past year. Analyze their scale and performance metrics.
| Host Name | Properties | Grossing Revenue | Stay Reviews | Avg Rating |
|---|---|---|---|---|
| Liziane Eymael | 3 | $89,145 | 185 | 4.97/5.0 |
| Paula | 1 | $66,346 | 42 | 4.88/5.0 |
| Marcinho | 1 | $57,993 | 121 | 4.98/5.0 |
| Odilon | 1 | $55,623 | 23 | 4.78/5.0 |
| Carla Sepulveda | 1 | $54,824 | 49 | 5.00/5.0 |
| Luís Henrique Do Amaral Vinha | 2 | $51,278 | 123 | 4.97/5.0 |
| Jaqueline Gentis | 3 | $45,039 | 196 | 4.94/5.0 |
| Hian | 1 | $40,781 | 12 | 5.00/5.0 |
| Fabiany Campos | 1 | $34,618 | 44 | 5.00/5.0 |
| Laisa | 1 | $34,392 | 78 | 4.99/5.0 |
Analyzing the strategies of top hosts, such as their property selection, pricing, and guest communication, can offer valuable lessons for optimizing your own Airbnb operations in Guararema.
Dive Deeper: Advanced Guararema STR Market Data (2026)
Ready to unlock more insights? AirROI provides access to advanced metrics and comprehensive Airbnb data for Guararema. Explore detailed analytics beyond this report to refine your investment strategy, optimize pricing, and maximize your vacation rental profits.
Explore Advanced MetricsGuararema Short-Term Rental Market Composition (2026): Property & Room Types
Room Type Distribution
Property Type Distribution
Market Composition Insights for Guararema
- The Guararema Airbnb market composition is heavily skewed towards Entire Home/Apt listings, which make up 93.6% of the 171 active rentals. This indicates strong guest preference for privacy and space.
- Looking at the property type distribution in Guararema, House properties are the most common (82.5%), reflecting the local real estate landscape.
- Houses represent a significant 82.5% portion, catering likely to families or larger groups.
- The presence of 5.8% Hotel/Boutique listings indicates integration with traditional hospitality.
- Smaller segments like unique stays, others (combined 1.8%) offer potential for unique stay experiences.
Guararema Airbnb Room Capacity Analysis (2026): Bedroom Distribution
Distribution of Listings by Number of Bedrooms
Room Capacity Insights for Guararema
- The dominant room capacity in Guararema is 3 bedrooms listings, making up 34.5% of the market. This suggests a strong demand for properties suitable for families or small groups.
- Together, 3 bedrooms and 5+ bedrooms properties represent 54.4% of the active Airbnb listings in Guararema, indicating a high concentration in these sizes.
- A significant 69.0% of listings offer 3+ bedrooms, catering to larger groups and families seeking more space in Guararema.
Guararema Vacation Rental Guest Capacity Trends (2026)
Distribution of Listings by Guest Capacity
Guest Capacity Insights for Guararema
- The most common guest capacity trend in Guararema vacation rentals is listings accommodating 8+ guests (73.7%). This suggests the primary traveler segment is likely larger groups.
- Properties designed for 8+ guests and 2 guests dominate the Guararema STR market, accounting for 80.1% of listings.
- 80.2% of properties accommodate 6+ guests, serving the market segment for larger families or group travel in Guararema.
- On average, properties in Guararema are equipped to host 6.7 guests.
Guararema Airbnb Booking Patterns (2026): Available vs. Booked Days
Available Days Distribution
Booked Days Distribution
Booking Pattern Insights for Guararema
- The most common availability pattern in Guararema falls within the 271-366 days range, representing 70.8% of listings. This suggests many properties have significant open periods on their calendars.
- Approximately 93.6% of listings show high availability (181+ days open annually), indicating potential for increased bookings or specific owner usage patterns.
- For booked days, the 31-90 days range is most frequent in Guararema (36.3%), reflecting common guest stay durations or potential owner blocking patterns.
- A notable 7.0% of properties secure long booking periods (181+ days booked per year), highlighting successful long-term rental strategies or significant owner usage.
Guararema Airbnb Minimum Stay Requirements Analysis
Distribution of Listings by Minimum Night Requirement
1 Night
48 listings
28.1% of total
2 Nights
77 listings
45% of total
3 Nights
4 listings
2.3% of total
30+ Nights
42 listings
24.6% of total
Key Insights
- The most prevalent minimum stay requirement in Guararema is 2 Nights, adopted by 45% of listings. This highlights the market's preference for shorter, flexible bookings.
- A strong majority (73.1%) of the Guararema Airbnb data shows acceptance of very short stays (1-2 nights), indicating a dynamic, high-turnover market.
- A significant segment (24.6%) caters to monthly stays (30+ nights) in Guararema, pointing to opportunities in the extended-stay market.
Recommendations
- Align with the market by considering a 2 Nights minimum stay, as 45% of Guararema hosts use this setting.
- If feasible, allowing 1-night stays, especially midweek or during low season, could capture last-minute bookings, as only 28.1% currently do.
- Explore offering discounts for stays of 30+ nights to attract the 24.6% of the market seeking extended stays.
- Adjust minimum nights based on seasonality – potentially shorter during low season and longer during peak demand periods in Guararema.
Guararema Airbnb Cancellation Policy Trends Analysis (2026)
Limited
6 listings
3.5% of total
Flexible
33 listings
19.3% of total
Moderate
33 listings
19.3% of total
Firm
87 listings
50.9% of total
Strict
12 listings
7% of total
Cancellation Policy Insights for Guararema
- The prevailing Airbnb cancellation policy trend in Guararema is Firm, used by 50.9% of listings.
- A majority (57.9%) of hosts in Guararema utilize Firm or Strict policies, indicating a market where hosts prioritize booking security.
- Strict cancellation policies are quite rare (7%), potentially making listings with this policy less competitive unless justified by high demand or property type.
Recommendations for Hosts
- Consider adopting a Firm policy to align with the 50.9% market standard in Guararema.
- Using a Strict policy might deter some guests, as only 7% of listings use it. Evaluate if potential revenue protection outweighs possible lower booking rates.
- Regularly review your cancellation policy against competitors and market demand shifts in Guararema.
Guararema STR Booking Lead Time Analysis (2026)
Average Booking Lead Time by Month
Booking Lead Time Insights for Guararema
- The overall average booking lead time for vacation rentals in Guararema is 42 days.
- Guests book furthest in advance for stays during December (average 76 days), likely coinciding with peak travel demand or local events.
- The shortest booking windows occur for stays in July (average 20 days), indicating more last-minute travel plans during this time.
- Seasonally, Winter (48 days avg.) sees the longest lead times, while Summer (21 days avg.) has the shortest, reflecting typical travel planning cycles.
Recommendations for Hosts
- Use the overall average lead time (42 days) as a baseline for your pricing and availability strategy in Guararema.
- For December stays, consider implementing length-of-stay discounts or slightly higher rates for bookings made less than 76 days out to capitalize on advance planning.
- Target marketing efforts for the Winter season well in advance (at least 48 days) to capture early planners.
- Monitor your own booking lead times against these Guararema averages to identify opportunities for dynamic pricing adjustments.
Popular & Essential Airbnb Amenities in Guararema (2026)
Amenity Prevalence
Amenity Insights for Guararema
- Essential amenities in Guararema that guests expect include: Free parking on premises, Kitchen. Lacking these (any) could significantly impact bookings.
- Popular amenities like TV, Wifi, BBQ grill are common but not universal. Offering these can provide a competitive edge.
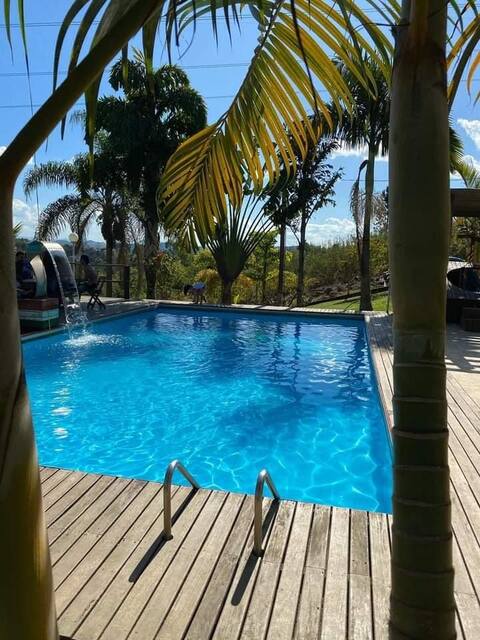
- A pool is a highly desired but not standard amenity, making it a key feature for attracting guests seeking leisure in Guararema.
- Warning: Wifi is not universally provided but is considered essential globally. Ensure reliable Wifi is offered.
Recommendations for Hosts
- Ensure your listing includes all essential amenities for Guararema: Free parking on premises, Kitchen.
- Prioritize adding missing essentials: Free parking on premises, Kitchen.
- Consider adding popular differentiators like TV or Wifi to increase appeal.
- Highlight unique or less common amenities you offer (e.g., hot tub, dedicated workspace, EV charger) in your listing description and photos.
- Regularly check competitor amenities in Guararema to stay competitive.
Guararema Airbnb Guest Demographics & Profile Analysis (2026)
Guest Profile Summary for Guararema
- The typical guest profile for Airbnb in Guararema consists of primarily domestic travelers (96%), often arriving from nearby São Paulo, typically belonging to the Post-2000s (Gen Z/Alpha) group (50%), primarily speaking Portuguese or English.
- Domestic travelers account for 95.9% of guests.
- Key international markets include Brazil (95.9%) and United States (1.6%).
- Top languages spoken are Portuguese (49.1%) followed by English (29.2%).
- A significant demographic segment is the Post-2000s (Gen Z/Alpha) group, representing 50% of guests.
Recommendations for Hosts
- Target domestic marketing efforts towards travelers from São Paulo and Mogi das Cruzes.
- Tailor amenities and listing descriptions to appeal to the dominant Post-2000s (Gen Z/Alpha) demographic (e.g., highlight fast WiFi, smart home features, local guides).
- Highlight unique local experiences or amenities relevant to the primary guest profile.
- Consider seasonal promotions aligned with peak travel times for key origin markets.
Nearby Short-Term Rental Market Comparison
How does the Guararema Airbnb market stack up against its neighbors? Compare key performance metrics like average monthly revenue, ADR, and occupancy rates in surrounding areas to understand the broader regional STR landscape.
| Market | Active Properties | Monthly Revenue | Daily Rate | Avg. Occupancy |
|---|---|---|---|---|
| Riviera de São Lourenço | 10 | $2,868 | $213.78 | 46% |
| Tuiuti | 18 | $1,686 | $156.45 | 30% |
| Itupeva | 136 | $1,561 | $225.82 | 28% |
| Morungaba | 31 | $1,435 | $263.39 | 27% |
| Campo Limpo Paulista | 49 | $1,428 | $181.02 | 30% |
| Valinhos | 61 | $1,370 | $176.28 | 33% |
| Itatiba | 171 | $1,331 | $177.58 | 29% |
| Vargem | 48 | $1,319 | $190.42 | 28% |
| Elias Fausto | 13 | $1,296 | $143.78 | 30% |
| Porto Feliz | 69 | $1,279 | $260.86 | 27% |