Franca Airbnb Market Analysis 2026: Short Term Rental Data & Vacation Rental Statistics in São Paulo, Brazil
Is Airbnb profitable in Franca in 2026? Explore comprehensive Airbnb analytics for Franca, São Paulo, Brazil to uncover income potential. This 2026 STR market report for Franca, based on AirROI data from February 2025 to January 2026, reveals key trends in the niche market of 196 active listings.
Whether you're considering an Airbnb investment in Franca, optimizing your existing vacation rental, or exploring rental arbitrage opportunities, understanding the Franca Airbnb data is crucial. Leveraging the low regulation environment is key to maximizing your short term rental income potential. Let's dive into the specifics.
Key Franca Airbnb Performance Metrics Overview
Monthly Airbnb Revenue Variations & Income Potential in Franca (2026)
Understanding the monthly revenue variations for Airbnb listings in Franca is key to maximizing your short term rental income potential. Seasonality significantly impacts earnings. Our analysis, based on data from the past 12 months, shows that the peak revenue month for STRs in Franca is typically December, while September often presents the lowest earnings, highlighting opportunities for strategic pricing adjustments during shoulder and low seasons. Explore the typical Airbnb income in Franca across different performance tiers:
- Best-in-class properties (Top 10%) achieve $853+ monthly, often utilizing dynamic pricing and superior guest experiences.
- Strong performing properties (Top 25%) earn $520 or more, indicating effective management and desirable locations/amenities.
- Typical properties (Median) generate around $278 per month, representing the average market performance.
- Entry-level properties (Bottom 25%) see earnings around $135, often with potential for optimization.
Average Monthly Airbnb Earnings Trend in Franca
Franca Airbnb Occupancy Rate Trends (2026)
Maximize your bookings by understanding the Franca STR occupancy trends. Seasonal demand shifts significantly influence how often properties are booked. Typically, Februarysees the highest demand (peak season occupancy), while January experiences the lowest (low season). Effective strategies, like adjusting minimum stays or offering promotions, can boost occupancy during slower periods. Here's how different property tiers perform in Franca:
- Best-in-class properties (Top 10%) achieve 69%+ occupancy, indicating high desirability and potentially optimized availability.
- Strong performing properties (Top 25%) maintain 47% or higher occupancy, suggesting good market fit and guest satisfaction.
- Typical properties (Median) have an occupancy rate around 27%.
- Entry-level properties (Bottom 25%) average 12% occupancy, potentially facing higher vacancy.
Average Monthly Occupancy Rate Trend in Franca
Average Daily Rate (ADR) Airbnb Trends in Franca (2026)
Effective short term rental pricing strategy in Franca involves understanding monthly ADR fluctuations. The Average Daily Rate (ADR) for Airbnb in Franca typically peaks in December and dips lowest during February. Leveraging Airbnb dynamic pricing tools or strategies based on this seasonality can significantly boost revenue. Here's a look at the typical nightly rates achieved:
- Best-in-class properties (Top 10%) command rates of $97+ per night, often due to premium features or locations.
- Strong performing properties (Top 25%) achieve nightly rates of $45 or more.
- Typical properties (Median) charge around $31 per night.
- Entry-level properties (Bottom 25%) earn around $23 per night.
Average Daily Rate (ADR) Trend by Month in Franca
Get Live Franca Market Intelligence 👇

Explore Real-time Analytics
Airbnb Seasonality Analysis & Trends in Franca (2026)
Peak Season (December, March, August)
- Revenue averages $482 per month
- Occupancy rates average 34.7%
- Daily rates average $47
Shoulder Season
- Revenue averages $409 per month
- Occupancy maintains around 33.8%
- Daily rates hold near $46
Low Season (January, June, September)
- Revenue drops to average $356 per month
- Occupancy decreases to average 27.9%
- Daily rates adjust to average $49
Seasonality Insights for Franca
- The Airbnb seasonality in Franca shows moderate seasonality with distinct peak and low periods. While the sections above show seasonal averages, it's also insightful to look at the extremes:
- During the high season, the absolute peak month showcases Franca's highest earning potential, with monthly revenues capable of climbing to $589, occupancy reaching a high of 38.1%, and ADRs peaking at $53.
- Conversely, the slowest single month of the year, typically falling within the low season, marks the market's lowest point. In this month, revenue might dip to $342, occupancy could drop to 25.5%, and ADRs may adjust down to $41.
- Understanding both the seasonal averages and these monthly peaks and troughs in revenue, occupancy, and ADR is crucial for maximizing your Airbnb profit potential in Franca.
Seasonal Strategies for Maximizing Profit
- Peak Season: Maximize revenue through premium pricing and potentially longer minimum stays. Ensure high availability.
- Low Season: Offer competitive pricing, special promotions (e.g., extended stay discounts), and flexible cancellation policies. Target off-season travelers like remote workers or budget-conscious guests.
- Shoulder Seasons: Implement dynamic pricing that balances peak and low rates. Target weekend travelers or specific events. Offer slightly more flexible terms than peak season.
- Regularly analyze your own performance against these Franca seasonality benchmarks and adjust your pricing and availability strategy accordingly.
Best Areas for Airbnb Investment in Franca (2026)
Exploring the top neighborhoods for short-term rentals in Franca? This section highlights key areas, outlining why they are attractive for hosts and guests, along with notable local attractions. Consider these locations based on your target guest profile and investment strategy.
| Neighborhood / Area | Why Host Here? (Target Guests & Appeal) | Key Attractions & Landmarks |
|---|---|---|
| Centro | The bustling heart of Franca, known for its vibrant commerce and close proximity to key amenities. Ideal for travelers seeking convenience and access to local attractions. | Franca Shopping Mall, Paróquia São Benedito, Museu Histórico de Franca, Praça José de Oliveira Freitas, Centro de Cultura, Teatro Municipal de Franca |
| Jardim Nossa Senhora Aparecida | A residential area with parks and recreational spaces. Popular with families and travelers looking for a quieter stay close to nature. | Parque João Mota, Parque dos Taperas, Centro Médico-Hospitalar de Franca, Supermercados, Praças e áreas verdes |
| Jardim Paola | A neighborhood known for its tranquility and family-friendly atmosphere. Great for those looking to escape the hustle and bustle of city life while still being close to urban amenities. | Escola de Idiomas, Supermercados, Acesso rápido ao Centro, Praça da Paz, Parque |
| Jardim Colonial | An upscale neighborhood characterized by beautiful homes and green spaces, appealing to visitors looking for a more affluent stay. | Lagoa do Jardim Colonial, Parque da Aclimação, Restaurantes locais, Lojas de convenience, Praças |
| Vila São Sebastião | A growing neighborhood with modern amenities and access to local markets, attracting both families and young professionals. | Mercado Municipal, Praça do Bairro, Casas noturnas, Parques, Centros esportivos |
| Parque Industrial | An area primarily focused on business with industrial parks, making it appealing for business travelers and conferences. | Indústrias locais, Centro de Eventos, Almoços executivos, Restaurantes locais, Acesso fácil à rodovias |
| Santa Maria | A growing residential neighborhood that combines city living with local charm. Great for those who want a local experience without being in the city center. | Feira Livre de Santa Maria, Parques, Supermercados, Bares e restaurantes locais, Praças |
| Vila Alta | An emerging area with new developments and a mix of residential and commercial properties, promising good returns for investors. | Shopping centers, Praças, Restaurantes novos, Empreendimentos em crescimento, Facilidade de transporte |
Understanding Airbnb License Requirements & STR Laws in Franca (2026)
While Franca, São Paulo, Brazil currently shows low STR regulations, specific Airbnb license requirements might still exist or change. Always verify the latest short term rental regulations and Airbnb license requirements directly with local government authorities for Franca to ensure full compliance before hosting.
(Source: AirROI data, 2026, finding no licensed listings among those analyzed)
Top Performing Airbnb Properties in Franca (2026)
Benchmark your potential! Explore examples of top-performing Airbnb properties in Francabased on Trailing Twelve Month (TTM) revenue. Analyze their characteristics, revenue, occupancy rate, and ADR to understand what drives success in this market.

An oasis within the city
Entire Place • 4 bedrooms

"Cozy Space: Home Sweet Home"
Entire Place • 3 bedrooms

Leisure Farm
Entire Place • 3 bedrooms
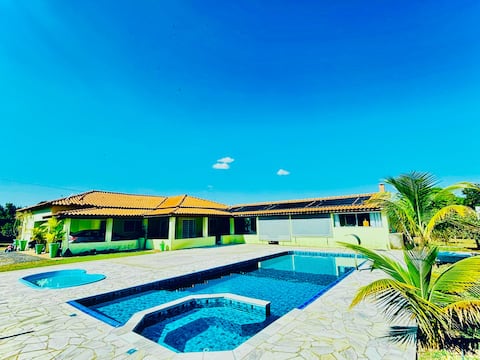
Experience PEACE and refuge in Nature - Franca
Entire Place • 5 bedrooms
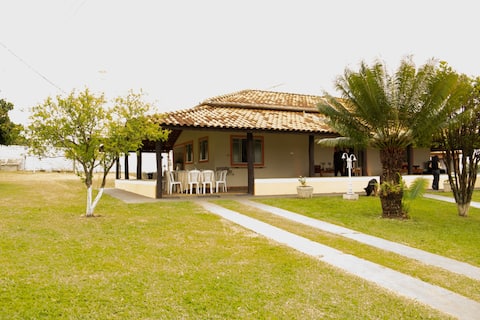
Chácara Piatã
Entire Place • 5 bedrooms

Lovely Chacara Canada
Entire Place • 3 bedrooms
Note: Performance varies based on location, size, amenities, seasonality, and management quality. Data reflects the past 12 months.
Top Performing Airbnb Hosts in Franca (2026)
Learn from the best! This table showcases top-performing Airbnb hosts in Franca based on the number of properties managed and estimated total revenue over the past year. Analyze their scale and performance metrics.
| Host Name | Properties | Grossing Revenue | Stay Reviews | Avg Rating |
|---|---|---|---|---|
| Danilo | 8 | $41,442 | 148 | 4.83/5.0 |
| Thaís | 1 | $33,262 | 17 | 5.00/5.0 |
| Tiago | 2 | $29,576 | 33 | 4.85/5.0 |
| Guilherme | 1 | $21,427 | 19 | 4.95/5.0 |
| Ana Vita | 10 | $20,065 | 210 | 4.99/5.0 |
| Sandra Pavanelo | 1 | $18,883 | 5 | 5.00/5.0 |
| Fabricio Tenka | 2 | $14,209 | 41 | 5.00/5.0 |
| Maria Cecilia | 1 | $14,101 | 4 | 4.00/5.0 |
| Reginaldo | 1 | $13,335 | 18 | 5.00/5.0 |
| Junin Reis | 4 | $12,357 | 216 | 4.96/5.0 |
Analyzing the strategies of top hosts, such as their property selection, pricing, and guest communication, can offer valuable lessons for optimizing your own Airbnb operations in Franca.
Dive Deeper: Advanced Franca STR Market Data (2026)
Ready to unlock more insights? AirROI provides access to advanced metrics and comprehensive Airbnb data for Franca. Explore detailed analytics beyond this report to refine your investment strategy, optimize pricing, and maximize your vacation rental profits.
Explore Advanced MetricsFranca Short-Term Rental Market Composition (2026): Property & Room Types
Room Type Distribution
Property Type Distribution
Market Composition Insights for Franca
- The Franca Airbnb market composition is heavily skewed towards Entire Home/Apt listings, which make up 88.8% of the 196 active rentals. This indicates strong guest preference for privacy and space.
- Looking at the property type distribution in Franca, Apartment/Condo properties are the most common (63.8%), reflecting the local real estate landscape.
- Houses represent a significant 26% portion, catering likely to families or larger groups.
- Smaller segments like outdoor/unique, hotel/boutique, others (combined 10.2%) offer potential for unique stay experiences.
Franca Airbnb Room Capacity Analysis (2026): Bedroom Distribution
Distribution of Listings by Number of Bedrooms
Room Capacity Insights for Franca
- The dominant room capacity in Franca is 2 bedrooms listings, making up 47.4% of the market. This suggests a strong demand for properties suitable for couples or solo travelers.
- Together, 2 bedrooms and 1 bedroom properties represent 76.0% of the active Airbnb listings in Franca, indicating a high concentration in these sizes.
Franca Vacation Rental Guest Capacity Trends (2026)
Distribution of Listings by Guest Capacity
Guest Capacity Insights for Franca
- The most common guest capacity trend in Franca vacation rentals is listings accommodating 4 guests (22.4%). This suggests the primary traveler segment is likely small families or groups.
- Properties designed for 4 guests and 2 guests dominate the Franca STR market, accounting for 40.8% of listings.
- 33.2% of properties accommodate 6+ guests, serving the market segment for larger families or group travel in Franca.
- On average, properties in Franca are equipped to host 4.3 guests.
Franca Airbnb Booking Patterns (2026): Available vs. Booked Days
Available Days Distribution
Booked Days Distribution
Booking Pattern Insights for Franca
- The most common availability pattern in Franca falls within the 271-366 days range, representing 63.8% of listings. This suggests many properties have significant open periods on their calendars.
- Approximately 91.9% of listings show high availability (181+ days open annually), indicating potential for increased bookings or specific owner usage patterns.
- For booked days, the 31-90 days range is most frequent in Franca (39.8%), reflecting common guest stay durations or potential owner blocking patterns.
- A notable 8.7% of properties secure long booking periods (181+ days booked per year), highlighting successful long-term rental strategies or significant owner usage.
Franca Airbnb Minimum Stay Requirements Analysis
Distribution of Listings by Minimum Night Requirement
1 Night
100 listings
51% of total
2 Nights
46 listings
23.5% of total
3 Nights
4 listings
2% of total
4-6 Nights
5 listings
2.6% of total
7-29 Nights
2 listings
1% of total
30+ Nights
39 listings
19.9% of total
Key Insights
- The most prevalent minimum stay requirement in Franca is 1 Night, adopted by 51% of listings. This highlights the market's preference for shorter, flexible bookings.
- A strong majority (74.5%) of the Franca Airbnb data shows acceptance of very short stays (1-2 nights), indicating a dynamic, high-turnover market.
- A significant segment (19.9%) caters to monthly stays (30+ nights) in Franca, pointing to opportunities in the extended-stay market.
Recommendations
- Align with the market by considering a 1 Night minimum stay, as 51% of Franca hosts use this setting.
- Explore offering discounts for stays of 30+ nights to attract the 19.9% of the market seeking extended stays.
- Adjust minimum nights based on seasonality – potentially shorter during low season and longer during peak demand periods in Franca.
Franca Airbnb Cancellation Policy Trends Analysis (2026)
Limited
1 listings
0.5% of total
Super Strict 60 Days
1 listings
0.5% of total
Flexible
74 listings
37.8% of total
Moderate
47 listings
24% of total
Firm
53 listings
27% of total
Strict
20 listings
10.2% of total
Cancellation Policy Insights for Franca
- The prevailing Airbnb cancellation policy trend in Franca is Flexible, used by 37.8% of listings.
- There's a relatively balanced mix between guest-friendly (61.8%) and stricter (37.2%) policies, offering choices for different guest needs.
Recommendations for Hosts
- Consider adopting a Flexible policy to align with the 37.8% market standard in Franca.
- Using a Strict policy might deter some guests, as only 10.2% of listings use it. Evaluate if potential revenue protection outweighs possible lower booking rates.
- Regularly review your cancellation policy against competitors and market demand shifts in Franca.
Franca STR Booking Lead Time Analysis (2026)
Average Booking Lead Time by Month
Booking Lead Time Insights for Franca
- The overall average booking lead time for vacation rentals in Franca is 22 days.
- Guests book furthest in advance for stays during September (average 44 days), likely coinciding with peak travel demand or local events.
- The shortest booking windows occur for stays in March (average 9 days), indicating more last-minute travel plans during this time.
- Seasonally, Fall (26 days avg.) sees the longest lead times, while Spring (12 days avg.) has the shortest, reflecting typical travel planning cycles.
Recommendations for Hosts
- Use the overall average lead time (22 days) as a baseline for your pricing and availability strategy in Franca.
- For September stays, consider implementing length-of-stay discounts or slightly higher rates for bookings made less than 44 days out to capitalize on advance planning.
- During March, focus on last-minute booking availability and promotions, as guests book with very short notice (9 days avg.).
- Target marketing efforts for the Fall season well in advance (at least 26 days) to capture early planners.
- Monitor your own booking lead times against these Franca averages to identify opportunities for dynamic pricing adjustments.
Popular & Essential Airbnb Amenities in Franca (2026)
Amenity Prevalence
Amenity Insights for Franca
- Essential amenities in Franca that guests expect include: Wifi. Lacking these (this) could significantly impact bookings.
- Popular amenities like Kitchen, Free parking on premises, TV are common but not universal. Offering these can provide a competitive edge.
Recommendations for Hosts
- Ensure your listing includes all essential amenities for Franca: Wifi.
- Prioritize adding missing essentials: Wifi.
- Consider adding popular differentiators like Kitchen or Free parking on premises to increase appeal.
- Highlight unique or less common amenities you offer (e.g., hot tub, dedicated workspace, EV charger) in your listing description and photos.
- Regularly check competitor amenities in Franca to stay competitive.
Franca Airbnb Guest Demographics & Profile Analysis (2026)
Guest Profile Summary for Franca
- The typical guest profile for Airbnb in Franca consists of primarily domestic travelers (97%), often arriving from nearby São Paulo, typically belonging to the Post-2000s (Gen Z/Alpha) group (50%), primarily speaking Portuguese or English.
- Domestic travelers account for 97.3% of guests.
- Key international markets include Brazil (97.3%) and United States (0.8%).
- Top languages spoken are Portuguese (52.6%) followed by English (26.6%).
- A significant demographic segment is the Post-2000s (Gen Z/Alpha) group, representing 50% of guests.
Recommendations for Hosts
- Target domestic marketing efforts towards travelers from São Paulo and Franca.
- Tailor amenities and listing descriptions to appeal to the dominant Post-2000s (Gen Z/Alpha) demographic (e.g., highlight fast WiFi, smart home features, local guides).
- Highlight unique local experiences or amenities relevant to the primary guest profile.
- Consider seasonal promotions aligned with peak travel times for key origin markets.
Nearby Short-Term Rental Market Comparison
How does the Franca Airbnb market stack up against its neighbors? Compare key performance metrics like average monthly revenue, ADR, and occupancy rates in surrounding areas to understand the broader regional STR landscape.
| Market | Active Properties | Monthly Revenue | Daily Rate | Avg. Occupancy |
|---|---|---|---|---|
| Cássia | 28 | $1,293 | $132.97 | 34% |
| Rifaina | 41 | $870 | $187.69 | 23% |
| Miguelópolis | 15 | $795 | $231.92 | 22% |
| Capitólio | 513 | $741 | $145.09 | 23% |
| Santa Rita do Passa Quatro | 27 | $712 | $121.97 | 25% |
| Caconde | 28 | $694 | $118.47 | 22% |
| São João da Boa Vista | 68 | $626 | $87.48 | 32% |
| Olímpia | 2,098 | $603 | $80.73 | 41% |
| Águas da Prata | 48 | $586 | $86.46 | 25% |
| Carmo do Rio Claro | 18 | $575 | $136.34 | 24% |