Atibaia Airbnb Market Analysis 2026: Short Term Rental Data & Vacation Rental Statistics in São Paulo, Brazil
Is Airbnb profitable in Atibaia in 2026? Explore comprehensive Airbnb analytics for Atibaia, São Paulo, Brazil to uncover income potential. This 2026 STR market report for Atibaia, based on AirROI data from February 2025 to January 2026, reveals key trends in the market of 604 active listings.
Whether you're considering an Airbnb investment in Atibaia, optimizing your existing vacation rental, or exploring rental arbitrage opportunities, understanding the Atibaia Airbnb data is crucial. Leveraging the low regulation environment is key to maximizing your short term rental income potential. Let's dive into the specifics.
Key Atibaia Airbnb Performance Metrics Overview
Monthly Airbnb Revenue Variations & Income Potential in Atibaia (2026)
Understanding the monthly revenue variations for Airbnb listings in Atibaia is key to maximizing your short term rental income potential. Seasonality significantly impacts earnings. Our analysis, based on data from the past 12 months, shows that the peak revenue month for STRs in Atibaia is typically December, while August often presents the lowest earnings, highlighting opportunities for strategic pricing adjustments during shoulder and low seasons. Explore the typical Airbnb income in Atibaia across different performance tiers:
- Best-in-class properties (Top 10%) achieve $3,660+ monthly, often utilizing dynamic pricing and superior guest experiences.
- Strong performing properties (Top 25%) earn $2,107 or more, indicating effective management and desirable locations/amenities.
- Typical properties (Median) generate around $1,045 per month, representing the average market performance.
- Entry-level properties (Bottom 25%) see earnings around $466, often with potential for optimization.
Average Monthly Airbnb Earnings Trend in Atibaia
Atibaia Airbnb Occupancy Rate Trends (2026)
Maximize your bookings by understanding the Atibaia STR occupancy trends. Seasonal demand shifts significantly influence how often properties are booked. Typically, Decembersees the highest demand (peak season occupancy), while August experiences the lowest (low season). Effective strategies, like adjusting minimum stays or offering promotions, can boost occupancy during slower periods. Here's how different property tiers perform in Atibaia:
- Best-in-class properties (Top 10%) achieve 67%+ occupancy, indicating high desirability and potentially optimized availability.
- Strong performing properties (Top 25%) maintain 46% or higher occupancy, suggesting good market fit and guest satisfaction.
- Typical properties (Median) have an occupancy rate around 26%.
- Entry-level properties (Bottom 25%) average 13% occupancy, potentially facing higher vacancy.
Average Monthly Occupancy Rate Trend in Atibaia
Average Daily Rate (ADR) Airbnb Trends in Atibaia (2026)
Effective short term rental pricing strategy in Atibaia involves understanding monthly ADR fluctuations. The Average Daily Rate (ADR) for Airbnb in Atibaia typically peaks in December and dips lowest during April. Leveraging Airbnb dynamic pricing tools or strategies based on this seasonality can significantly boost revenue. Here's a look at the typical nightly rates achieved:
- Best-in-class properties (Top 10%) command rates of $303+ per night, often due to premium features or locations.
- Strong performing properties (Top 25%) achieve nightly rates of $213 or more.
- Typical properties (Median) charge around $141 per night.
- Entry-level properties (Bottom 25%) earn around $88 per night.
Average Daily Rate (ADR) Trend by Month in Atibaia
Get Live Atibaia Market Intelligence 👇

Explore Real-time Analytics
Airbnb Seasonality Analysis & Trends in Atibaia (2026)
Peak Season (December, January, March)
- Revenue averages $2,239 per month
- Occupancy rates average 36.1%
- Daily rates average $183
Shoulder Season
- Revenue averages $1,508 per month
- Occupancy maintains around 31.9%
- Daily rates hold near $162
Low Season (May, June, August)
- Revenue drops to average $1,263 per month
- Occupancy decreases to average 26.8%
- Daily rates adjust to average $158
Seasonality Insights for Atibaia
- The Airbnb seasonality in Atibaia shows highly seasonal trends requiring careful strategy. While the sections above show seasonal averages, it's also insightful to look at the extremes:
- During the high season, the absolute peak month showcases Atibaia's highest earning potential, with monthly revenues capable of climbing to $2,829, occupancy reaching a high of 38.9%, and ADRs peaking at $203.
- Conversely, the slowest single month of the year, typically falling within the low season, marks the market's lowest point. In this month, revenue might dip to $1,218, occupancy could drop to 26.2%, and ADRs may adjust down to $151.
- Understanding both the seasonal averages and these monthly peaks and troughs in revenue, occupancy, and ADR is crucial for maximizing your Airbnb profit potential in Atibaia.
Seasonal Strategies for Maximizing Profit
- Peak Season: Maximize revenue through premium pricing and potentially longer minimum stays. Ensure high availability.
- Low Season: Offer competitive pricing, special promotions (e.g., extended stay discounts), and flexible cancellation policies. Target off-season travelers like remote workers or budget-conscious guests.
- Shoulder Seasons: Implement dynamic pricing that balances peak and low rates. Target weekend travelers or specific events. Offer slightly more flexible terms than peak season.
- Regularly analyze your own performance against these Atibaia seasonality benchmarks and adjust your pricing and availability strategy accordingly.
Best Areas for Airbnb Investment in Atibaia (2026)
Exploring the top neighborhoods for short-term rentals in Atibaia? This section highlights key areas, outlining why they are attractive for hosts and guests, along with notable local attractions. Consider these locations based on your target guest profile and investment strategy.
| Neighborhood / Area | Why Host Here? (Target Guests & Appeal) | Key Attractions & Landmarks |
|---|---|---|
| Centro | The heart of Atibaia, offering a mix of cultural experiences, shopping, and dining. It's a great location for guests who want to explore local attractions easily. | Atibaia's Church of São João Batista, Shopping at Rua Dr. Almeida, Atibaia Public Market, Local restaurants and cafes |
| Caminho dos Antiquários | Known for its antique shops and artistic charm, this area attracts visitors interested in history and art. Ideal for a unique Airbnb experience. | Antique shops, Cultural events, Art galleries, Scenic views |
| Pico do Olho d'Água | A popular natural attraction, perfect for outdoor enthusiasts and nature lovers. Ideal for guests looking to hike and enjoy stunning views. | Hiking trails, Natural parks, Panoramic views of Atibaia |
| Bairro do Itapetinga | A residential area that offers a peaceful retreat while still being close to major attractions, perfect for families and groups. | Local parks, Family-friendly activities, Community events |
| Bairros como Pousada Serra do Luar | Nestled in nature, this area offers a tranquil escape with rustic charm, attracting visitors seeking relaxation and nature. | Nature walks, Local flora and fauna, Relaxing environment |
| Aeroporto de Atibaia | Atibaia Airport area allows easy access for travelers, making it a good spot for short stays and business-oriented guests. | Aviation-related activities, Nearby accommodation options, Business facilities |
| Lago do Major | Attractive for those who enjoy water activities and outdoor recreation. It's a great spot for leisure and relaxation. | Lakeside activities, Picnic areas, Walking paths |
| Pousada da Pedra Grande | Known for its scenic beauty and outdoor activities like climbing and hiking, this area attracts adventure seekers and nature lovers alike. | Rock climbing, Scenic trails, Beautiful landscapes |
Understanding Airbnb License Requirements & STR Laws in Atibaia (2026)
While Atibaia, São Paulo, Brazil currently shows low STR regulations, specific Airbnb license requirements might still exist or change. Always verify the latest short term rental regulations and Airbnb license requirements directly with local government authorities for Atibaia to ensure full compliance before hosting.
(Source: AirROI data, 2026, based on 1% licensed listings)
Top Performing Airbnb Properties in Atibaia (2026)
Benchmark your potential! Explore examples of top-performing Airbnb properties in Atibaiabased on Trailing Twelve Month (TTM) revenue. Analyze their characteristics, revenue, occupancy rate, and ADR to understand what drives success in this market.
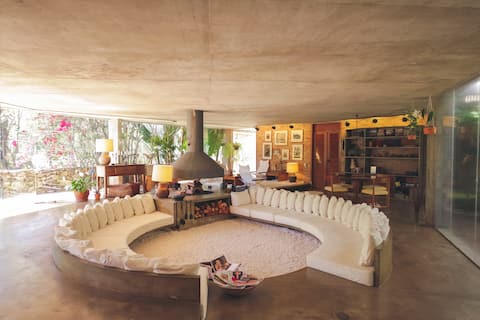
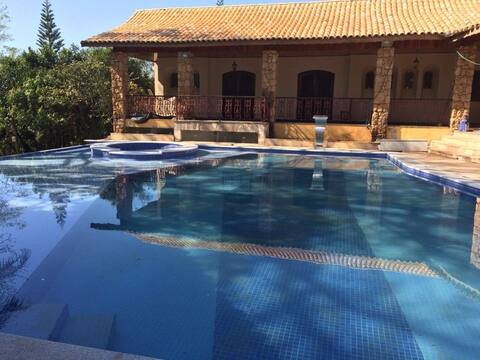
Rent in Atibaia, Condominium and Heated Pool!
Entire Place • 9 bedrooms
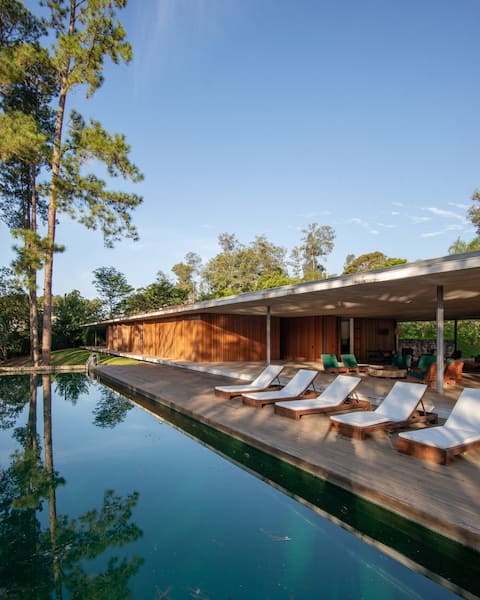
Passionate Marcio Kogan's house for 16 people!
Entire Place • 7 bedrooms
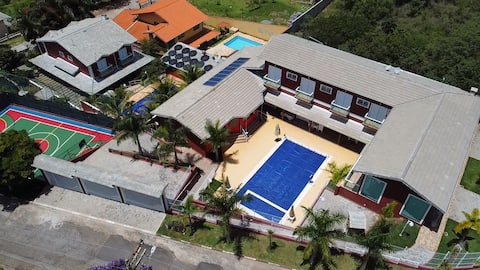
BEAUTIFUL HOUSE! Heated pool and sand court
Entire Place • 5 bedrooms
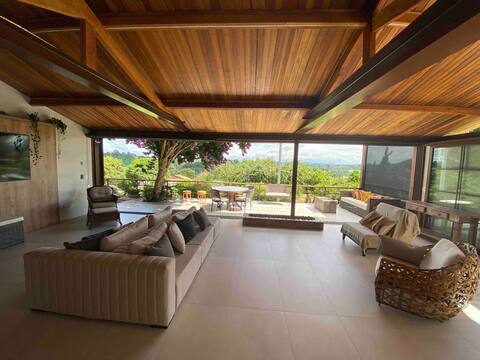
Atibaia House - Contemporary Atchitecture
Entire Place • 5 bedrooms
Chacara Mansao AAA 8 suites
Entire Place • 7 bedrooms

Heated Pool, Security and Leisure-Casa Floratta
Entire Place • 4 bedrooms
Note: Performance varies based on location, size, amenities, seasonality, and management quality. Data reflects the past 12 months.
Top Performing Airbnb Hosts in Atibaia (2026)
Learn from the best! This table showcases top-performing Airbnb hosts in Atibaia based on the number of properties managed and estimated total revenue over the past year. Analyze their scale and performance metrics.
| Host Name | Properties | Grossing Revenue | Stay Reviews | Avg Rating |
|---|---|---|---|---|
| Lidia | 3 | $167,704 | 235 | 4.95/5.0 |
| Fabio | 1 | $123,945 | 129 | 4.96/5.0 |
| Wow Stay | 9 | $123,461 | 438 | 4.91/5.0 |
| Tais | 3 | $122,711 | 85 | 4.99/5.0 |
| Andre | 1 | $120,910 | 20 | 4.90/5.0 |
| Rafael Teruya | 1 | $119,066 | 62 | 5.00/5.0 |
| Pedro | 1 | $110,912 | 149 | 4.88/5.0 |
| Rodrigo | 3 | $98,220 | 576 | 4.83/5.0 |
| Talita | 2 | $95,176 | 131 | 4.95/5.0 |
| Vanderlei | 1 | $86,633 | 71 | 4.89/5.0 |
Analyzing the strategies of top hosts, such as their property selection, pricing, and guest communication, can offer valuable lessons for optimizing your own Airbnb operations in Atibaia.
Dive Deeper: Advanced Atibaia STR Market Data (2026)
Ready to unlock more insights? AirROI provides access to advanced metrics and comprehensive Airbnb data for Atibaia. Explore detailed analytics beyond this report to refine your investment strategy, optimize pricing, and maximize your vacation rental profits.
Explore Advanced MetricsAtibaia Short-Term Rental Market Composition (2026): Property & Room Types
Room Type Distribution
Property Type Distribution
Market Composition Insights for Atibaia
- The Atibaia Airbnb market composition is heavily skewed towards Entire Home/Apt listings, which make up 94% of the 604 active rentals. This indicates strong guest preference for privacy and space.
- Looking at the property type distribution in Atibaia, House properties are the most common (85.8%), reflecting the local real estate landscape.
- Houses represent a significant 85.8% portion, catering likely to families or larger groups.
- The presence of 6.5% Hotel/Boutique listings indicates integration with traditional hospitality.
- Smaller segments like outdoor/unique, apartment/condo, others, unique stays (combined 7.8%) offer potential for unique stay experiences.
Atibaia Airbnb Room Capacity Analysis (2026): Bedroom Distribution
Distribution of Listings by Number of Bedrooms
Room Capacity Insights for Atibaia
- The dominant room capacity in Atibaia is 3 bedrooms listings, making up 29% of the market. This suggests a strong demand for properties suitable for families or small groups.
- Together, 3 bedrooms and 5+ bedrooms properties represent 48.7% of the active Airbnb listings in Atibaia, indicating a high concentration in these sizes.
- A significant 67.6% of listings offer 3+ bedrooms, catering to larger groups and families seeking more space in Atibaia.
Atibaia Vacation Rental Guest Capacity Trends (2026)
Distribution of Listings by Guest Capacity
Guest Capacity Insights for Atibaia
- The most common guest capacity trend in Atibaia vacation rentals is listings accommodating 8+ guests (67.9%). This suggests the primary traveler segment is likely larger groups.
- Properties designed for 8+ guests and 6 guests dominate the Atibaia STR market, accounting for 76.7% of listings.
- 78.9% of properties accommodate 6+ guests, serving the market segment for larger families or group travel in Atibaia.
- On average, properties in Atibaia are equipped to host 6.7 guests.
Atibaia Airbnb Booking Patterns (2026): Available vs. Booked Days
Available Days Distribution
Booked Days Distribution
Booking Pattern Insights for Atibaia
- The most common availability pattern in Atibaia falls within the 271-366 days range, representing 67.5% of listings. This suggests many properties have significant open periods on their calendars.
- Approximately 90.2% of listings show high availability (181+ days open annually), indicating potential for increased bookings or specific owner usage patterns.
- For booked days, the 31-90 days range is most frequent in Atibaia (33.6%), reflecting common guest stay durations or potential owner blocking patterns.
- A notable 10.2% of properties secure long booking periods (181+ days booked per year), highlighting successful long-term rental strategies or significant owner usage.
Atibaia Airbnb Minimum Stay Requirements Analysis
Distribution of Listings by Minimum Night Requirement
1 Night
133 listings
22% of total
2 Nights
291 listings
48.2% of total
3 Nights
12 listings
2% of total
4-6 Nights
5 listings
0.8% of total
30+ Nights
163 listings
27% of total
Key Insights
- The most prevalent minimum stay requirement in Atibaia is 2 Nights, adopted by 48.2% of listings. This highlights the market's preference for shorter, flexible bookings.
- A strong majority (70.2%) of the Atibaia Airbnb data shows acceptance of very short stays (1-2 nights), indicating a dynamic, high-turnover market.
- A significant segment (27%) caters to monthly stays (30+ nights) in Atibaia, pointing to opportunities in the extended-stay market.
Recommendations
- Align with the market by considering a 2 Nights minimum stay, as 48.2% of Atibaia hosts use this setting.
- If feasible, allowing 1-night stays, especially midweek or during low season, could capture last-minute bookings, as only 22% currently do.
- Explore offering discounts for stays of 30+ nights to attract the 27% of the market seeking extended stays.
- Adjust minimum nights based on seasonality – potentially shorter during low season and longer during peak demand periods in Atibaia.
Atibaia Airbnb Cancellation Policy Trends Analysis (2026)
Super Strict 60 Days
2 listings
0.3% of total
Limited
15 listings
2.5% of total
Flexible
147 listings
24.4% of total
Moderate
132 listings
21.9% of total
Firm
229 listings
38% of total
Strict
78 listings
12.9% of total
Cancellation Policy Insights for Atibaia
- The prevailing Airbnb cancellation policy trend in Atibaia is Firm, used by 38% of listings.
- A majority (50.9%) of hosts in Atibaia utilize Firm or Strict policies, indicating a market where hosts prioritize booking security.
Recommendations for Hosts
- Consider adopting a Firm policy to align with the 38% market standard in Atibaia.
- Using a Strict policy might deter some guests, as only 12.9% of listings use it. Evaluate if potential revenue protection outweighs possible lower booking rates.
- Regularly review your cancellation policy against competitors and market demand shifts in Atibaia.
Atibaia STR Booking Lead Time Analysis (2026)
Average Booking Lead Time by Month
Booking Lead Time Insights for Atibaia
- The overall average booking lead time for vacation rentals in Atibaia is 37 days.
- Guests book furthest in advance for stays during December (average 70 days), likely coinciding with peak travel demand or local events.
- The shortest booking windows occur for stays in June (average 22 days), indicating more last-minute travel plans during this time.
- Seasonally, Winter (45 days avg.) sees the longest lead times, while Summer (25 days avg.) has the shortest, reflecting typical travel planning cycles.
Recommendations for Hosts
- Use the overall average lead time (37 days) as a baseline for your pricing and availability strategy in Atibaia.
- For December stays, consider implementing length-of-stay discounts or slightly higher rates for bookings made less than 70 days out to capitalize on advance planning.
- Target marketing efforts for the Winter season well in advance (at least 45 days) to capture early planners.
- Monitor your own booking lead times against these Atibaia averages to identify opportunities for dynamic pricing adjustments.
Popular & Essential Airbnb Amenities in Atibaia (2026)
Amenity Prevalence
Amenity Insights for Atibaia
- Essential amenities in Atibaia that guests expect include: Wifi, Free parking on premises. Lacking these (any) could significantly impact bookings.
- Popular amenities like Kitchen, TV, BBQ grill are common but not universal. Offering these can provide a competitive edge.
- A pool is a highly desired but not standard amenity, making it a key feature for attracting guests seeking leisure in Atibaia.
Recommendations for Hosts
- Ensure your listing includes all essential amenities for Atibaia: Wifi, Free parking on premises.
- Prioritize adding missing essentials: Wifi, Free parking on premises.
- Consider adding popular differentiators like Kitchen or TV to increase appeal.
- Highlight unique or less common amenities you offer (e.g., hot tub, dedicated workspace, EV charger) in your listing description and photos.
- Regularly check competitor amenities in Atibaia to stay competitive.
Atibaia Airbnb Guest Demographics & Profile Analysis (2026)
Guest Profile Summary for Atibaia
- The typical guest profile for Airbnb in Atibaia consists of primarily domestic travelers (97%), often arriving from nearby São Paulo, typically belonging to the Post-2000s (Gen Z/Alpha) group (50%), primarily speaking Portuguese or English.
- Domestic travelers account for 96.8% of guests.
- Key international markets include Brazil (96.8%) and United States (1.4%).
- Top languages spoken are Portuguese (46.7%) followed by English (31.7%).
- A significant demographic segment is the Post-2000s (Gen Z/Alpha) group, representing 50% of guests.
Recommendations for Hosts
- Target domestic marketing efforts towards travelers from São Paulo and Guarulhos.
- Tailor amenities and listing descriptions to appeal to the dominant Post-2000s (Gen Z/Alpha) demographic (e.g., highlight fast WiFi, smart home features, local guides).
- Highlight unique local experiences or amenities relevant to the primary guest profile.
- Consider seasonal promotions aligned with peak travel times for key origin markets.
Nearby Short-Term Rental Market Comparison
How does the Atibaia Airbnb market stack up against its neighbors? Compare key performance metrics like average monthly revenue, ADR, and occupancy rates in surrounding areas to understand the broader regional STR landscape.
| Market | Active Properties | Monthly Revenue | Daily Rate | Avg. Occupancy |
|---|---|---|---|---|
| Riviera de São Lourenço | 10 | $2,868 | $213.78 | 46% |
| Tuiuti | 18 | $1,686 | $156.45 | 30% |
| Itupeva | 136 | $1,561 | $225.82 | 28% |
| Morungaba | 31 | $1,435 | $263.39 | 27% |
| Campo Limpo Paulista | 49 | $1,428 | $181.02 | 30% |
| Valinhos | 61 | $1,370 | $176.28 | 33% |
| Itatiba | 171 | $1,331 | $177.58 | 29% |
| Vargem | 48 | $1,319 | $190.42 | 28% |
| Elias Fausto | 13 | $1,296 | $143.78 | 30% |
| Porto Feliz | 69 | $1,279 | $260.86 | 27% |