Timbé do Sul Airbnb Market Analysis 2026: Short Term Rental Data & Vacation Rental Statistics in Santa Catarina, Brazil
Is Airbnb profitable in Timbé do Sul in 2026? Explore comprehensive Airbnb analytics for Timbé do Sul, Santa Catarina, Brazil to uncover income potential. This 2026 STR market report for Timbé do Sul, based on AirROI data from February 2025 to January 2026, reveals key trends in the niche market of 21 active listings.
Whether you're considering an Airbnb investment in Timbé do Sul, optimizing your existing vacation rental, or exploring rental arbitrage opportunities, understanding the Timbé do Sul Airbnb data is crucial. Leveraging the low regulation environment is key to maximizing your short term rental income potential. Let's dive into the specifics.
Key Timbé do Sul Airbnb Performance Metrics Overview
Monthly Airbnb Revenue Variations & Income Potential in Timbé do Sul (2026)
Understanding the monthly revenue variations for Airbnb listings in Timbé do Sul is key to maximizing your short term rental income potential. Seasonality significantly impacts earnings. Our analysis, based on data from the past 12 months, shows that the peak revenue month for STRs in Timbé do Sul is typically March, while July often presents the lowest earnings, highlighting opportunities for strategic pricing adjustments during shoulder and low seasons. Explore the typical Airbnb income in Timbé do Sul across different performance tiers:
- Best-in-class properties (Top 10%) achieve $1,359+ monthly, often utilizing dynamic pricing and superior guest experiences.
- Strong performing properties (Top 25%) earn $854 or more, indicating effective management and desirable locations/amenities.
- Typical properties (Median) generate around $523 per month, representing the average market performance.
- Entry-level properties (Bottom 25%) see earnings around $285, often with potential for optimization.
Average Monthly Airbnb Earnings Trend in Timbé do Sul
Timbé do Sul Airbnb Occupancy Rate Trends (2026)
Maximize your bookings by understanding the Timbé do Sul STR occupancy trends. Seasonal demand shifts significantly influence how often properties are booked. Typically, Marchsees the highest demand (peak season occupancy), while October experiences the lowest (low season). Effective strategies, like adjusting minimum stays or offering promotions, can boost occupancy during slower periods. Here's how different property tiers perform in Timbé do Sul:
- Best-in-class properties (Top 10%) achieve 36%+ occupancy, indicating high desirability and potentially optimized availability.
- Strong performing properties (Top 25%) maintain 28% or higher occupancy, suggesting good market fit and guest satisfaction.
- Typical properties (Median) have an occupancy rate around 17%.
- Entry-level properties (Bottom 25%) average 11% occupancy, potentially facing higher vacancy.
Average Monthly Occupancy Rate Trend in Timbé do Sul
Average Daily Rate (ADR) Airbnb Trends in Timbé do Sul (2026)
Effective short term rental pricing strategy in Timbé do Sul involves understanding monthly ADR fluctuations. The Average Daily Rate (ADR) for Airbnb in Timbé do Sul typically peaks in September and dips lowest during February. Leveraging Airbnb dynamic pricing tools or strategies based on this seasonality can significantly boost revenue. Here's a look at the typical nightly rates achieved:
- Best-in-class properties (Top 10%) command rates of $270+ per night, often due to premium features or locations.
- Strong performing properties (Top 25%) achieve nightly rates of $147 or more.
- Typical properties (Median) charge around $104 per night.
- Entry-level properties (Bottom 25%) earn around $69 per night.
Average Daily Rate (ADR) Trend by Month in Timbé do Sul
Get Live Timbé do Sul Market Intelligence 👇

Explore Real-time Analytics
Airbnb Seasonality Analysis & Trends in Timbé do Sul (2026)
Peak Season (March, April, December)
- Revenue averages $903 per month
- Occupancy rates average 27.9%
- Daily rates average $135
Shoulder Season
- Revenue averages $607 per month
- Occupancy maintains around 19.4%
- Daily rates hold near $136
Low Season (July, August, October)
- Revenue drops to average $448 per month
- Occupancy decreases to average 14.1%
- Daily rates adjust to average $136
Seasonality Insights for Timbé do Sul
- The Airbnb seasonality in Timbé do Sul shows highly seasonal trends requiring careful strategy. While the sections above show seasonal averages, it's also insightful to look at the extremes:
- During the high season, the absolute peak month showcases Timbé do Sul's highest earning potential, with monthly revenues capable of climbing to $986, occupancy reaching a high of 31.6%, and ADRs peaking at $141.
- Conversely, the slowest single month of the year, typically falling within the low season, marks the market's lowest point. In this month, revenue might dip to $439, occupancy could drop to 14.0%, and ADRs may adjust down to $132.
- Understanding both the seasonal averages and these monthly peaks and troughs in revenue, occupancy, and ADR is crucial for maximizing your Airbnb profit potential in Timbé do Sul.
Seasonal Strategies for Maximizing Profit
- Peak Season: Maximize revenue through premium pricing and potentially longer minimum stays. Ensure high availability.
- Low Season: Offer competitive pricing, special promotions (e.g., extended stay discounts), and flexible cancellation policies. Target off-season travelers like remote workers or budget-conscious guests.
- Shoulder Seasons: Implement dynamic pricing that balances peak and low rates. Target weekend travelers or specific events. Offer slightly more flexible terms than peak season.
- Regularly analyze your own performance against these Timbé do Sul seasonality benchmarks and adjust your pricing and availability strategy accordingly.
Best Areas for Airbnb Investment in Timbé do Sul (2026)
Exploring the top neighborhoods for short-term rentals in Timbé do Sul? This section highlights key areas, outlining why they are attractive for hosts and guests, along with notable local attractions. Consider these locations based on your target guest profile and investment strategy.
| Neighborhood / Area | Why Host Here? (Target Guests & Appeal) | Key Attractions & Landmarks |
|---|---|---|
| Praia do Rosa | A stunning beach known for its beautiful landscapes and surfing opportunities. Attracts tourists looking for relaxation and adventure in nature, as well as families wanting to enjoy beach life. | Praia do Rosa Beach, Lagoa do Meio, Whale Watching Tours, Surf Schools, Restaurants and Bars, Hiking Trails |
| Guarda do Embaú | A small beach village offering an incredible natural setting and a relaxed vibe. It is perfect for travelers who love hiking, nature, and a tranquil beach atmosphere. | Guarda do Embaú Beach, Praia da Pinheira, Morro do Pão de Açúcar, Hiking Trails, Local Restaurants |
| Laguna | A charming historic town with rich history and beautiful beaches. Attractive for tourists interested in cultural experiences, seafood, and local festivals. | Laguna's Historic Center, Batelão Beach, Praia do Gravatá, Local Seafood Restaurants, Cultural Events |
| Dunas do Pacheco | Known for its natural beauty and large sand dunes, ideal for those seeking outdoor activities and breathtaking views. | Dunas do Pacheco, Lake of Dunas, Sandboarding, Nature Trails |
| Santa Marta | A small fishing village that offers an authentic experience with beautiful beaches and a laid-back atmosphere, attracting surfers and eco-tourists. | Santa Marta Beach, Ecological Trails, Surfing Points, Fishing Tours |
| Praia da Galheta | A popular yet secluded beach known for its natural beauty, attracting a diverse crowd, including naturists and beach lovers. | Galheta Beach, Hiking Trails to Beaches, Private Beaches, Wildlife Watching |
| Morrem de Amor | A picturesque beach location known for its tranquility, ideal for those looking for a getaway from busy tourist areas. | Morrem de Amor Beach, Local Artisans, Quiet Environment, Shopping for Handmade Goods |
| Meia Praia | A vibrant beach area popular for its nightlife and leisure activities. Great for those looking for fun and social life in beach settings. | Meia Praia Beach, Beach Volleyball, Bars and Nightclubs, Water Sports Rentals |
Understanding Airbnb License Requirements & STR Laws in Timbé do Sul (2026)
While Timbé do Sul, Santa Catarina, Brazil currently shows low STR regulations, specific Airbnb license requirements might still exist or change. Always verify the latest short term rental regulations and Airbnb license requirements directly with local government authorities for Timbé do Sul to ensure full compliance before hosting.
(Source: AirROI data, 2026, finding no licensed listings among those analyzed)
Top Performing Airbnb Properties in Timbé do Sul (2026)
Benchmark your potential! Explore examples of top-performing Airbnb properties in Timbé do Sulbased on Trailing Twelve Month (TTM) revenue. Analyze their characteristics, revenue, occupancy rate, and ADR to understand what drives success in this market.

Chalé Tangará - Timbé do Sul/SC - Entire space
Entire Place • 1 bedroom

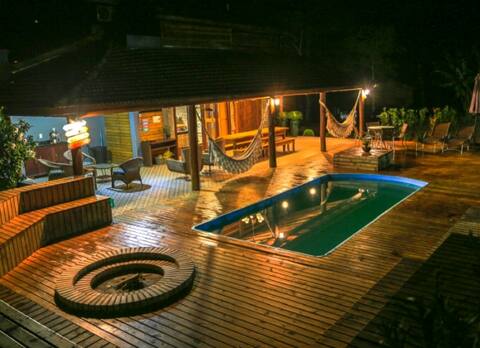
Amazing view of the mountains.
Entire Place • 1 bedroom
Tree House
Entire Place • N/A
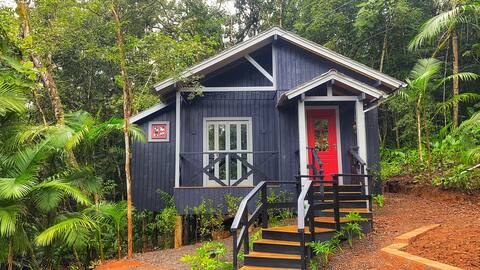
Stone House Chalet
Entire Place • 3 bedrooms
Chalé Sabiá - Timbé do Sul - Entire space
Entire Place • 1 bedroom

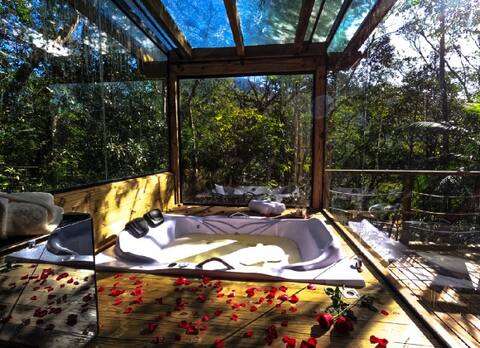
Romantic Cabin at the foot of the Serra/hydromassage
Entire Place • 1 bedroom
Note: Performance varies based on location, size, amenities, seasonality, and management quality. Data reflects the past 12 months.
Top Performing Airbnb Hosts in Timbé do Sul (2026)
Learn from the best! This table showcases top-performing Airbnb hosts in Timbé do Sul based on the number of properties managed and estimated total revenue over the past year. Analyze their scale and performance metrics.
| Host Name | Properties | Grossing Revenue | Stay Reviews | Avg Rating |
|---|---|---|---|---|
| Juci | 3 | $27,804 | 59 | 5.00/5.0 |
| Chalé | 4 | $26,577 | 31 | 5.00/5.0 |
| Fernando | 2 | $21,899 | 128 | 4.75/5.0 |
| Robinho | 4 | $7,395 | 20 | 5.00/5.0 |
| Daniele | 1 | $6,734 | 5 | 5.00/5.0 |
| Welliton | 1 | $6,617 | 3 | 5.00/5.0 |
| Monique | 1 | $4,009 | 65 | 4.94/5.0 |
| Léia | 1 | $3,722 | 23 | 5.00/5.0 |
| Emanuelle | 1 | $2,742 | 3 | 5.00/5.0 |
| Daiane | 1 | $2,200 | 15 | 4.87/5.0 |
Analyzing the strategies of top hosts, such as their property selection, pricing, and guest communication, can offer valuable lessons for optimizing your own Airbnb operations in Timbé do Sul.
Dive Deeper: Advanced Timbé do Sul STR Market Data (2026)
Ready to unlock more insights? AirROI provides access to advanced metrics and comprehensive Airbnb data for Timbé do Sul. Explore detailed analytics beyond this report to refine your investment strategy, optimize pricing, and maximize your vacation rental profits.
Explore Advanced MetricsTimbé do Sul Short-Term Rental Market Composition (2026): Property & Room Types
Room Type Distribution
Property Type Distribution
Market Composition Insights for Timbé do Sul
- The Timbé do Sul Airbnb market composition is heavily skewed towards Entire Home/Apt listings, which make up 81% of the 21 active rentals. This indicates strong guest preference for privacy and space.
- Looking at the property type distribution in Timbé do Sul, Outdoor/Unique properties are the most common (42.9%), reflecting the local real estate landscape.
- Houses represent a significant 23.8% portion, catering likely to families or larger groups.
- The presence of 23.8% Hotel/Boutique listings indicates integration with traditional hospitality.
- Smaller segments like unique stays, others (combined 9.6%) offer potential for unique stay experiences.
Timbé do Sul Airbnb Room Capacity Analysis (2026): Bedroom Distribution
Distribution of Listings by Number of Bedrooms
Room Capacity Insights for Timbé do Sul
- The dominant room capacity in Timbé do Sul is 1 bedroom listings, making up 61.9% of the market. This suggests a strong demand for properties suitable for couples or solo travelers.
- Together, 1 bedroom and 2 bedrooms properties represent 80.9% of the active Airbnb listings in Timbé do Sul, indicating a high concentration in these sizes.
- With over half the market (61.9%) consisting of studios or 1-bedroom units, Timbé do Sul is particularly well-suited for individuals or couples.
Timbé do Sul Vacation Rental Guest Capacity Trends (2026)
Distribution of Listings by Guest Capacity
Guest Capacity Insights for Timbé do Sul
- The most common guest capacity trend in Timbé do Sul vacation rentals is listings accommodating 2 guests (47.6%). This suggests the primary traveler segment is likely couples or solo travelers.
- Properties designed for 2 guests and 8+ guests dominate the Timbé do Sul STR market, accounting for 61.9% of listings.
- A significant 47.6% of listings cater specifically to 1-2 guests, highlighting strong demand from couples and solo travelers in Timbé do Sul.
- 23.8% of properties accommodate 6+ guests, serving the market segment for larger families or group travel in Timbé do Sul.
- On average, properties in Timbé do Sul are equipped to host 3.5 guests.
Timbé do Sul Airbnb Booking Patterns (2026): Available vs. Booked Days
Available Days Distribution
Booked Days Distribution
Booking Pattern Insights for Timbé do Sul
- The most common availability pattern in Timbé do Sul falls within the 271-366 days range, representing 90.5% of listings. This suggests many properties have significant open periods on their calendars.
- Approximately 100.0% of listings show high availability (181+ days open annually), indicating potential for increased bookings or specific owner usage patterns.
- For booked days, the 31-90 days range is most frequent in Timbé do Sul (57.1%), reflecting common guest stay durations or potential owner blocking patterns.
Timbé do Sul Airbnb Minimum Stay Requirements Analysis
Distribution of Listings by Minimum Night Requirement
1 Night
13 listings
61.9% of total
2 Nights
3 listings
14.3% of total
30+ Nights
5 listings
23.8% of total
Key Insights
- The most prevalent minimum stay requirement in Timbé do Sul is 1 Night, adopted by 61.9% of listings. This highlights the market's preference for shorter, flexible bookings.
- A strong majority (76.2%) of the Timbé do Sul Airbnb data shows acceptance of very short stays (1-2 nights), indicating a dynamic, high-turnover market.
- A significant segment (23.8%) caters to monthly stays (30+ nights) in Timbé do Sul, pointing to opportunities in the extended-stay market.
Recommendations
- Align with the market by considering a 1 Night minimum stay, as 61.9% of Timbé do Sul hosts use this setting.
- Explore offering discounts for stays of 30+ nights to attract the 23.8% of the market seeking extended stays.
- Adjust minimum nights based on seasonality – potentially shorter during low season and longer during peak demand periods in Timbé do Sul.
Timbé do Sul Airbnb Cancellation Policy Trends Analysis (2026)
Flexible
6 listings
28.6% of total
Moderate
6 listings
28.6% of total
Firm
9 listings
42.9% of total
Cancellation Policy Insights for Timbé do Sul
- The prevailing Airbnb cancellation policy trend in Timbé do Sul is Firm, used by 42.9% of listings.
- There's a relatively balanced mix between guest-friendly (57.2%) and stricter (42.9%) policies, offering choices for different guest needs.
Recommendations for Hosts
- Consider adopting a Firm policy to align with the 42.9% market standard in Timbé do Sul.
- Regularly review your cancellation policy against competitors and market demand shifts in Timbé do Sul.
Timbé do Sul STR Booking Lead Time Analysis (2026)
Average Booking Lead Time by Month
Booking Lead Time Insights for Timbé do Sul
- The overall average booking lead time for vacation rentals in Timbé do Sul is 30 days.
- Guests book furthest in advance for stays during August (average 62 days), likely coinciding with peak travel demand or local events.
- The shortest booking windows occur for stays in February (average 20 days), indicating more last-minute travel plans during this time.
- Seasonally, Summer (37 days avg.) sees the longest lead times, while Winter (27 days avg.) has the shortest, reflecting typical travel planning cycles.
Recommendations for Hosts
- Use the overall average lead time (30 days) as a baseline for your pricing and availability strategy in Timbé do Sul.
- For August stays, consider implementing length-of-stay discounts or slightly higher rates for bookings made less than 62 days out to capitalize on advance planning.
- Target marketing efforts for the Summer season well in advance (at least 37 days) to capture early planners.
- Monitor your own booking lead times against these Timbé do Sul averages to identify opportunities for dynamic pricing adjustments.
Popular & Essential Airbnb Amenities in Timbé do Sul (2026)
Amenity Prevalence
Amenity Insights for Timbé do Sul
- Essential amenities in Timbé do Sul that guests expect include: Pets allowed, Kitchen, Wifi, TV, Free parking on premises. Lacking these (any) could significantly impact bookings.
- Popular amenities like Air conditioning, Dishes and silverware, BBQ grill are common but not universal. Offering these can provide a competitive edge.
Recommendations for Hosts
- Ensure your listing includes all essential amenities for Timbé do Sul: Pets allowed, Kitchen, Wifi, TV, Free parking on premises.
- Prioritize adding missing essentials: TV, Free parking on premises.
- Consider adding popular differentiators like Air conditioning or Dishes and silverware to increase appeal.
- Highlight unique or less common amenities you offer (e.g., hot tub, dedicated workspace, EV charger) in your listing description and photos.
- Regularly check competitor amenities in Timbé do Sul to stay competitive.
Timbé do Sul Airbnb Guest Demographics & Profile Analysis (2026)
Guest Profile Summary for Timbé do Sul
- The typical guest profile for Airbnb in Timbé do Sul consists of primarily domestic travelers (100%), often arriving from nearby Criciúma, typically belonging to the Post-2000s (Gen Z/Alpha) group (50%), primarily speaking Portuguese or English.
- Domestic travelers account for 100.0% of guests.
- Top languages spoken are Portuguese (44.4%) followed by English (29.6%).
- A significant demographic segment is the Post-2000s (Gen Z/Alpha) group, representing 50% of guests.
Recommendations for Hosts
- Target domestic marketing efforts towards travelers from Criciúma and Rio Grande do Sul.
- Tailor amenities and listing descriptions to appeal to the dominant Post-2000s (Gen Z/Alpha) demographic (e.g., highlight fast WiFi, smart home features, local guides).
- Highlight unique local experiences or amenities relevant to the primary guest profile.
- Consider seasonal promotions aligned with peak travel times for key origin markets.
Nearby Short-Term Rental Market Comparison
How does the Timbé do Sul Airbnb market stack up against its neighbors? Compare key performance metrics like average monthly revenue, ADR, and occupancy rates in surrounding areas to understand the broader regional STR landscape.
| Market | Active Properties | Monthly Revenue | Daily Rate | Avg. Occupancy |
|---|---|---|---|---|
| Rancho Queimado | 177 | $1,169 | $156.09 | 28% |
| Angelina | 25 | $1,022 | $113.19 | 27% |
| Alfredo Wagner | 183 | $946 | $127.37 | 25% |
| Anitápolis | 72 | $828 | $90.20 | 33% |
| Região Geográfica Imediata de Lages | 63 | $807 | $130.68 | 26% |
| Canelinha | 12 | $803 | $163.57 | 24% |
| Gramado | 3,177 | $778 | $93.36 | 36% |
| Região Geográfica Imediata de Florianópolis | 21 | $774 | $120.71 | 22% |
| Santo Amaro da Imperatriz | 88 | $772 | $114.43 | 28% |
| Antônio Carlos | 38 | $769 | $115.39 | 26% |