São Pedro de Alcântara Airbnb Market Analysis 2026: Short Term Rental Data & Vacation Rental Statistics in Santa Catarina, Brazil
Is Airbnb profitable in São Pedro de Alcântara in 2026? Explore comprehensive Airbnb analytics for São Pedro de Alcântara, Santa Catarina, Brazil to uncover income potential. This 2026 STR market report for São Pedro de Alcântara, based on AirROI data from February 2025 to January 2026, reveals key trends in the niche market of 22 active listings.
Whether you're considering an Airbnb investment in São Pedro de Alcântara, optimizing your existing vacation rental, or exploring rental arbitrage opportunities, understanding the São Pedro de Alcântara Airbnb data is crucial. Leveraging the low regulation environment is key to maximizing your short term rental income potential. Let's dive into the specifics.
Key São Pedro de Alcântara Airbnb Performance Metrics Overview
Monthly Airbnb Revenue Variations & Income Potential in São Pedro de Alcântara (2026)
Understanding the monthly revenue variations for Airbnb listings in São Pedro de Alcântara is key to maximizing your short term rental income potential. Seasonality significantly impacts earnings. Our analysis, based on data from the past 12 months, shows that the peak revenue month for STRs in São Pedro de Alcântara is typically July, while September often presents the lowest earnings, highlighting opportunities for strategic pricing adjustments during shoulder and low seasons. Explore the typical Airbnb income in São Pedro de Alcântara across different performance tiers:
- Best-in-class properties (Top 10%) achieve $2,537+ monthly, often utilizing dynamic pricing and superior guest experiences.
- Strong performing properties (Top 25%) earn $1,430 or more, indicating effective management and desirable locations/amenities.
- Typical properties (Median) generate around $763 per month, representing the average market performance.
- Entry-level properties (Bottom 25%) see earnings around $441, often with potential for optimization.
Average Monthly Airbnb Earnings Trend in São Pedro de Alcântara
São Pedro de Alcântara Airbnb Occupancy Rate Trends (2026)
Maximize your bookings by understanding the São Pedro de Alcântara STR occupancy trends. Seasonal demand shifts significantly influence how often properties are booked. Typically, Februarysees the highest demand (peak season occupancy), while September experiences the lowest (low season). Effective strategies, like adjusting minimum stays or offering promotions, can boost occupancy during slower periods. Here's how different property tiers perform in São Pedro de Alcântara:
- Best-in-class properties (Top 10%) achieve 61%+ occupancy, indicating high desirability and potentially optimized availability.
- Strong performing properties (Top 25%) maintain 45% or higher occupancy, suggesting good market fit and guest satisfaction.
- Typical properties (Median) have an occupancy rate around 28%.
- Entry-level properties (Bottom 25%) average 17% occupancy, potentially facing higher vacancy.
Average Monthly Occupancy Rate Trend in São Pedro de Alcântara
Average Daily Rate (ADR) Airbnb Trends in São Pedro de Alcântara (2026)
Effective short term rental pricing strategy in São Pedro de Alcântara involves understanding monthly ADR fluctuations. The Average Daily Rate (ADR) for Airbnb in São Pedro de Alcântara typically peaks in December and dips lowest during February. Leveraging Airbnb dynamic pricing tools or strategies based on this seasonality can significantly boost revenue. Here's a look at the typical nightly rates achieved:
- Best-in-class properties (Top 10%) command rates of $201+ per night, often due to premium features or locations.
- Strong performing properties (Top 25%) achieve nightly rates of $158 or more.
- Typical properties (Median) charge around $107 per night.
- Entry-level properties (Bottom 25%) earn around $81 per night.
Average Daily Rate (ADR) Trend by Month in São Pedro de Alcântara
Get Live São Pedro de Alcântara Market Intelligence 👇
Explore Real-time Analytics
Airbnb Seasonality Analysis & Trends in São Pedro de Alcântara (2026)
Peak Season (July, January, November)
- Revenue averages $1,276 per month
- Occupancy rates average 36.0%
- Daily rates average $122
Shoulder Season
- Revenue averages $1,145 per month
- Occupancy maintains around 33.2%
- Daily rates hold near $119
Low Season (May, August, September)
- Revenue drops to average $916 per month
- Occupancy decreases to average 25.7%
- Daily rates adjust to average $119
Seasonality Insights for São Pedro de Alcântara
- The Airbnb seasonality in São Pedro de Alcântara shows moderate seasonality with distinct peak and low periods. While the sections above show seasonal averages, it's also insightful to look at the extremes:
- During the high season, the absolute peak month showcases São Pedro de Alcântara's highest earning potential, with monthly revenues capable of climbing to $1,294, occupancy reaching a high of 40.2%, and ADRs peaking at $128.
- Conversely, the slowest single month of the year, typically falling within the low season, marks the market's lowest point. In this month, revenue might dip to $843, occupancy could drop to 24.3%, and ADRs may adjust down to $114.
- Understanding both the seasonal averages and these monthly peaks and troughs in revenue, occupancy, and ADR is crucial for maximizing your Airbnb profit potential in São Pedro de Alcântara.
Seasonal Strategies for Maximizing Profit
- Peak Season: Maximize revenue through premium pricing and potentially longer minimum stays. Ensure high availability.
- Low Season: Offer competitive pricing, special promotions (e.g., extended stay discounts), and flexible cancellation policies. Target off-season travelers like remote workers or budget-conscious guests.
- Shoulder Seasons: Implement dynamic pricing that balances peak and low rates. Target weekend travelers or specific events. Offer slightly more flexible terms than peak season.
- Regularly analyze your own performance against these São Pedro de Alcântara seasonality benchmarks and adjust your pricing and availability strategy accordingly.
Best Areas for Airbnb Investment in São Pedro de Alcântara (2026)
Exploring the top neighborhoods for short-term rentals in São Pedro de Alcântara? This section highlights key areas, outlining why they are attractive for hosts and guests, along with notable local attractions. Consider these locations based on your target guest profile and investment strategy.
| Neighborhood / Area | Why Host Here? (Target Guests & Appeal) | Key Attractions & Landmarks |
|---|---|---|
| Centro Histórico | The historic center of São Pedro de Alcântara, known for its charming colonial architecture and cultural heritage. It attracts visitors interested in history, local cuisine, and scenic views. | São Pedro de Alcântara Church, Museu da Colonização, Mirante da Serra, Caminho da Serra, Parque Natural Estadual de São Pedro |
| Serra do Corvo Branco | A popular destination for nature lovers and adventure seekers. This area offers stunning landscapes, hiking opportunities, and is ideal for outdoor enthusiasts. | Corvo Branco Canyon, Hiking trails, Natural parks, Scenic viewpoints, Adventure sports |
| Praia do Rosa | A nearby beach destination recognized for its beautiful coastline, this area is popular for surfing and nature tourism, making it ideal for travelers seeking sun and surf. | Rosa Beach, Surfing spots, Lagoa de ibiraquera, Lush vegetation, Beachside restaurants |
| Pouso Redondo | A rustic area that appeals to those looking for a tranquil countryside experience, often featuring guesthouses and rural tourism. | Local farms, Countryside activities, Traditional cuisine, Natural beauty, Cultural festivals |
| Mirante do Morro da Antena | An impressive viewpoint that attracts visitors for its breathtaking panoramic views of the surrounding landscapes. Perfect for those seeking photography spots. | Morro da Antena viewpoint, Hiking trails, Sunset views, Nature excursions |
| Caminho da Luz | A spiritual and eco-tourism route that draws visitors seeking peace and relaxation while enjoying nature. Suitable for wellness tourism. | Meditation spots, Eco-friendly lodges, Natural trails, Cultural experiences, Spiritual retreats |
| Campo Alto | Known for its lush greenery and fresh air, offering opportunities for renting cabins and outdoor activities, especially for families and nature lovers. | Cabin rentals, Nature walks, Freshwater fishing, Barbecue areas, Nature observation |
| Baía de São Francisco | A picturesque bay area that combines beautiful coastline with leisure activities, attracting those who enjoy water sports and relaxation. | Water sports, Fishing, Leisure marinas, Beach cafés, Scenic boat tours |
Understanding Airbnb License Requirements & STR Laws in São Pedro de Alcântara (2026)
While São Pedro de Alcântara, Santa Catarina, Brazil currently shows low STR regulations, specific Airbnb license requirements might still exist or change. Always verify the latest short term rental regulations and Airbnb license requirements directly with local government authorities for São Pedro de Alcântara to ensure full compliance before hosting.
(Source: AirROI data, 2026, finding no licensed listings among those analyzed)
Top Performing Airbnb Properties in São Pedro de Alcântara (2026)
Benchmark your potential! Explore examples of top-performing Airbnb properties in São Pedro de Alcântarabased on Trailing Twelve Month (TTM) revenue. Analyze their characteristics, revenue, occupancy rate, and ADR to understand what drives success in this market.

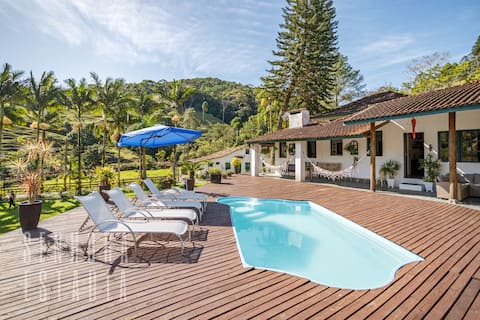
Dream cottage, entire space, heated pool, spa
Entire Place • 3 bedrooms
Alpen Ville Farmhouse with Unforgettable Pool
Entire Place • 5 bedrooms

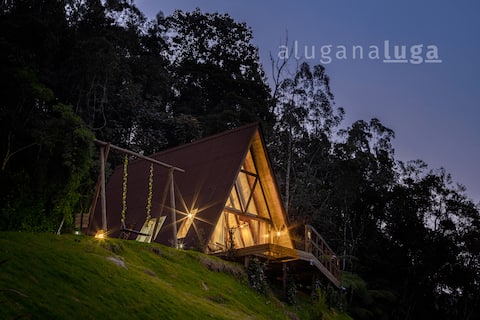
Chalet in nature in Greater Florianópolis
Entire Place • 1 bedroom
Chalé Alcântara - With Bathtub
Entire Place • 1 bedroom

Paris Chalet w/ Whirlpool
Entire Place • 1 bedroom

House in the mountains/Recanto dos Medeiros in SAI
Entire Place • 2 bedrooms
Note: Performance varies based on location, size, amenities, seasonality, and management quality. Data reflects the past 12 months.
Top Performing Airbnb Hosts in São Pedro de Alcântara (2026)
Learn from the best! This table showcases top-performing Airbnb hosts in São Pedro de Alcântara based on the number of properties managed and estimated total revenue over the past year. Analyze their scale and performance metrics.
| Host Name | Properties | Grossing Revenue | Stay Reviews | Avg Rating |
|---|---|---|---|---|
| Cleverton Dos Santos | 1 | $43,552 | 97 | 5.00/5.0 |
| Thaisa | 1 | $27,770 | 61 | 4.82/5.0 |
| Cris | 1 | $24,437 | 28 | 4.86/5.0 |
| Thaisa | 1 | $13,385 | 21 | 4.90/5.0 |
| Silte | 1 | $10,911 | 24 | 5.00/5.0 |
| Luciana | 1 | $9,585 | 86 | 4.98/5.0 |
| Refúgio Pedra Parada | 1 | $8,718 | 48 | 4.81/5.0 |
| Micheli | 1 | $8,506 | 52 | 4.98/5.0 |
| Andreza | 1 | $8,461 | 61 | 4.92/5.0 |
| Jessica | 1 | $5,960 | 4 | 5.00/5.0 |
Analyzing the strategies of top hosts, such as their property selection, pricing, and guest communication, can offer valuable lessons for optimizing your own Airbnb operations in São Pedro de Alcântara.
Dive Deeper: Advanced São Pedro de Alcântara STR Market Data (2026)
Ready to unlock more insights? AirROI provides access to advanced metrics and comprehensive Airbnb data for São Pedro de Alcântara. Explore detailed analytics beyond this report to refine your investment strategy, optimize pricing, and maximize your vacation rental profits.
Explore Advanced MetricsSão Pedro de Alcântara Short-Term Rental Market Composition (2026): Property & Room Types
Room Type Distribution
Property Type Distribution
Market Composition Insights for São Pedro de Alcântara
- The São Pedro de Alcântara Airbnb market composition is heavily skewed towards Entire Home/Apt listings, which make up 77.3% of the 22 active rentals. This indicates strong guest preference for privacy and space.
- Looking at the property type distribution in São Pedro de Alcântara, House properties are the most common (81.8%), reflecting the local real estate landscape.
- Houses represent a significant 81.8% portion, catering likely to families or larger groups.
- Smaller segments like hotel/boutique (combined 4.5%) offer potential for unique stay experiences.
São Pedro de Alcântara Airbnb Room Capacity Analysis (2026): Bedroom Distribution
Distribution of Listings by Number of Bedrooms
Room Capacity Insights for São Pedro de Alcântara
- The dominant room capacity in São Pedro de Alcântara is 1 bedroom listings, making up 27.3% of the market. This suggests a strong demand for properties suitable for couples or solo travelers.
- Together, 1 bedroom and 2 bedrooms properties represent 50.0% of the active Airbnb listings in São Pedro de Alcântara, indicating a high concentration in these sizes.
- A significant 36.3% of listings offer 3+ bedrooms, catering to larger groups and families seeking more space in São Pedro de Alcântara.
São Pedro de Alcântara Vacation Rental Guest Capacity Trends (2026)
Distribution of Listings by Guest Capacity
Guest Capacity Insights for São Pedro de Alcântara
- The most common guest capacity trend in São Pedro de Alcântara vacation rentals is listings accommodating 8+ guests (31.8%). This suggests the primary traveler segment is likely larger groups.
- Properties designed for 8+ guests and 4 guests dominate the São Pedro de Alcântara STR market, accounting for 50.0% of listings.
- 50.0% of properties accommodate 6+ guests, serving the market segment for larger families or group travel in São Pedro de Alcântara.
- On average, properties in São Pedro de Alcântara are equipped to host 4.7 guests.
São Pedro de Alcântara Airbnb Booking Patterns (2026): Available vs. Booked Days
Available Days Distribution
Booked Days Distribution
Booking Pattern Insights for São Pedro de Alcântara
- The most common availability pattern in São Pedro de Alcântara falls within the 271-366 days range, representing 68.2% of listings. This suggests many properties have significant open periods on their calendars.
- Approximately 95.5% of listings show high availability (181+ days open annually), indicating potential for increased bookings or specific owner usage patterns.
- For booked days, the 1-30 days range is most frequent in São Pedro de Alcântara (36.4%), reflecting common guest stay durations or potential owner blocking patterns.
- A notable 4.5% of properties secure long booking periods (181+ days booked per year), highlighting successful long-term rental strategies or significant owner usage.
São Pedro de Alcântara Airbnb Minimum Stay Requirements Analysis
Distribution of Listings by Minimum Night Requirement
1 Night
12 listings
54.5% of total
2 Nights
7 listings
31.8% of total
30+ Nights
3 listings
13.6% of total
Key Insights
- The most prevalent minimum stay requirement in São Pedro de Alcântara is 1 Night, adopted by 54.5% of listings. This highlights the market's preference for shorter, flexible bookings.
- A strong majority (86.3%) of the São Pedro de Alcântara Airbnb data shows acceptance of very short stays (1-2 nights), indicating a dynamic, high-turnover market.
- A significant segment (13.6%) caters to monthly stays (30+ nights) in São Pedro de Alcântara, pointing to opportunities in the extended-stay market.
Recommendations
- Align with the market by considering a 1 Night minimum stay, as 54.5% of São Pedro de Alcântara hosts use this setting.
- Explore offering discounts for stays of 30+ nights to attract the 13.6% of the market seeking extended stays.
- Adjust minimum nights based on seasonality – potentially shorter during low season and longer during peak demand periods in São Pedro de Alcântara.
São Pedro de Alcântara Airbnb Cancellation Policy Trends Analysis (2026)
Flexible
8 listings
36.4% of total
Moderate
6 listings
27.3% of total
Firm
6 listings
27.3% of total
Strict
2 listings
9.1% of total
Cancellation Policy Insights for São Pedro de Alcântara
- The prevailing Airbnb cancellation policy trend in São Pedro de Alcântara is Flexible, used by 36.4% of listings.
- There's a relatively balanced mix between guest-friendly (63.7%) and stricter (36.4%) policies, offering choices for different guest needs.
- Strict cancellation policies are quite rare (9.1%), potentially making listings with this policy less competitive unless justified by high demand or property type.
Recommendations for Hosts
- Consider adopting a Flexible policy to align with the 36.4% market standard in São Pedro de Alcântara.
- Using a Strict policy might deter some guests, as only 9.1% of listings use it. Evaluate if potential revenue protection outweighs possible lower booking rates.
- Regularly review your cancellation policy against competitors and market demand shifts in São Pedro de Alcântara.
São Pedro de Alcântara STR Booking Lead Time Analysis (2026)
Average Booking Lead Time by Month
Booking Lead Time Insights for São Pedro de Alcântara
- The overall average booking lead time for vacation rentals in São Pedro de Alcântara is 31 days.
- Guests book furthest in advance for stays during December (average 47 days), likely coinciding with peak travel demand or local events.
- The shortest booking windows occur for stays in March (average 17 days), indicating more last-minute travel plans during this time.
- Seasonally, Summer (44 days avg.) sees the longest lead times, while Spring (28 days avg.) has the shortest, reflecting typical travel planning cycles.
Recommendations for Hosts
- Use the overall average lead time (31 days) as a baseline for your pricing and availability strategy in São Pedro de Alcântara.
- For December stays, consider implementing length-of-stay discounts or slightly higher rates for bookings made less than 47 days out to capitalize on advance planning.
- Target marketing efforts for the Summer season well in advance (at least 44 days) to capture early planners.
- Monitor your own booking lead times against these São Pedro de Alcântara averages to identify opportunities for dynamic pricing adjustments.
Popular & Essential Airbnb Amenities in São Pedro de Alcântara (2026)
Amenity Prevalence
Amenity Insights for São Pedro de Alcântara
- Essential amenities in São Pedro de Alcântara that guests expect include: Kitchen. Lacking these (this) could significantly impact bookings.
- Popular amenities like Wifi, TV, Dishes and silverware are common but not universal. Offering these can provide a competitive edge.
- Warning: Wifi is not universally provided but is considered essential globally. Ensure reliable Wifi is offered.
Recommendations for Hosts
- Ensure your listing includes all essential amenities for São Pedro de Alcântara: Kitchen.
- Prioritize adding missing essentials: Kitchen.
- Consider adding popular differentiators like Wifi or TV to increase appeal.
- Highlight unique or less common amenities you offer (e.g., hot tub, dedicated workspace, EV charger) in your listing description and photos.
- Regularly check competitor amenities in São Pedro de Alcântara to stay competitive.
São Pedro de Alcântara Airbnb Guest Demographics & Profile Analysis (2026)
Guest Profile Summary for São Pedro de Alcântara
- The typical guest profile for Airbnb in São Pedro de Alcântara consists of primarily domestic travelers (98%), often arriving from nearby Florianópolis, typically belonging to the Post-2000s (Gen Z/Alpha) group (50%), primarily speaking Portuguese or English.
- Domestic travelers account for 97.8% of guests.
- Key international markets include Brazil (97.8%) and United States (1.1%).
- Top languages spoken are Portuguese (56.9%) followed by English (23.5%).
- A significant demographic segment is the Post-2000s (Gen Z/Alpha) group, representing 50% of guests.
Recommendations for Hosts
- Target domestic marketing efforts towards travelers from Florianópolis and Santa Catarina.
- Tailor amenities and listing descriptions to appeal to the dominant Post-2000s (Gen Z/Alpha) demographic (e.g., highlight fast WiFi, smart home features, local guides).
- Highlight unique local experiences or amenities relevant to the primary guest profile.
- Consider seasonal promotions aligned with peak travel times for key origin markets.
Nearby Short-Term Rental Market Comparison
How does the São Pedro de Alcântara Airbnb market stack up against its neighbors? Compare key performance metrics like average monthly revenue, ADR, and occupancy rates in surrounding areas to understand the broader regional STR landscape.
| Market | Active Properties | Monthly Revenue | Daily Rate | Avg. Occupancy |
|---|---|---|---|---|
| Rancho Queimado | 177 | $1,169 | $156.09 | 28% |
| Angelina | 25 | $1,022 | $113.19 | 27% |
| Rio dos Cedros | 147 | $993 | $142.58 | 27% |
| Alfredo Wagner | 183 | $946 | $127.37 | 25% |
| Balneário Camboriú | 4,575 | $867 | $116.75 | 36% |
| Massaranduba | 11 | $844 | $86.77 | 36% |
| Anitápolis | 72 | $828 | $90.20 | 33% |
| Região Geográfica Imediata de Lages | 63 | $807 | $130.68 | 26% |
| Canelinha | 12 | $803 | $163.57 | 24% |
| Região Geográfica Imediata de Florianópolis | 21 | $774 | $120.71 | 22% |