Orleans Airbnb Market Analysis 2026: Short Term Rental Data & Vacation Rental Statistics in Santa Catarina, Brazil
Is Airbnb profitable in Orleans in 2026? Explore comprehensive Airbnb analytics for Orleans, Santa Catarina, Brazil to uncover income potential. This 2026 STR market report for Orleans, based on AirROI data from February 2025 to January 2026, reveals key trends in the niche market of 46 active listings.
Whether you're considering an Airbnb investment in Orleans, optimizing your existing vacation rental, or exploring rental arbitrage opportunities, understanding the Orleans Airbnb data is crucial. Leveraging the low regulation environment is key to maximizing your short term rental income potential. Let's dive into the specifics.
Key Orleans Airbnb Performance Metrics Overview
Monthly Airbnb Revenue Variations & Income Potential in Orleans (2026)
Understanding the monthly revenue variations for Airbnb listings in Orleans is key to maximizing your short term rental income potential. Seasonality significantly impacts earnings. Our analysis, based on data from the past 12 months, shows that the peak revenue month for STRs in Orleans is typically July, while October often presents the lowest earnings, highlighting opportunities for strategic pricing adjustments during shoulder and low seasons. Explore the typical Airbnb income in Orleans across different performance tiers:
- Best-in-class properties (Top 10%) achieve $2,295+ monthly, often utilizing dynamic pricing and superior guest experiences.
- Strong performing properties (Top 25%) earn $1,322 or more, indicating effective management and desirable locations/amenities.
- Typical properties (Median) generate around $549 per month, representing the average market performance.
- Entry-level properties (Bottom 25%) see earnings around $225, often with potential for optimization.
Average Monthly Airbnb Earnings Trend in Orleans
Orleans Airbnb Occupancy Rate Trends (2026)
Maximize your bookings by understanding the Orleans STR occupancy trends. Seasonal demand shifts significantly influence how often properties are booked. Typically, Februarysees the highest demand (peak season occupancy), while October experiences the lowest (low season). Effective strategies, like adjusting minimum stays or offering promotions, can boost occupancy during slower periods. Here's how different property tiers perform in Orleans:
- Best-in-class properties (Top 10%) achieve 73%+ occupancy, indicating high desirability and potentially optimized availability.
- Strong performing properties (Top 25%) maintain 52% or higher occupancy, suggesting good market fit and guest satisfaction.
- Typical properties (Median) have an occupancy rate around 27%.
- Entry-level properties (Bottom 25%) average 12% occupancy, potentially facing higher vacancy.
Average Monthly Occupancy Rate Trend in Orleans
Average Daily Rate (ADR) Airbnb Trends in Orleans (2026)
Effective short term rental pricing strategy in Orleans involves understanding monthly ADR fluctuations. The Average Daily Rate (ADR) for Airbnb in Orleans typically peaks in December and dips lowest during April. Leveraging Airbnb dynamic pricing tools or strategies based on this seasonality can significantly boost revenue. Here's a look at the typical nightly rates achieved:
- Best-in-class properties (Top 10%) command rates of $128+ per night, often due to premium features or locations.
- Strong performing properties (Top 25%) achieve nightly rates of $90 or more.
- Typical properties (Median) charge around $70 per night.
- Entry-level properties (Bottom 25%) earn around $50 per night.
Average Daily Rate (ADR) Trend by Month in Orleans
Get Live Orleans Market Intelligence 👇

Explore Real-time Analytics
Airbnb Seasonality Analysis & Trends in Orleans (2026)
Peak Season (July, December, August)
- Revenue averages $1,045 per month
- Occupancy rates average 36.7%
- Daily rates average $75
Shoulder Season
- Revenue averages $907 per month
- Occupancy maintains around 35.7%
- Daily rates hold near $73
Low Season (April, May, October)
- Revenue drops to average $728 per month
- Occupancy decreases to average 30.0%
- Daily rates adjust to average $72
Seasonality Insights for Orleans
- The Airbnb seasonality in Orleans shows moderate seasonality with distinct peak and low periods. While the sections above show seasonal averages, it's also insightful to look at the extremes:
- During the high season, the absolute peak month showcases Orleans's highest earning potential, with monthly revenues capable of climbing to $1,114, occupancy reaching a high of 41.9%, and ADRs peaking at $80.
- Conversely, the slowest single month of the year, typically falling within the low season, marks the market's lowest point. In this month, revenue might dip to $692, occupancy could drop to 25.8%, and ADRs may adjust down to $68.
- Understanding both the seasonal averages and these monthly peaks and troughs in revenue, occupancy, and ADR is crucial for maximizing your Airbnb profit potential in Orleans.
Seasonal Strategies for Maximizing Profit
- Peak Season: Maximize revenue through premium pricing and potentially longer minimum stays. Ensure high availability.
- Low Season: Offer competitive pricing, special promotions (e.g., extended stay discounts), and flexible cancellation policies. Target off-season travelers like remote workers or budget-conscious guests.
- Shoulder Seasons: Implement dynamic pricing that balances peak and low rates. Target weekend travelers or specific events. Offer slightly more flexible terms than peak season.
- Regularly analyze your own performance against these Orleans seasonality benchmarks and adjust your pricing and availability strategy accordingly.
Best Areas for Airbnb Investment in Orleans (2026)
Exploring the top neighborhoods for short-term rentals in Orleans? This section highlights key areas, outlining why they are attractive for hosts and guests, along with notable local attractions. Consider these locations based on your target guest profile and investment strategy.
| Neighborhood / Area | Why Host Here? (Target Guests & Appeal) | Key Attractions & Landmarks |
|---|---|---|
| Centro | The heart of Orleans, where visitors can explore local shops, restaurants, and cultural sites. It's an ideal spot for tourists who want to experience local life and the charm of small-town Brazil. | Orleans Historical Museum, Praça 25 de Julho, Catedral São José, Local artisan shops, Café do Mercado |
| Serra do Rio do Rastro | A breathtaking natural area known for its stunning views and winding roads. Ideal for nature lovers and outdoor enthusiasts who enjoy hiking and scenic drives. | Serra do Rio do Rastro viewpoint, Hiking trails, Waterfalls, Nature parks |
| Morro da Igreja | The highest point in Santa Catarina with amazing panoramic views. Popular for its cool climate and as a destination for those who love cooler weather and nature activities. | Morro da Igreja viewpoint, Trekking paths, Farol de Santa Marta, National Park of São Joaquim |
| Praia do Rosa | Known for its beautiful beach and vibrant atmosphere, attracting surfers, sunbathers, and families. A great destination for those looking to relax by the sea. | Praia do Rosa beach, Surfing spots, Beach bars and restaurants, Nature trails |
| Gravatal | Famous for its thermal waters, this area attracts visitors looking to unwind in spas and wellness centers, making it appealing for a relaxing retreat. | Thermal resorts, Spa services, Gravatal's sculptures, Nature parks |
| Urubici | A charming town nestled in the mountains, great for ecotourism and adventure sports. It's a perfect spot for visitors seeking a quiet escape into nature. | Cascata do Avencal, Brock Garden, Hiking trails, Canyon do Funil |
| Laguna | A coastal city known for its beautiful beaches and historical significance. Attracts visitors for both relaxation and cultural experiences. | Praia do Mar Grosso, Historical sites, Laguna's lighthouse, Cultural festivals |
| São Joaquim | Famous for its vineyards and cooler climate, it's becoming increasingly popular for those seeking wine tourism and winter sports. | Vineyards, Snow activities in winter, São Joaquim National Park, Local cuisine |
Understanding Airbnb License Requirements & STR Laws in Orleans (2026)
While Orleans, Santa Catarina, Brazil currently shows low STR regulations, specific Airbnb license requirements might still exist or change. Always verify the latest short term rental regulations and Airbnb license requirements directly with local government authorities for Orleans to ensure full compliance before hosting.
(Source: AirROI data, 2026, finding no licensed listings among those analyzed)
Top Performing Airbnb Properties in Orleans (2026)
Benchmark your potential! Explore examples of top-performing Airbnb properties in Orleansbased on Trailing Twelve Month (TTM) revenue. Analyze their characteristics, revenue, occupancy rate, and ADR to understand what drives success in this market.
Vale Três Barras Encosta da Serra
Entire Place • 4 bedrooms

Refúgio Paraíso| Casa Stellato| Panoramic Spa
Entire Place • 1 bedroom
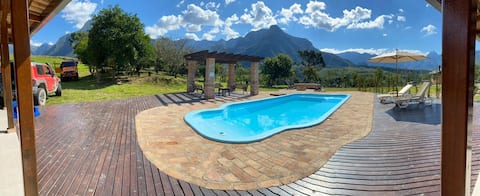
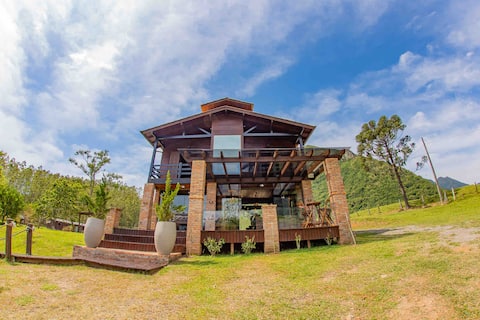
Casa Primavera: swimming pool, Wi-Fi, view and comfort
Entire Place • 4 bedrooms

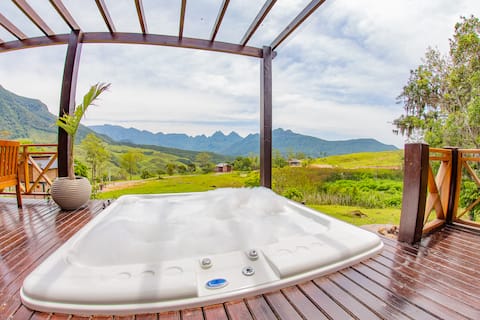
Camellia Cabin Jacuzzi overlooking mountains
Entire Place • 2 bedrooms

Refúgio Paraíso | Casa Splendore - Panoramic Spa
Entire Place • 1 bedroom
Cabana Palmeira with Jacuzzi - Encosta da Serra
Entire Place • 2 bedrooms
Note: Performance varies based on location, size, amenities, seasonality, and management quality. Data reflects the past 12 months.
Top Performing Airbnb Hosts in Orleans (2026)
Learn from the best! This table showcases top-performing Airbnb hosts in Orleans based on the number of properties managed and estimated total revenue over the past year. Analyze their scale and performance metrics.
| Host Name | Properties | Grossing Revenue | Stay Reviews | Avg Rating |
|---|---|---|---|---|
| Natalia Dorigon | 4 | $99,315 | 494 | 4.98/5.0 |
| Dieni | 2 | $60,553 | 245 | 4.91/5.0 |
| Camila Nava | 1 | $37,972 | 118 | 4.92/5.0 |
| Hospedagem Rural | 3 | $24,966 | 258 | 4.90/5.0 |
| Klaus | 2 | $18,578 | 336 | 4.92/5.0 |
| Chalés Recanto Do Vale | 2 | $13,280 | 35 | 4.86/5.0 |
| Rafael | 2 | $10,739 | 50 | 4.91/5.0 |
| Helio | 1 | $9,261 | 115 | 5.00/5.0 |
| Neli | 3 | $8,670 | 284 | 4.69/5.0 |
| Willian | 1 | $8,661 | 37 | 4.86/5.0 |
Analyzing the strategies of top hosts, such as their property selection, pricing, and guest communication, can offer valuable lessons for optimizing your own Airbnb operations in Orleans.
Dive Deeper: Advanced Orleans STR Market Data (2026)
Ready to unlock more insights? AirROI provides access to advanced metrics and comprehensive Airbnb data for Orleans. Explore detailed analytics beyond this report to refine your investment strategy, optimize pricing, and maximize your vacation rental profits.
Explore Advanced MetricsOrleans Short-Term Rental Market Composition (2026): Property & Room Types
Room Type Distribution
Property Type Distribution
Market Composition Insights for Orleans
- The Orleans Airbnb market composition is heavily skewed towards Entire Home/Apt listings, which make up 82.6% of the 46 active rentals. This indicates strong guest preference for privacy and space.
- Looking at the property type distribution in Orleans, House properties are the most common (50%), reflecting the local real estate landscape.
- Houses represent a significant 50% portion, catering likely to families or larger groups.
- The presence of 8.7% Hotel/Boutique listings indicates integration with traditional hospitality.
Orleans Airbnb Room Capacity Analysis (2026): Bedroom Distribution
Distribution of Listings by Number of Bedrooms
Room Capacity Insights for Orleans
- The dominant room capacity in Orleans is 1 bedroom listings, making up 34.8% of the market. This suggests a strong demand for properties suitable for couples or solo travelers.
- Together, 1 bedroom and 2 bedrooms properties represent 65.2% of the active Airbnb listings in Orleans, indicating a high concentration in these sizes.
- A significant 21.8% of listings offer 3+ bedrooms, catering to larger groups and families seeking more space in Orleans.
Orleans Vacation Rental Guest Capacity Trends (2026)
Distribution of Listings by Guest Capacity
Guest Capacity Insights for Orleans
- The most common guest capacity trend in Orleans vacation rentals is listings accommodating 4 guests (26.1%). This suggests the primary traveler segment is likely small families or groups.
- Properties designed for 4 guests and 8+ guests dominate the Orleans STR market, accounting for 50.0% of listings.
- 41.2% of properties accommodate 6+ guests, serving the market segment for larger families or group travel in Orleans.
- On average, properties in Orleans are equipped to host 4.6 guests.
Orleans Airbnb Booking Patterns (2026): Available vs. Booked Days
Available Days Distribution
Booked Days Distribution
Booking Pattern Insights for Orleans
- The most common availability pattern in Orleans falls within the 271-366 days range, representing 67.4% of listings. This suggests many properties have significant open periods on their calendars.
- Approximately 82.6% of listings show high availability (181+ days open annually), indicating potential for increased bookings or specific owner usage patterns.
- For booked days, the 31-90 days range is most frequent in Orleans (34.8%), reflecting common guest stay durations or potential owner blocking patterns.
- A notable 17.4% of properties secure long booking periods (181+ days booked per year), highlighting successful long-term rental strategies or significant owner usage.
Orleans Airbnb Minimum Stay Requirements Analysis
Distribution of Listings by Minimum Night Requirement
1 Night
22 listings
47.8% of total
2 Nights
11 listings
23.9% of total
30+ Nights
13 listings
28.3% of total
Key Insights
- The most prevalent minimum stay requirement in Orleans is 1 Night, adopted by 47.8% of listings. This highlights the market's preference for shorter, flexible bookings.
- A strong majority (71.7%) of the Orleans Airbnb data shows acceptance of very short stays (1-2 nights), indicating a dynamic, high-turnover market.
- A significant segment (28.3%) caters to monthly stays (30+ nights) in Orleans, pointing to opportunities in the extended-stay market.
Recommendations
- Align with the market by considering a 1 Night minimum stay, as 47.8% of Orleans hosts use this setting.
- Explore offering discounts for stays of 30+ nights to attract the 28.3% of the market seeking extended stays.
- Adjust minimum nights based on seasonality – potentially shorter during low season and longer during peak demand periods in Orleans.
Orleans Airbnb Cancellation Policy Trends Analysis (2026)
Refundable
1 listings
2.2% of total
Flexible
14 listings
30.4% of total
Moderate
16 listings
34.8% of total
Firm
11 listings
23.9% of total
Strict
4 listings
8.7% of total
Cancellation Policy Insights for Orleans
- The prevailing Airbnb cancellation policy trend in Orleans is Moderate, used by 34.8% of listings.
- There's a relatively balanced mix between guest-friendly (65.2%) and stricter (32.6%) policies, offering choices for different guest needs.
- Strict cancellation policies are quite rare (8.7%), potentially making listings with this policy less competitive unless justified by high demand or property type.
Recommendations for Hosts
- Consider adopting a Moderate policy to align with the 34.8% market standard in Orleans.
- Using a Strict policy might deter some guests, as only 8.7% of listings use it. Evaluate if potential revenue protection outweighs possible lower booking rates.
- Regularly review your cancellation policy against competitors and market demand shifts in Orleans.
Orleans STR Booking Lead Time Analysis (2026)
Average Booking Lead Time by Month
Booking Lead Time Insights for Orleans
- The overall average booking lead time for vacation rentals in Orleans is 38 days.
- Guests book furthest in advance for stays during May (average 58 days), likely coinciding with peak travel demand or local events.
- The shortest booking windows occur for stays in February (average 25 days), indicating more last-minute travel plans during this time.
- Seasonally, Spring (42 days avg.) sees the longest lead times, while Fall (33 days avg.) has the shortest, reflecting typical travel planning cycles.
Recommendations for Hosts
- Use the overall average lead time (38 days) as a baseline for your pricing and availability strategy in Orleans.
- For May stays, consider implementing length-of-stay discounts or slightly higher rates for bookings made less than 58 days out to capitalize on advance planning.
- Target marketing efforts for the Spring season well in advance (at least 42 days) to capture early planners.
- Monitor your own booking lead times against these Orleans averages to identify opportunities for dynamic pricing adjustments.
Popular & Essential Airbnb Amenities in Orleans (2026)
Amenity Prevalence
Amenity Insights for Orleans
- Essential amenities in Orleans that guests expect include: Wifi, Kitchen. Lacking these (any) could significantly impact bookings.
- Popular amenities like Pets allowed, TV, Refrigerator are common but not universal. Offering these can provide a competitive edge.
Recommendations for Hosts
- Ensure your listing includes all essential amenities for Orleans: Wifi, Kitchen.
- Prioritize adding missing essentials: Wifi, Kitchen.
- Consider adding popular differentiators like Pets allowed or TV to increase appeal.
- Highlight unique or less common amenities you offer (e.g., hot tub, dedicated workspace, EV charger) in your listing description and photos.
- Regularly check competitor amenities in Orleans to stay competitive.
Orleans Airbnb Guest Demographics & Profile Analysis (2026)
Guest Profile Summary for Orleans
- The typical guest profile for Airbnb in Orleans consists of primarily domestic travelers (97%), often arriving from nearby Florianópolis, typically belonging to the Post-2000s (Gen Z/Alpha) group (50%), primarily speaking Portuguese or English.
- Domestic travelers account for 96.5% of guests.
- Key international markets include Brazil (96.5%) and Santa Catarina (0.8%).
- Top languages spoken are Portuguese (51.5%) followed by English (30.4%).
- A significant demographic segment is the Post-2000s (Gen Z/Alpha) group, representing 50% of guests.
Recommendations for Hosts
- Target domestic marketing efforts towards travelers from Florianópolis and Santa Catarina.
- Tailor amenities and listing descriptions to appeal to the dominant Post-2000s (Gen Z/Alpha) demographic (e.g., highlight fast WiFi, smart home features, local guides).
- Highlight unique local experiences or amenities relevant to the primary guest profile.
- Consider seasonal promotions aligned with peak travel times for key origin markets.
Nearby Short-Term Rental Market Comparison
How does the Orleans Airbnb market stack up against its neighbors? Compare key performance metrics like average monthly revenue, ADR, and occupancy rates in surrounding areas to understand the broader regional STR landscape.
| Market | Active Properties | Monthly Revenue | Daily Rate | Avg. Occupancy |
|---|---|---|---|---|
| Rancho Queimado | 177 | $1,169 | $156.09 | 28% |
| Angelina | 25 | $1,022 | $113.19 | 27% |
| Alfredo Wagner | 183 | $946 | $127.37 | 25% |
| Anitápolis | 72 | $828 | $90.20 | 33% |
| Região Geográfica Imediata de Lages | 63 | $807 | $130.68 | 26% |
| Canelinha | 12 | $803 | $163.57 | 24% |
| Gramado | 3,177 | $778 | $93.36 | 36% |
| Região Geográfica Imediata de Florianópolis | 21 | $774 | $120.71 | 22% |
| Santo Amaro da Imperatriz | 88 | $772 | $114.43 | 28% |
| Antônio Carlos | 38 | $769 | $115.39 | 26% |