Camboriú Airbnb Market Analysis 2026: Short Term Rental Data & Vacation Rental Statistics in Santa Catarina, Brazil
Is Airbnb profitable in Camboriú in 2026? Explore comprehensive Airbnb analytics for Camboriú, Santa Catarina, Brazil to uncover income potential. This 2026 STR market report for Camboriú, based on AirROI data from February 2025 to January 2026, reveals key trends in the market of 201 active listings.
Whether you're considering an Airbnb investment in Camboriú, optimizing your existing vacation rental, or exploring rental arbitrage opportunities, understanding the Camboriú Airbnb data is crucial. Leveraging the low regulation environment is key to maximizing your short term rental income potential. Let's dive into the specifics.
Key Camboriú Airbnb Performance Metrics Overview
Monthly Airbnb Revenue Variations & Income Potential in Camboriú (2026)
Understanding the monthly revenue variations for Airbnb listings in Camboriú is key to maximizing your short term rental income potential. Seasonality significantly impacts earnings. Our analysis, based on data from the past 12 months, shows that the peak revenue month for STRs in Camboriú is typically January, while April often presents the lowest earnings, highlighting opportunities for strategic pricing adjustments during shoulder and low seasons. Explore the typical Airbnb income in Camboriú across different performance tiers:
- Best-in-class properties (Top 10%) achieve $1,404+ monthly, often utilizing dynamic pricing and superior guest experiences.
- Strong performing properties (Top 25%) earn $791 or more, indicating effective management and desirable locations/amenities.
- Typical properties (Median) generate around $364 per month, representing the average market performance.
- Entry-level properties (Bottom 25%) see earnings around $164, often with potential for optimization.
Average Monthly Airbnb Earnings Trend in Camboriú
Camboriú Airbnb Occupancy Rate Trends (2026)
Maximize your bookings by understanding the Camboriú STR occupancy trends. Seasonal demand shifts significantly influence how often properties are booked. Typically, Februarysees the highest demand (peak season occupancy), while September experiences the lowest (low season). Effective strategies, like adjusting minimum stays or offering promotions, can boost occupancy during slower periods. Here's how different property tiers perform in Camboriú:
- Best-in-class properties (Top 10%) achieve 65%+ occupancy, indicating high desirability and potentially optimized availability.
- Strong performing properties (Top 25%) maintain 42% or higher occupancy, suggesting good market fit and guest satisfaction.
- Typical properties (Median) have an occupancy rate around 21%.
- Entry-level properties (Bottom 25%) average 10% occupancy, potentially facing higher vacancy.
Average Monthly Occupancy Rate Trend in Camboriú
Average Daily Rate (ADR) Airbnb Trends in Camboriú (2026)
Effective short term rental pricing strategy in Camboriú involves understanding monthly ADR fluctuations. The Average Daily Rate (ADR) for Airbnb in Camboriú typically peaks in January and dips lowest during April. Leveraging Airbnb dynamic pricing tools or strategies based on this seasonality can significantly boost revenue. Here's a look at the typical nightly rates achieved:
- Best-in-class properties (Top 10%) command rates of $147+ per night, often due to premium features or locations.
- Strong performing properties (Top 25%) achieve nightly rates of $93 or more.
- Typical properties (Median) charge around $59 per night.
- Entry-level properties (Bottom 25%) earn around $41 per night.
Average Daily Rate (ADR) Trend by Month in Camboriú
Get Live Camboriú Market Intelligence 👇

Explore Real-time Analytics
Airbnb Seasonality Analysis & Trends in Camboriú (2026)
Peak Season (January, December, February)
- Revenue averages $809 per month
- Occupancy rates average 33.3%
- Daily rates average $84
Shoulder Season
- Revenue averages $599 per month
- Occupancy maintains around 28.2%
- Daily rates hold near $76
Low Season (April, May, June)
- Revenue drops to average $493 per month
- Occupancy decreases to average 24.7%
- Daily rates adjust to average $71
Seasonality Insights for Camboriú
- The Airbnb seasonality in Camboriú shows moderate seasonality with distinct peak and low periods. While the sections above show seasonal averages, it's also insightful to look at the extremes:
- During the high season, the absolute peak month showcases Camboriú's highest earning potential, with monthly revenues capable of climbing to $860, occupancy reaching a high of 39.4%, and ADRs peaking at $91.
- Conversely, the slowest single month of the year, typically falling within the low season, marks the market's lowest point. In this month, revenue might dip to $442, occupancy could drop to 22.5%, and ADRs may adjust down to $68.
- Understanding both the seasonal averages and these monthly peaks and troughs in revenue, occupancy, and ADR is crucial for maximizing your Airbnb profit potential in Camboriú.
Seasonal Strategies for Maximizing Profit
- Peak Season: Maximize revenue through premium pricing and potentially longer minimum stays. Ensure high availability.
- Low Season: Offer competitive pricing, special promotions (e.g., extended stay discounts), and flexible cancellation policies. Target off-season travelers like remote workers or budget-conscious guests.
- Shoulder Seasons: Implement dynamic pricing that balances peak and low rates. Target weekend travelers or specific events. Offer slightly more flexible terms than peak season.
- Regularly analyze your own performance against these Camboriú seasonality benchmarks and adjust your pricing and availability strategy accordingly.
Best Areas for Airbnb Investment in Camboriú (2026)
Exploring the top neighborhoods for short-term rentals in Camboriú? This section highlights key areas, outlining why they are attractive for hosts and guests, along with notable local attractions. Consider these locations based on your target guest profile and investment strategy.
| Neighborhood / Area | Why Host Here? (Target Guests & Appeal) | Key Attractions & Landmarks |
|---|---|---|
| Praia Central | The most popular beach in Balneário Camboriú, known for its vibrant atmosphere, beach bars, restaurants, and water activities. A prime location for tourists seeking sun, sand, and entertainment throughout the year. | Central Beach, MC Beach Club, Shopping Balneário Camboriú, Parque Unipraias, Amores Beach |
| Praia dos Amores | This beautiful beach offers a more tranquil environment with stunning views, attracting families and couples looking for a relaxing getaway while still being close to the main attractions of the city. | Amores Beach, Rooftop bars, Nature trails, Water sports, Cozy restaurants |
| Barra Sul | An area known for its stunning waterfront and upscale developments. It features luxurious apartments and is close to the cable car that connects to the Unipraias Park, making it attractive to both families and thrill-seekers. | Cable Car to Unipraias Park, Barra Sul Boardwalk, Shopping ATL., Beachfront restaurants |
| Praia Brava | Famous for its beautiful landscapes and strong waves, attracting surfers and young individuals looking for a lively beach experience. This area is ideal for those wanting to escape the busyness of central Camboriú. | Surfing Spots, Beautiful Cliffs, Beachfront bars, Vibrant nightlife |
| Bairro dos Estados | A quieter residential area that still offers easy access to the beach and shopping. It's perfect for families and longer stays, providing a more local experience in Camboriú. | Grocery stores, Parks, Family-friendly cafes, Local shops |
| Centro | The city center offers a mix of shopping, dining, and cultural experiences. It's ideal for tourists who want everything in close proximity and access to public transport. | Municipal Market, Shopping Centers, Cultural Exhibitions, Local Restaurants |
| Balneário Camboriú North | A rapidly developing area with various new constructions and properties for investment. Combines beautiful beach views with a quieter and upscale living environment. | Scenic viewpoints, Fine dining options, New shopping venues |
| Unipraias Park | An eco-tourism park that connects different beaches and offers various activities, making it a hotspot for adventure and nature lovers, perfect for Airbnb experiences. | Cable car, Hiking trails, Adventure activities, Ecological park |
Understanding Airbnb License Requirements & STR Laws in Camboriú (2026)
While Camboriú, Santa Catarina, Brazil currently shows low STR regulations, specific Airbnb license requirements might still exist or change. Always verify the latest short term rental regulations and Airbnb license requirements directly with local government authorities for Camboriú to ensure full compliance before hosting.
(Source: AirROI data, 2026, based on 0% licensed listings)
Top Performing Airbnb Properties in Camboriú (2026)
Benchmark your potential! Explore examples of top-performing Airbnb properties in Camboriúbased on Trailing Twelve Month (TTM) revenue. Analyze their characteristics, revenue, occupancy rate, and ADR to understand what drives success in this market.
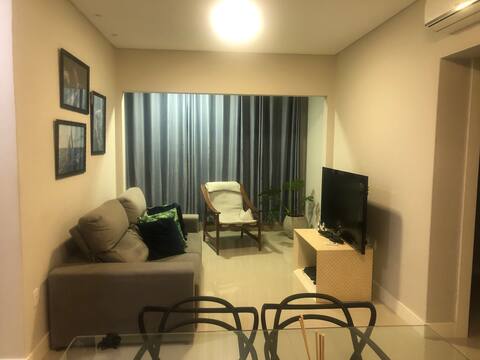
Apartment with barbecue and private garage
Entire Place • 1 bedroom

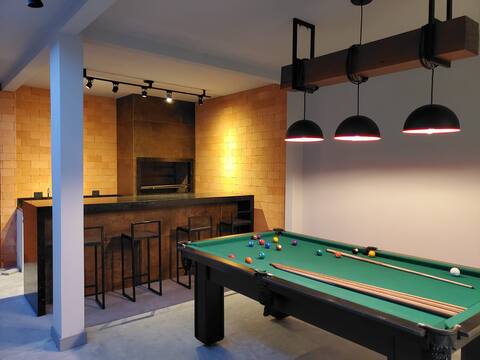
CASA SOL with a swimming pool and whirlpool tub
Entire Place • 1 bedroom
house 19
Entire Place • 2 bedrooms
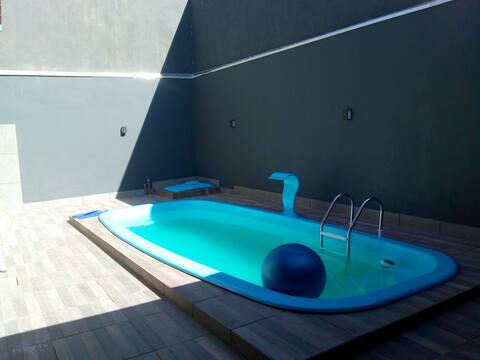
House with a swimming pool vacation in Balneário Camboriú
Entire Place • 3 bedrooms
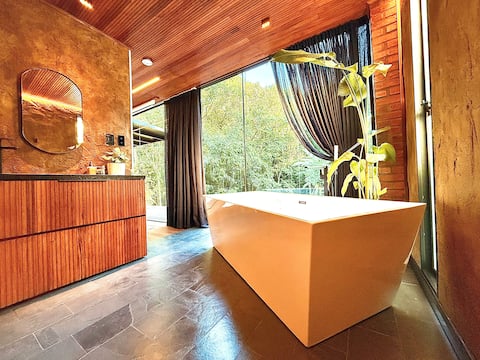
Figueira Cabin
Entire Place • 1 bedroom
Apartment 2 km from the beach with en-suite, garage and elevator
Entire Place • 2 bedrooms
Note: Performance varies based on location, size, amenities, seasonality, and management quality. Data reflects the past 12 months.
Top Performing Airbnb Hosts in Camboriú (2026)
Learn from the best! This table showcases top-performing Airbnb hosts in Camboriú based on the number of properties managed and estimated total revenue over the past year. Analyze their scale and performance metrics.
| Host Name | Properties | Grossing Revenue | Stay Reviews | Avg Rating |
|---|---|---|---|---|
| Sander | 1 | $70,994 | 108 | 4.95/5.0 |
| Sabrina | 1 | $23,347 | 24 | 4.92/5.0 |
| João Miguel | 1 | $19,954 | 74 | 4.96/5.0 |
| Renato | 1 | $19,596 | 50 | 5.00/5.0 |
| Natanael | 1 | $18,272 | 71 | 4.97/5.0 |
| Janaína Fatima | 1 | $14,394 | 74 | 4.92/5.0 |
| Priscila | 1 | $13,283 | 147 | 4.94/5.0 |
| Camila | 1 | $13,044 | 55 | 4.71/5.0 |
| Fernanda | 1 | $12,892 | 123 | 4.82/5.0 |
| Stone | 1 | $12,433 | 70 | 4.76/5.0 |
Analyzing the strategies of top hosts, such as their property selection, pricing, and guest communication, can offer valuable lessons for optimizing your own Airbnb operations in Camboriú.
Dive Deeper: Advanced Camboriú STR Market Data (2026)
Ready to unlock more insights? AirROI provides access to advanced metrics and comprehensive Airbnb data for Camboriú. Explore detailed analytics beyond this report to refine your investment strategy, optimize pricing, and maximize your vacation rental profits.
Explore Advanced MetricsCamboriú Short-Term Rental Market Composition (2026): Property & Room Types
Room Type Distribution
Property Type Distribution
Market Composition Insights for Camboriú
- The Camboriú Airbnb market composition is heavily skewed towards Entire Home/Apt listings, which make up 86.1% of the 201 active rentals. This indicates strong guest preference for privacy and space.
- Looking at the property type distribution in Camboriú, Apartment/Condo properties are the most common (55.7%), reflecting the local real estate landscape.
- Houses represent a significant 38.3% portion, catering likely to families or larger groups.
- Smaller segments like outdoor/unique, hotel/boutique, unique stays, others (combined 6.0%) offer potential for unique stay experiences.
Camboriú Airbnb Room Capacity Analysis (2026): Bedroom Distribution
Distribution of Listings by Number of Bedrooms
Room Capacity Insights for Camboriú
- The dominant room capacity in Camboriú is 2 bedrooms listings, making up 46.3% of the market. This suggests a strong demand for properties suitable for couples or solo travelers.
- Together, 2 bedrooms and 1 bedroom properties represent 73.2% of the active Airbnb listings in Camboriú, indicating a high concentration in these sizes.
Camboriú Vacation Rental Guest Capacity Trends (2026)
Distribution of Listings by Guest Capacity
Guest Capacity Insights for Camboriú
- The most common guest capacity trend in Camboriú vacation rentals is listings accommodating 4 guests (25.9%). This suggests the primary traveler segment is likely small families or groups.
- Properties designed for 4 guests and 6 guests dominate the Camboriú STR market, accounting for 40.8% of listings.
- 28.3% of properties accommodate 6+ guests, serving the market segment for larger families or group travel in Camboriú.
- On average, properties in Camboriú are equipped to host 4.1 guests.
Camboriú Airbnb Booking Patterns (2026): Available vs. Booked Days
Available Days Distribution
Booked Days Distribution
Booking Pattern Insights for Camboriú
- The most common availability pattern in Camboriú falls within the 271-366 days range, representing 80.1% of listings. This suggests many properties have significant open periods on their calendars.
- Approximately 95.5% of listings show high availability (181+ days open annually), indicating potential for increased bookings or specific owner usage patterns.
- For booked days, the 1-30 days range is most frequent in Camboriú (42.3%), reflecting common guest stay durations or potential owner blocking patterns.
- A notable 5.0% of properties secure long booking periods (181+ days booked per year), highlighting successful long-term rental strategies or significant owner usage.
Camboriú Airbnb Minimum Stay Requirements Analysis
Distribution of Listings by Minimum Night Requirement
1 Night
60 listings
29.9% of total
2 Nights
27 listings
13.4% of total
3 Nights
22 listings
10.9% of total
4-6 Nights
22 listings
10.9% of total
7-29 Nights
6 listings
3% of total
30+ Nights
64 listings
31.8% of total
Key Insights
- The most prevalent minimum stay requirement in Camboriú is 30+ Nights, adopted by 31.8% of listings. This highlights the market's preference for longer commitments.
- A significant segment (31.8%) caters to monthly stays (30+ nights) in Camboriú, pointing to opportunities in the extended-stay market.
Recommendations
- Align with the market by considering a 30+ Nights minimum stay, as 31.8% of Camboriú hosts use this setting.
- If feasible, allowing 1-night stays, especially midweek or during low season, could capture last-minute bookings, as only 29.9% currently do.
- Explore offering discounts for stays of 30+ nights to attract the 31.8% of the market seeking extended stays.
- Adjust minimum nights based on seasonality – potentially shorter during low season and longer during peak demand periods in Camboriú.
Camboriú Airbnb Cancellation Policy Trends Analysis (2026)
Limited
4 listings
2% of total
Flexible
53 listings
26.6% of total
Moderate
62 listings
31.2% of total
Firm
65 listings
32.7% of total
Strict
15 listings
7.5% of total
Cancellation Policy Insights for Camboriú
- The prevailing Airbnb cancellation policy trend in Camboriú is Firm, used by 32.7% of listings.
- There's a relatively balanced mix between guest-friendly (57.8%) and stricter (40.2%) policies, offering choices for different guest needs.
- Strict cancellation policies are quite rare (7.5%), potentially making listings with this policy less competitive unless justified by high demand or property type.
Recommendations for Hosts
- Consider adopting a Firm policy to align with the 32.7% market standard in Camboriú.
- Using a Strict policy might deter some guests, as only 7.5% of listings use it. Evaluate if potential revenue protection outweighs possible lower booking rates.
- Regularly review your cancellation policy against competitors and market demand shifts in Camboriú.
Camboriú STR Booking Lead Time Analysis (2026)
Average Booking Lead Time by Month
Booking Lead Time Insights for Camboriú
- The overall average booking lead time for vacation rentals in Camboriú is 40 days.
- Guests book furthest in advance for stays during December (average 67 days), likely coinciding with peak travel demand or local events.
- The shortest booking windows occur for stays in June (average 16 days), indicating more last-minute travel plans during this time.
- Seasonally, Winter (43 days avg.) sees the longest lead times, while Summer (18 days avg.) has the shortest, reflecting typical travel planning cycles.
Recommendations for Hosts
- Use the overall average lead time (40 days) as a baseline for your pricing and availability strategy in Camboriú.
- For December stays, consider implementing length-of-stay discounts or slightly higher rates for bookings made less than 67 days out to capitalize on advance planning.
- Target marketing efforts for the Winter season well in advance (at least 43 days) to capture early planners.
- Monitor your own booking lead times against these Camboriú averages to identify opportunities for dynamic pricing adjustments.
Popular & Essential Airbnb Amenities in Camboriú (2026)
Amenity Prevalence
Amenity Insights for Camboriú
- Essential amenities in Camboriú that guests expect include: Wifi, Kitchen. Lacking these (any) could significantly impact bookings.
- Popular amenities like TV, Free parking on premises, Air conditioning are common but not universal. Offering these can provide a competitive edge.
Recommendations for Hosts
- Ensure your listing includes all essential amenities for Camboriú: Wifi, Kitchen.
- Prioritize adding missing essentials: Wifi, Kitchen.
- Consider adding popular differentiators like TV or Free parking on premises to increase appeal.
- Highlight unique or less common amenities you offer (e.g., hot tub, dedicated workspace, EV charger) in your listing description and photos.
- Regularly check competitor amenities in Camboriú to stay competitive.
Camboriú Airbnb Guest Demographics & Profile Analysis (2026)
Guest Profile Summary for Camboriú
- The typical guest profile for Airbnb in Camboriú consists of primarily domestic travelers (94%), often arriving from nearby Santa Catarina, typically belonging to the Post-2000s (Gen Z/Alpha) group (50%), primarily speaking Portuguese or English.
- Domestic travelers account for 94.2% of guests.
- Key international markets include Brazil (94.2%) and Chile (2.2%).
- Top languages spoken are Portuguese (55.8%) followed by English (23.4%).
- A significant demographic segment is the Post-2000s (Gen Z/Alpha) group, representing 50% of guests.
Recommendations for Hosts
- Target domestic marketing efforts towards travelers from Santa Catarina and São Paulo.
- Tailor amenities and listing descriptions to appeal to the dominant Post-2000s (Gen Z/Alpha) demographic (e.g., highlight fast WiFi, smart home features, local guides).
- Highlight unique local experiences or amenities relevant to the primary guest profile.
- Consider seasonal promotions aligned with peak travel times for key origin markets.
Nearby Short-Term Rental Market Comparison
How does the Camboriú Airbnb market stack up against its neighbors? Compare key performance metrics like average monthly revenue, ADR, and occupancy rates in surrounding areas to understand the broader regional STR landscape.
| Market | Active Properties | Monthly Revenue | Daily Rate | Avg. Occupancy |
|---|---|---|---|---|
| Rancho Queimado | 177 | $1,169 | $156.09 | 28% |
| Angelina | 25 | $1,022 | $113.19 | 27% |
| Rio dos Cedros | 147 | $993 | $142.58 | 27% |
| Alfredo Wagner | 183 | $946 | $127.37 | 25% |
| Balneário Camboriú | 4,575 | $867 | $116.75 | 36% |
| Massaranduba | 11 | $844 | $86.77 | 36% |
| Anitápolis | 72 | $828 | $90.20 | 33% |
| Região Geográfica Imediata de Lages | 63 | $807 | $130.68 | 26% |
| Canelinha | 12 | $803 | $163.57 | 24% |
| Região Geográfica Imediata de Florianópolis | 21 | $774 | $120.71 | 22% |