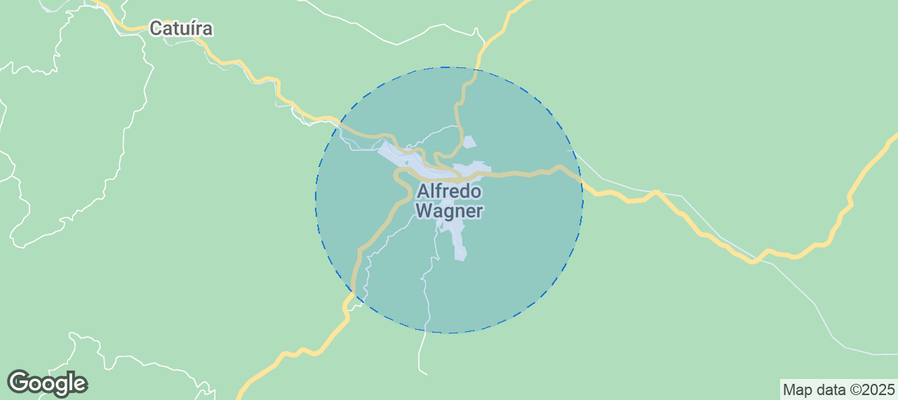
Alfredo Wagner Airbnb Market Analysis 2026: Short Term Rental Data & Vacation Rental Statistics in Santa Catarina, Brazil
Is Airbnb profitable in Alfredo Wagner in 2026? Explore comprehensive Airbnb analytics for Alfredo Wagner, Santa Catarina, Brazil to uncover income potential. This 2026 STR market report for Alfredo Wagner, based on AirROI data from February 2025 to January 2026, reveals key trends in the niche market of 183 active listings.
Whether you're considering an Airbnb investment in Alfredo Wagner, optimizing your existing vacation rental, or exploring rental arbitrage opportunities, understanding the Alfredo Wagner Airbnb data is crucial. Leveraging the low regulation environment is key to maximizing your short term rental income potential. Let's dive into the specifics.
Key Alfredo Wagner Airbnb Performance Metrics Overview
Monthly Airbnb Revenue Variations & Income Potential in Alfredo Wagner (2026)
Understanding the monthly revenue variations for Airbnb listings in Alfredo Wagner is key to maximizing your short term rental income potential. Seasonality significantly impacts earnings. Our analysis, based on data from the past 12 months, shows that the peak revenue month for STRs in Alfredo Wagner is typically July, while February often presents the lowest earnings, highlighting opportunities for strategic pricing adjustments during shoulder and low seasons. Explore the typical Airbnb income in Alfredo Wagner across different performance tiers:
- Best-in-class properties (Top 10%) achieve $2,817+ monthly, often utilizing dynamic pricing and superior guest experiences.
- Strong performing properties (Top 25%) earn $1,576 or more, indicating effective management and desirable locations/amenities.
- Typical properties (Median) generate around $752 per month, representing the average market performance.
- Entry-level properties (Bottom 25%) see earnings around $340, often with potential for optimization.
Average Monthly Airbnb Earnings Trend in Alfredo Wagner
Alfredo Wagner Airbnb Occupancy Rate Trends (2026)
Maximize your bookings by understanding the Alfredo Wagner STR occupancy trends. Seasonal demand shifts significantly influence how often properties are booked. Typically, Marchsees the highest demand (peak season occupancy), while October experiences the lowest (low season). Effective strategies, like adjusting minimum stays or offering promotions, can boost occupancy during slower periods. Here's how different property tiers perform in Alfredo Wagner:
- Best-in-class properties (Top 10%) achieve 60%+ occupancy, indicating high desirability and potentially optimized availability.
- Strong performing properties (Top 25%) maintain 37% or higher occupancy, suggesting good market fit and guest satisfaction.
- Typical properties (Median) have an occupancy rate around 21%.
- Entry-level properties (Bottom 25%) average 12% occupancy, potentially facing higher vacancy.
Average Monthly Occupancy Rate Trend in Alfredo Wagner
Average Daily Rate (ADR) Airbnb Trends in Alfredo Wagner (2026)
Effective short term rental pricing strategy in Alfredo Wagner involves understanding monthly ADR fluctuations. The Average Daily Rate (ADR) for Airbnb in Alfredo Wagner typically peaks in December and dips lowest during February. Leveraging Airbnb dynamic pricing tools or strategies based on this seasonality can significantly boost revenue. Here's a look at the typical nightly rates achieved:
- Best-in-class properties (Top 10%) command rates of $201+ per night, often due to premium features or locations.
- Strong performing properties (Top 25%) achieve nightly rates of $145 or more.
- Typical properties (Median) charge around $110 per night.
- Entry-level properties (Bottom 25%) earn around $82 per night.
Average Daily Rate (ADR) Trend by Month in Alfredo Wagner
Get Live Alfredo Wagner Market Intelligence 👇
Explore Real-time Analytics
Airbnb Seasonality Analysis & Trends in Alfredo Wagner (2026)
Peak Season (July, June, March)
- Revenue averages $1,402 per month
- Occupancy rates average 32.0%
- Daily rates average $122
Shoulder Season
- Revenue averages $1,250 per month
- Occupancy maintains around 27.1%
- Daily rates hold near $127
Low Season (January, February, October)
- Revenue drops to average $1,061 per month
- Occupancy decreases to average 24.1%
- Daily rates adjust to average $126
Seasonality Insights for Alfredo Wagner
- The Airbnb seasonality in Alfredo Wagner shows moderate seasonality with distinct peak and low periods. While the sections above show seasonal averages, it's also insightful to look at the extremes:
- During the high season, the absolute peak month showcases Alfredo Wagner's highest earning potential, with monthly revenues capable of climbing to $1,468, occupancy reaching a high of 32.4%, and ADRs peaking at $138.
- Conversely, the slowest single month of the year, typically falling within the low season, marks the market's lowest point. In this month, revenue might dip to $983, occupancy could drop to 23.1%, and ADRs may adjust down to $115.
- Understanding both the seasonal averages and these monthly peaks and troughs in revenue, occupancy, and ADR is crucial for maximizing your Airbnb profit potential in Alfredo Wagner.
Seasonal Strategies for Maximizing Profit
- Peak Season: Maximize revenue through premium pricing and potentially longer minimum stays. Ensure high availability.
- Low Season: Offer competitive pricing, special promotions (e.g., extended stay discounts), and flexible cancellation policies. Target off-season travelers like remote workers or budget-conscious guests.
- Shoulder Seasons: Implement dynamic pricing that balances peak and low rates. Target weekend travelers or specific events. Offer slightly more flexible terms than peak season.
- Regularly analyze your own performance against these Alfredo Wagner seasonality benchmarks and adjust your pricing and availability strategy accordingly.
Best Areas for Airbnb Investment in Alfredo Wagner (2026)
Exploring the top neighborhoods for short-term rentals in Alfredo Wagner? This section highlights key areas, outlining why they are attractive for hosts and guests, along with notable local attractions. Consider these locations based on your target guest profile and investment strategy.
| Neighborhood / Area | Why Host Here? (Target Guests & Appeal) | Key Attractions & Landmarks |
|---|---|---|
| Centro de Alfredo Wagner | The central area is the heart of the city, providing easy access to local amenities, shops, and restaurants. It's a prime location for guests seeking convenience and urban experiences. | Historic Church of Alfredo Wagner, Local markets, Cultural events |
| Concordia | A nearby district known for its natural beauty and outdoor activities, appealing to guests who love nature and adventure. | Hiking trails, Natural parks, Waterfalls |
| Fazenda São Pedro | This area is known for its agricultural tourism, including farm stays and rural experiences, attracting guests looking for tranquility and a taste of farm life. | Agritourism experiences, Local crafts, Farm fresh produce |
| Rota do Enxaimel | Renowned for its unique architecture and preserved culture, this route attracts visitors interested in cultural tourism and scenic views. | Enxaimel houses, Cultural workshops, Local festivals |
| Morros do Planalto | A picturesque area ideal for eco-tourism, offering stunning mountain views and opportunities for outdoor activities. | Hiking, Canopy tours, Scenic viewpoints |
| Estrada da Serra | A beautiful scenic road that leads to several touristic spots, perfect for guests who want to explore the region's natural beauty. | Panoramic viewpoints, Nature trails, Cultural landmarks |
| Rio do Sul | A nearby city with more amenities and attractions, making it a convenient base for visitors exploring the larger region. | Cultural events, Shopping centers, Parks |
| São Bonifácio | Close enough for day trips, known for its tranquil atmosphere and natural landscapes, attracting travelers looking for relaxation. | Natural reserves, Local cuisine, Countryside experiences |
Understanding Airbnb License Requirements & STR Laws in Alfredo Wagner (2026)
While Alfredo Wagner, Santa Catarina, Brazil currently shows low STR regulations, specific Airbnb license requirements might still exist or change. Always verify the latest short term rental regulations and Airbnb license requirements directly with local government authorities for Alfredo Wagner to ensure full compliance before hosting.
(Source: AirROI data, 2026, finding no licensed listings among those analyzed)
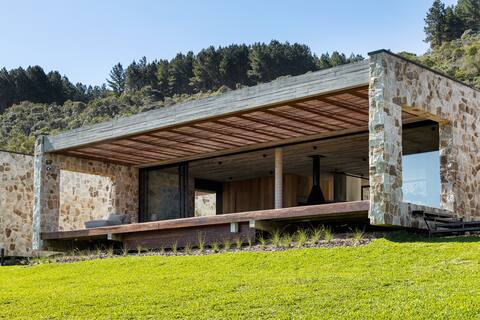
Top Performing Airbnb Properties in Alfredo Wagner (2026)
Benchmark your potential! Explore examples of top-performing Airbnb properties in Alfredo Wagnerbased on Trailing Twelve Month (TTM) revenue. Analyze their characteristics, revenue, occupancy rate, and ADR to understand what drives success in this market.
Casa entre Peraus
Entire Place • 6 bedrooms

Chalet Ilhas Gregas - Pousada Chalés de Alfredo
Entire Place • N/A
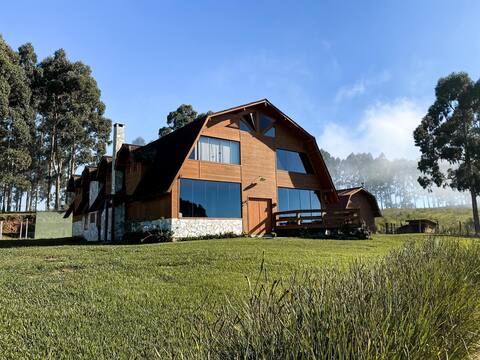
Barn-style country house - Estância da Chapada
Entire Place • 7 bedrooms

Rancho Kretzer
Entire Place • 5 bedrooms

Luxury retreat with pool and UTV
Entire Place • 2 bedrooms

Sebold Cottages
Entire Place • 2 bedrooms
Note: Performance varies based on location, size, amenities, seasonality, and management quality. Data reflects the past 12 months.
Top Performing Airbnb Hosts in Alfredo Wagner (2026)
Learn from the best! This table showcases top-performing Airbnb hosts in Alfredo Wagner based on the number of properties managed and estimated total revenue over the past year. Analyze their scale and performance metrics.
| Host Name | Properties | Grossing Revenue | Stay Reviews | Avg Rating |
|---|---|---|---|---|
| Felipe | 4 | $144,142 | 57 | 5.00/5.0 |
| Bruna Beppler | 6 | $140,099 | 292 | 5.00/5.0 |
| Thiago | 2 | $131,895 | 72 | 4.86/5.0 |
| Maria Luiza | 3 | $124,484 | 188 | 4.99/5.0 |
| Letícia | 1 | $65,010 | 61 | 4.98/5.0 |
| Joice | 3 | $63,442 | 31 | 4.97/5.0 |
| Henrique | 1 | $61,433 | 73 | 5.00/5.0 |
| Lidia Sofia | 1 | $61,123 | 100 | 5.00/5.0 |
| Jason | 2 | $55,304 | 463 | 4.96/5.0 |
| Renata | 3 | $54,062 | 16 | 5.00/5.0 |
Analyzing the strategies of top hosts, such as their property selection, pricing, and guest communication, can offer valuable lessons for optimizing your own Airbnb operations in Alfredo Wagner.
Dive Deeper: Advanced Alfredo Wagner STR Market Data (2026)
Ready to unlock more insights? AirROI provides access to advanced metrics and comprehensive Airbnb data for Alfredo Wagner. Explore detailed analytics beyond this report to refine your investment strategy, optimize pricing, and maximize your vacation rental profits.
Explore Advanced MetricsAlfredo Wagner Short-Term Rental Market Composition (2026): Property & Room Types
Room Type Distribution
Property Type Distribution
Market Composition Insights for Alfredo Wagner
- The Alfredo Wagner Airbnb market composition is heavily skewed towards Entire Home/Apt listings, which make up 94% of the 183 active rentals. This indicates strong guest preference for privacy and space.
- Looking at the property type distribution in Alfredo Wagner, House properties are the most common (48.1%), reflecting the local real estate landscape.
- Houses represent a significant 48.1% portion, catering likely to families or larger groups.
- Smaller segments like others, hotel/boutique, unique stays, apartment/condo (combined 13.1%) offer potential for unique stay experiences.
Alfredo Wagner Airbnb Room Capacity Analysis (2026): Bedroom Distribution
Distribution of Listings by Number of Bedrooms
Room Capacity Insights for Alfredo Wagner
- The dominant room capacity in Alfredo Wagner is 1 bedroom listings, making up 49.7% of the market. This suggests a strong demand for properties suitable for couples or solo travelers.
- Together, 1 bedroom and 2 bedrooms properties represent 75.4% of the active Airbnb listings in Alfredo Wagner, indicating a high concentration in these sizes.
Alfredo Wagner Vacation Rental Guest Capacity Trends (2026)
Distribution of Listings by Guest Capacity
Guest Capacity Insights for Alfredo Wagner
- The most common guest capacity trend in Alfredo Wagner vacation rentals is listings accommodating 2 guests (35.5%). This suggests the primary traveler segment is likely couples or solo travelers.
- Properties designed for 2 guests and 4 guests dominate the Alfredo Wagner STR market, accounting for 56.8% of listings.
- 26.8% of properties accommodate 6+ guests, serving the market segment for larger families or group travel in Alfredo Wagner.
- On average, properties in Alfredo Wagner are equipped to host 3.9 guests.
Alfredo Wagner Airbnb Booking Patterns (2026): Available vs. Booked Days
Available Days Distribution
Booked Days Distribution
Booking Pattern Insights for Alfredo Wagner
- The most common availability pattern in Alfredo Wagner falls within the 271-366 days range, representing 71% of listings. This suggests many properties have significant open periods on their calendars.
- Approximately 91.2% of listings show high availability (181+ days open annually), indicating potential for increased bookings or specific owner usage patterns.
- For booked days, the 31-90 days range is most frequent in Alfredo Wagner (48.1%), reflecting common guest stay durations or potential owner blocking patterns.
- A notable 8.8% of properties secure long booking periods (181+ days booked per year), highlighting successful long-term rental strategies or significant owner usage.
Alfredo Wagner Airbnb Minimum Stay Requirements Analysis
Distribution of Listings by Minimum Night Requirement
1 Night
71 listings
38.8% of total
2 Nights
72 listings
39.3% of total
7-29 Nights
1 listings
0.5% of total
30+ Nights
39 listings
21.3% of total
Key Insights
- The most prevalent minimum stay requirement in Alfredo Wagner is 2 Nights, adopted by 39.3% of listings. This highlights the market's preference for shorter, flexible bookings.
- A strong majority (78.1%) of the Alfredo Wagner Airbnb data shows acceptance of very short stays (1-2 nights), indicating a dynamic, high-turnover market.
- A significant segment (21.3%) caters to monthly stays (30+ nights) in Alfredo Wagner, pointing to opportunities in the extended-stay market.
Recommendations
- Align with the market by considering a 2 Nights minimum stay, as 39.3% of Alfredo Wagner hosts use this setting.
- Explore offering discounts for stays of 30+ nights to attract the 21.3% of the market seeking extended stays.
- Adjust minimum nights based on seasonality – potentially shorter during low season and longer during peak demand periods in Alfredo Wagner.
Alfredo Wagner Airbnb Cancellation Policy Trends Analysis (2026)
Super Strict 30 Days
2 listings
1.1% of total
Limited
3 listings
1.6% of total
Flexible
25 listings
13.7% of total
Moderate
75 listings
41.2% of total
Firm
61 listings
33.5% of total
Strict
16 listings
8.8% of total
Cancellation Policy Insights for Alfredo Wagner
- The prevailing Airbnb cancellation policy trend in Alfredo Wagner is Moderate, used by 41.2% of listings.
- There's a relatively balanced mix between guest-friendly (54.9%) and stricter (42.3%) policies, offering choices for different guest needs.
- Strict cancellation policies are quite rare (8.8%), potentially making listings with this policy less competitive unless justified by high demand or property type.
Recommendations for Hosts
- Consider adopting a Moderate policy to align with the 41.2% market standard in Alfredo Wagner.
- Using a Strict policy might deter some guests, as only 8.8% of listings use it. Evaluate if potential revenue protection outweighs possible lower booking rates.
- Regularly review your cancellation policy against competitors and market demand shifts in Alfredo Wagner.
Alfredo Wagner STR Booking Lead Time Analysis (2026)
Average Booking Lead Time by Month
Booking Lead Time Insights for Alfredo Wagner
- The overall average booking lead time for vacation rentals in Alfredo Wagner is 30 days.
- Guests book furthest in advance for stays during December (average 55 days), likely coinciding with peak travel demand or local events.
- The shortest booking windows occur for stays in February (average 19 days), indicating more last-minute travel plans during this time.
- Seasonally, Winter (33 days avg.) sees the longest lead times, while Spring (27 days avg.) has the shortest, reflecting typical travel planning cycles.
Recommendations for Hosts
- Use the overall average lead time (30 days) as a baseline for your pricing and availability strategy in Alfredo Wagner.
- For December stays, consider implementing length-of-stay discounts or slightly higher rates for bookings made less than 55 days out to capitalize on advance planning.
- Target marketing efforts for the Winter season well in advance (at least 33 days) to capture early planners.
- Monitor your own booking lead times against these Alfredo Wagner averages to identify opportunities for dynamic pricing adjustments.
Popular & Essential Airbnb Amenities in Alfredo Wagner (2026)
Amenity Prevalence
Amenity Insights for Alfredo Wagner
- Essential amenities in Alfredo Wagner that guests expect include: Wifi, Free parking on premises, Kitchen. Lacking these (any) could significantly impact bookings.
- Popular amenities like TV, Dishes and silverware, Bed linens are common but not universal. Offering these can provide a competitive edge.
Recommendations for Hosts
- Ensure your listing includes all essential amenities for Alfredo Wagner: Wifi, Free parking on premises, Kitchen.
- Prioritize adding missing essentials: Free parking on premises, Kitchen.
- Consider adding popular differentiators like TV or Dishes and silverware to increase appeal.
- Highlight unique or less common amenities you offer (e.g., hot tub, dedicated workspace, EV charger) in your listing description and photos.
- Regularly check competitor amenities in Alfredo Wagner to stay competitive.
Alfredo Wagner Airbnb Guest Demographics & Profile Analysis (2026)
Guest Profile Summary for Alfredo Wagner
- The typical guest profile for Airbnb in Alfredo Wagner consists of primarily domestic travelers (96%), often arriving from nearby Florianópolis, typically belonging to the Post-2000s (Gen Z/Alpha) group (50%), primarily speaking Portuguese or English.
- Domestic travelers account for 95.7% of guests.
- Key international markets include Brazil (95.7%) and United States (1%).
- Top languages spoken are Portuguese (47.1%) followed by English (31.4%).
- A significant demographic segment is the Post-2000s (Gen Z/Alpha) group, representing 50% of guests.
Recommendations for Hosts
- Target domestic marketing efforts towards travelers from Florianópolis and Santa Catarina.
- Tailor amenities and listing descriptions to appeal to the dominant Post-2000s (Gen Z/Alpha) demographic (e.g., highlight fast WiFi, smart home features, local guides).
- Highlight unique local experiences or amenities relevant to the primary guest profile.
- Consider seasonal promotions aligned with peak travel times for key origin markets.
Nearby Short-Term Rental Market Comparison
How does the Alfredo Wagner Airbnb market stack up against its neighbors? Compare key performance metrics like average monthly revenue, ADR, and occupancy rates in surrounding areas to understand the broader regional STR landscape.
| Market | Active Properties | Monthly Revenue | Daily Rate | Avg. Occupancy |
|---|---|---|---|---|
| Rancho Queimado | 177 | $1,169 | $156.09 | 28% |
| Angelina | 25 | $1,022 | $113.19 | 27% |
| Rio dos Cedros | 147 | $993 | $142.58 | 27% |
| Balneário Camboriú | 4,575 | $867 | $116.75 | 36% |
| Massaranduba | 11 | $844 | $86.77 | 36% |
| Anitápolis | 72 | $828 | $90.20 | 33% |
| Região Geográfica Imediata de Lages | 63 | $807 | $130.68 | 26% |
| Canelinha | 12 | $803 | $163.57 | 24% |
| Região Geográfica Imediata de Florianópolis | 21 | $774 | $120.71 | 22% |
| Santo Amaro da Imperatriz | 88 | $772 | $114.43 | 28% |