Rosana Airbnb Market Analysis 2025: Short Term Rental Data & Vacation Rental Statistics in São Paulo, Brazil
Is Airbnb profitable in Rosana in 2025? Explore comprehensive Airbnb analytics for Rosana, São Paulo, Brazil to uncover income potential. This 2025 STR market report for Rosana, based on AirROI data from September 2024 to August 2025, reveals key trends in the niche market of 18 active listings.
Whether you're considering an Airbnb investment in Rosana, optimizing your existing vacation rental, or exploring rental arbitrage opportunities, understanding the Rosana Airbnb data is crucial. Leveraging the low regulation environment is key to maximizing your short term rental income potential. Let's dive into the specifics.
Key Rosana Airbnb Performance Metrics Overview
Monthly Airbnb Revenue Variations & Income Potential in Rosana (2025)
Understanding the monthly revenue variations for Airbnb listings in Rosana is key to maximizing your short term rental income potential. Seasonality significantly impacts earnings. Our analysis, based on data from the past 12 months, shows that the peak revenue month for STRs in Rosana is typically January, while June often presents the lowest earnings, highlighting opportunities for strategic pricing adjustments during shoulder and low seasons. Explore the typical Airbnb income in Rosana across different performance tiers:
- Best-in-class properties (Top 10%) achieve $1,445+ monthly, often utilizing dynamic pricing and superior guest experiences.
- Strong performing properties (Top 25%) earn $940 or more, indicating effective management and desirable locations/amenities.
- Typical properties (Median) generate around $605 per month, representing the average market performance.
- Entry-level properties (Bottom 25%) see earnings around $314, often with potential for optimization.
Average Monthly Airbnb Earnings Trend in Rosana
Rosana Airbnb Occupancy Rate Trends (2025)
Maximize your bookings by understanding the Rosana STR occupancy trends. Seasonal demand shifts significantly influence how often properties are booked. Typically, Augustsees the highest demand (peak season occupancy), while June experiences the lowest (low season). Effective strategies, like adjusting minimum stays or offering promotions, can boost occupancy during slower periods. Here's how different property tiers perform in Rosana:
- Best-in-class properties (Top 10%) achieve 50%+ occupancy, indicating high desirability and potentially optimized availability.
- Strong performing properties (Top 25%) maintain 37% or higher occupancy, suggesting good market fit and guest satisfaction.
- Typical properties (Median) have an occupancy rate around 21%.
- Entry-level properties (Bottom 25%) average 9% occupancy, potentially facing higher vacancy.
Average Monthly Occupancy Rate Trend in Rosana
Average Daily Rate (ADR) Airbnb Trends in Rosana (2025)
Effective short term rental pricing strategy in Rosana involves understanding monthly ADR fluctuations. The Average Daily Rate (ADR) for Airbnb in Rosana typically peaks in May and dips lowest during September. Leveraging Airbnb dynamic pricing tools or strategies based on this seasonality can significantly boost revenue. Here's a look at the typical nightly rates achieved:
- Best-in-class properties (Top 10%) command rates of $160+ per night, often due to premium features or locations.
- Strong performing properties (Top 25%) achieve nightly rates of $139 or more.
- Typical properties (Median) charge around $111 per night.
- Entry-level properties (Bottom 25%) earn around $90 per night.
Average Daily Rate (ADR) Trend by Month in Rosana
Get Live Rosana Market Intelligence 👇

Explore Real-time Analytics
Airbnb Seasonality Analysis & Trends in Rosana (2025)
Peak Season (January, August, December)
- Revenue averages $1,079 per month
- Occupancy rates average 36.8%
- Daily rates average $116
Shoulder Season
- Revenue averages $755 per month
- Occupancy maintains around 25.5%
- Daily rates hold near $109
Low Season (February, May, June)
- Revenue drops to average $391 per month
- Occupancy decreases to average 14.8%
- Daily rates adjust to average $115
Seasonality Insights for Rosana
- The Airbnb seasonality in Rosana shows highly seasonal trends requiring careful strategy. While the sections above show seasonal averages, it's also insightful to look at the extremes:
- During the high season, the absolute peak month showcases Rosana's highest earning potential, with monthly revenues capable of climbing to $1,129, occupancy reaching a high of 40.8%, and ADRs peaking at $120.
- Conversely, the slowest single month of the year, typically falling within the low season, marks the market's lowest point. In this month, revenue might dip to $232, occupancy could drop to 12.2%, and ADRs may adjust down to $102.
- Understanding both the seasonal averages and these monthly peaks and troughs in revenue, occupancy, and ADR is crucial for maximizing your Airbnb profit potential in Rosana.
Seasonal Strategies for Maximizing Profit
- Peak Season: Maximize revenue through premium pricing and potentially longer minimum stays. Ensure high availability.
- Low Season: Offer competitive pricing, special promotions (e.g., extended stay discounts), and flexible cancellation policies. Target off-season travelers like remote workers or budget-conscious guests.
- Shoulder Seasons: Implement dynamic pricing that balances peak and low rates. Target weekend travelers or specific events. Offer slightly more flexible terms than peak season.
- Regularly analyze your own performance against these Rosana seasonality benchmarks and adjust your pricing and availability strategy accordingly.
Best Areas for Airbnb Investment in Rosana (2025)
Exploring the top neighborhoods for short-term rentals in Rosana? This section highlights key areas, outlining why they are attractive for hosts and guests, along with notable local attractions. Consider these locations based on your target guest profile and investment strategy.
| Neighborhood / Area | Why Host Here? (Target Guests & Appeal) | Key Attractions & Landmarks |
|---|---|---|
| Centro | The heart of Rosana with easy access to local shops and public transport. It's popular for its central location and proximity to essential services. | Local markets, Public transportation, Historical buildings, Cafés and restaurants |
| Jardim São Paulo | A residential neighborhood known for its family-friendly atmosphere and local parks. It's attractive for long-term stays and a quieter experience. | Parque da Juventude, Family-friendly parks, Local eateries, Quiet residential streets |
| Parque das Árvores | A scenic area with many green spaces and recreational facilities. Ideal for nature lovers and those looking for an outdoor experience. | Parks, Nature trails, Local wildlife, Fitness areas |
| Jardim do Sol | A growing neighborhood with new developments and amenities, making it attractive for young professionals and families. | Shopping centers, Cafés, Community activities, Family-friendly parks |
| Vila Nova | A historic area with charming architecture and a close-knit community feel. Perfect for travelers wanting a cultural experience. | Local architecture, Cultural events, Art galleries, Traditional restaurants |
| Rua das Flores | A picturesque street known for its flowers and local artisan shops. Ideal for visitors looking for unique gifts and local art. | Artisan shops, Local crafts, Community events, Florist stalls |
| Jardim das Palmeiras | A peaceful neighborhood with a strong sense of community. Good for longer stays with access to local amenities. | Local parks, Community centers, Grocery stores, Quiet streets |
| Praça do Mercado | A vibrant market square known for its fresh produce and local food vendors. Great for food lovers and those wanting an authentic experience. | Fresh markets, Local cuisine, Cultural performances, Food festivals |
Understanding Airbnb License Requirements & STR Laws in Rosana (2025)
While Rosana, São Paulo, Brazil currently shows low STR regulations, specific Airbnb license requirements might still exist or change. Always verify the latest short term rental regulations and Airbnb license requirements directly with local government authorities for Rosana to ensure full compliance before hosting.
(Source: AirROI data, 2025, finding no licensed listings among those analyzed)
Top Performing Airbnb Properties in Rosana (2025)
Benchmark your potential! Explore examples of top-performing Airbnb properties in Rosanabased on Trailing Twelve Month (TTM) revenue. Analyze their characteristics, revenue, occupancy rate, and ADR to understand what drives success in this market.
Rancho Rouxinol - Rosana/SP
Entire Place • 3 bedrooms

RANCH FOR SEASON IN ROSANA-SP RANCHO TUCUNARÉ
Entire Place • 3 bedrooms
Seasonal House in Rosana/SP. Rancho Ligeiros'2
Entire Place • 2 bedrooms

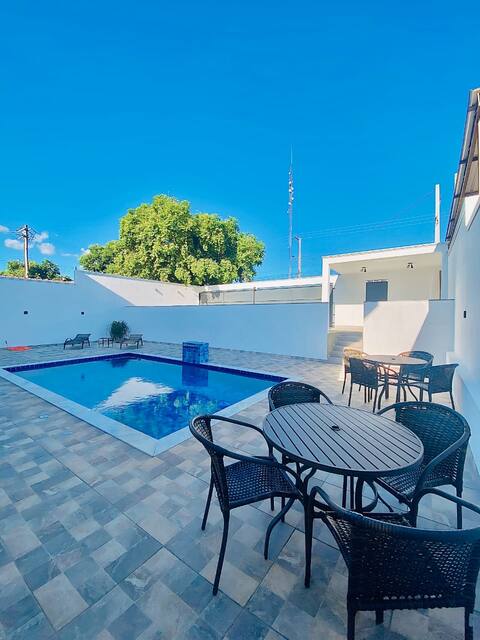
House/Ranch with swimming pool - 300 meters from the Balneário
Entire Place • 3 bedrooms

Rancho for rental / season Rancho do Zehlove
Entire Place • 2 bedrooms
Rancho do Guto - Rosana-SP
Entire Place • 3 bedrooms
Note: Performance varies based on location, size, amenities, seasonality, and management quality. Data reflects the past 12 months.
Top Performing Airbnb Hosts in Rosana (2025)
Learn from the best! This table showcases top-performing Airbnb hosts in Rosana based on the number of properties managed and estimated total revenue over the past year. Analyze their scale and performance metrics.
| Host Name | Properties | Grossing Revenue | Stay Reviews | Avg Rating |
|---|---|---|---|---|
| Andressa | 2 | $16,532 | 5 | 5.00/5.0 |
| Walber | 1 | $9,386 | 3 | 5.00/5.0 |
| João | 1 | $7,606 | 4 | 5.00/5.0 |
| Sara | 1 | $7,551 | 5 | 5.00/5.0 |
| Glaudney | 1 | $7,337 | 9 | 5.00/5.0 |
| Host #373514786 | 1 | $6,785 | 0 | Not Rated |
| Gabriel Campos | 1 | $6,586 | 4 | 4.75/5.0 |
| José Orlando | 1 | $5,454 | 18 | 4.94/5.0 |
| Janaina | 1 | $4,548 | 8 | 4.63/5.0 |
| Viviane Souza | 1 | $4,496 | 9 | 4.33/5.0 |
Analyzing the strategies of top hosts, such as their property selection, pricing, and guest communication, can offer valuable lessons for optimizing your own Airbnb operations in Rosana.
Dive Deeper: Advanced Rosana STR Market Data (2025)
Ready to unlock more insights? AirROI provides access to advanced metrics and comprehensive Airbnb data for Rosana. Explore detailed analytics beyond this report to refine your investment strategy, optimize pricing, and maximize your vacation rental profits.
Explore Advanced MetricsRosana Short-Term Rental Market Composition (2025): Property & Room Types
Room Type Distribution
Property Type Distribution
Market Composition Insights for Rosana
- The Rosana Airbnb market composition is heavily skewed towards Entire Home/Apt listings, which make up 100% of the 18 active rentals. This indicates strong guest preference for privacy and space.
- Looking at the property type distribution in Rosana, House properties are the most common (94.4%), reflecting the local real estate landscape.
- Houses represent a significant 94.4% portion, catering likely to families or larger groups.
Rosana Airbnb Room Capacity Analysis (2025): Bedroom Distribution
Distribution of Listings by Number of Bedrooms
Room Capacity Insights for Rosana
- The dominant room capacity in Rosana is 3 bedrooms listings, making up 50% of the market. This suggests a strong demand for properties suitable for families or small groups.
- Together, 3 bedrooms and 2 bedrooms properties represent 77.8% of the active Airbnb listings in Rosana, indicating a high concentration in these sizes.
- A significant 66.7% of listings offer 3+ bedrooms, catering to larger groups and families seeking more space in Rosana.
Rosana Vacation Rental Guest Capacity Trends (2025)
Distribution of Listings by Guest Capacity
Guest Capacity Insights for Rosana
- The most common guest capacity trend in Rosana vacation rentals is listings accommodating 8+ guests (88.9%). This suggests the primary traveler segment is likely larger groups.
- Properties designed for 8+ guests and 6 guests dominate the Rosana STR market, accounting for 94.5% of listings.
- 94.5% of properties accommodate 6+ guests, serving the market segment for larger families or group travel in Rosana.
- On average, properties in Rosana are equipped to host 7.7 guests.
Rosana Airbnb Booking Patterns (2025): Available vs. Booked Days
Available Days Distribution
Booked Days Distribution
Booking Pattern Insights for Rosana
- The most common availability pattern in Rosana falls within the 271-366 days range, representing 94.4% of listings. This suggests many properties have significant open periods on their calendars.
- Approximately 100.0% of listings show high availability (181+ days open annually), indicating potential for increased bookings or specific owner usage patterns.
- For booked days, the 31-90 days range is most frequent in Rosana (55.6%), reflecting common guest stay durations or potential owner blocking patterns.
Rosana Airbnb Minimum Stay Requirements Analysis
Distribution of Listings by Minimum Night Requirement
1 Night
4 listings
22.2% of total
2 Nights
10 listings
55.6% of total
4-6 Nights
1 listings
5.6% of total
30+ Nights
3 listings
16.7% of total
Key Insights
- The most prevalent minimum stay requirement in Rosana is 2 Nights, adopted by 55.6% of listings. This highlights the market's preference for shorter, flexible bookings.
- A strong majority (77.8%) of the Rosana Airbnb data shows acceptance of very short stays (1-2 nights), indicating a dynamic, high-turnover market.
- A significant segment (16.7%) caters to monthly stays (30+ nights) in Rosana, pointing to opportunities in the extended-stay market.
Recommendations
- Align with the market by considering a 2 Nights minimum stay, as 55.6% of Rosana hosts use this setting.
- If feasible, allowing 1-night stays, especially midweek or during low season, could capture last-minute bookings, as only 22.2% currently do.
- Explore offering discounts for stays of 30+ nights to attract the 16.7% of the market seeking extended stays.
- Adjust minimum nights based on seasonality – potentially shorter during low season and longer during peak demand periods in Rosana.
Rosana Airbnb Cancellation Policy Trends Analysis (2025)
Flexible
3 listings
18.8% of total
Moderate
2 listings
12.5% of total
Firm
6 listings
37.5% of total
Strict
5 listings
31.3% of total
Cancellation Policy Insights for Rosana
- The prevailing Airbnb cancellation policy trend in Rosana is Firm, used by 37.5% of listings.
- A majority (68.8%) of hosts in Rosana utilize Firm or Strict policies, indicating a market where hosts prioritize booking security.
Recommendations for Hosts
- Consider adopting a Firm policy to align with the 37.5% market standard in Rosana.
- With 31.3% using Strict terms, this is a viable option in Rosana, particularly for high-value properties or during peak demand periods.
- Regularly review your cancellation policy against competitors and market demand shifts in Rosana.
Rosana STR Booking Lead Time Analysis (2025)
Average Booking Lead Time by Month
Booking Lead Time Insights for Rosana
- The overall average booking lead time for vacation rentals in Rosana is 37 days.
- Guests book furthest in advance for stays during December (average 50 days), likely coinciding with peak travel demand or local events.
- The shortest booking windows occur for stays in October (average 6 days), indicating more last-minute travel plans during this time.
- Seasonally, Winter (45 days avg.) sees the longest lead times, while Fall (20 days avg.) has the shortest, reflecting typical travel planning cycles.
Recommendations for Hosts
- Use the overall average lead time (37 days) as a baseline for your pricing and availability strategy in Rosana.
- For December stays, consider implementing length-of-stay discounts or slightly higher rates for bookings made less than 50 days out to capitalize on advance planning.
- During October, focus on last-minute booking availability and promotions, as guests book with very short notice (6 days avg.).
- Target marketing efforts for the Winter season well in advance (at least 45 days) to capture early planners.
- Monitor your own booking lead times against these Rosana averages to identify opportunities for dynamic pricing adjustments.
Popular & Essential Airbnb Amenities in Rosana (2025)
Amenity Prevalence
Amenity Insights for Rosana
- Essential amenities in Rosana that guests expect include: Kitchen, Air conditioning, Wifi. Lacking these (any) could significantly impact bookings.
- Popular amenities like BBQ grill, TV, Free parking on premises are common but not universal. Offering these can provide a competitive edge.
Recommendations for Hosts
- Ensure your listing includes all essential amenities for Rosana: Kitchen, Air conditioning, Wifi.
- Consider adding popular differentiators like BBQ grill or TV to increase appeal.
- Highlight unique or less common amenities you offer (e.g., hot tub, dedicated workspace, EV charger) in your listing description and photos.
- Regularly check competitor amenities in Rosana to stay competitive.
Rosana Airbnb Guest Demographics & Profile Analysis (2025)
Guest Profile Summary for Rosana
- The typical guest profile for Airbnb in Rosana consists of primarily domestic travelers (95%), often arriving from nearby Maringá, typically belonging to the Post-2000s (Gen Z/Alpha) group (50%), primarily speaking Portuguese or English.
- Domestic travelers account for 95.2% of guests.
- Key international markets include Brazil (95.2%) and Spain (4.8%).
- Top languages spoken are Portuguese (46.7%) followed by English (26.7%).
- A significant demographic segment is the Post-2000s (Gen Z/Alpha) group, representing 50% of guests.
Recommendations for Hosts
- Target domestic marketing efforts towards travelers from Maringá and Ivinhema.
- Tailor amenities and listing descriptions to appeal to the dominant Post-2000s (Gen Z/Alpha) demographic (e.g., highlight fast WiFi, smart home features, local guides).
- Highlight unique local experiences or amenities relevant to the primary guest profile.
- Consider seasonal promotions aligned with peak travel times for key origin markets.
Nearby Short-Term Rental Market Comparison
How does the Rosana Airbnb market stack up against its neighbors? Compare key performance metrics like average monthly revenue, ADR, and occupancy rates in surrounding areas to understand the broader regional STR landscape.
| Market | Active Properties | Monthly Revenue | Daily Rate | Avg. Occupancy |
|---|---|---|---|---|
| Porto Rico | 60 | $680 | $142.10 | 25% |
| Presidente Epitácio | 52 | $472 | $92.28 | 25% |
| Paranavaí | 14 | $344 | $38.80 | 43% |
| Umuarama | 48 | $300 | $38.85 | 40% |
| Dourados | 193 | $218 | $31.41 | 34% |