Joanópolis Airbnb Market Analysis 2026: Short Term Rental Data & Vacation Rental Statistics in São Paulo, Brazil
Is Airbnb profitable in Joanópolis in 2026? Explore comprehensive Airbnb analytics for Joanópolis, São Paulo, Brazil to uncover income potential. This 2026 STR market report for Joanópolis, based on AirROI data from February 2025 to January 2026, reveals key trends in the market of 207 active listings.
Whether you're considering an Airbnb investment in Joanópolis, optimizing your existing vacation rental, or exploring rental arbitrage opportunities, understanding the Joanópolis Airbnb data is crucial. Leveraging the low regulation environment is key to maximizing your short term rental income potential. Let's dive into the specifics.
Key Joanópolis Airbnb Performance Metrics Overview
Monthly Airbnb Revenue Variations & Income Potential in Joanópolis (2026)
Understanding the monthly revenue variations for Airbnb listings in Joanópolis is key to maximizing your short term rental income potential. Seasonality significantly impacts earnings. Our analysis, based on data from the past 12 months, shows that the peak revenue month for STRs in Joanópolis is typically December, while May often presents the lowest earnings, highlighting opportunities for strategic pricing adjustments during shoulder and low seasons. Explore the typical Airbnb income in Joanópolis across different performance tiers:
- Best-in-class properties (Top 10%) achieve $2,585+ monthly, often utilizing dynamic pricing and superior guest experiences.
- Strong performing properties (Top 25%) earn $1,420 or more, indicating effective management and desirable locations/amenities.
- Typical properties (Median) generate around $702 per month, representing the average market performance.
- Entry-level properties (Bottom 25%) see earnings around $331, often with potential for optimization.
Average Monthly Airbnb Earnings Trend in Joanópolis
Joanópolis Airbnb Occupancy Rate Trends (2026)
Maximize your bookings by understanding the Joanópolis STR occupancy trends. Seasonal demand shifts significantly influence how often properties are booked. Typically, Decembersees the highest demand (peak season occupancy), while October experiences the lowest (low season). Effective strategies, like adjusting minimum stays or offering promotions, can boost occupancy during slower periods. Here's how different property tiers perform in Joanópolis:
- Best-in-class properties (Top 10%) achieve 67%+ occupancy, indicating high desirability and potentially optimized availability.
- Strong performing properties (Top 25%) maintain 46% or higher occupancy, suggesting good market fit and guest satisfaction.
- Typical properties (Median) have an occupancy rate around 25%.
- Entry-level properties (Bottom 25%) average 13% occupancy, potentially facing higher vacancy.
Average Monthly Occupancy Rate Trend in Joanópolis
Average Daily Rate (ADR) Airbnb Trends in Joanópolis (2026)
Effective short term rental pricing strategy in Joanópolis involves understanding monthly ADR fluctuations. The Average Daily Rate (ADR) for Airbnb in Joanópolis typically peaks in December and dips lowest during February. Leveraging Airbnb dynamic pricing tools or strategies based on this seasonality can significantly boost revenue. Here's a look at the typical nightly rates achieved:
- Best-in-class properties (Top 10%) command rates of $242+ per night, often due to premium features or locations.
- Strong performing properties (Top 25%) achieve nightly rates of $136 or more.
- Typical properties (Median) charge around $84 per night.
- Entry-level properties (Bottom 25%) earn around $55 per night.
Average Daily Rate (ADR) Trend by Month in Joanópolis
Get Live Joanópolis Market Intelligence 👇

Explore Real-time Analytics
Airbnb Seasonality Analysis & Trends in Joanópolis (2026)
Peak Season (December, January, March)
- Revenue averages $1,522 per month
- Occupancy rates average 37.0%
- Daily rates average $129
Shoulder Season
- Revenue averages $1,052 per month
- Occupancy maintains around 31.0%
- Daily rates hold near $124
Low Season (May, August, September)
- Revenue drops to average $947 per month
- Occupancy decreases to average 27.9%
- Daily rates adjust to average $125
Seasonality Insights for Joanópolis
- The Airbnb seasonality in Joanópolis shows highly seasonal trends requiring careful strategy. While the sections above show seasonal averages, it's also insightful to look at the extremes:
- During the high season, the absolute peak month showcases Joanópolis's highest earning potential, with monthly revenues capable of climbing to $1,819, occupancy reaching a high of 39.4%, and ADRs peaking at $136.
- Conversely, the slowest single month of the year, typically falling within the low season, marks the market's lowest point. In this month, revenue might dip to $944, occupancy could drop to 27.2%, and ADRs may adjust down to $117.
- Understanding both the seasonal averages and these monthly peaks and troughs in revenue, occupancy, and ADR is crucial for maximizing your Airbnb profit potential in Joanópolis.
Seasonal Strategies for Maximizing Profit
- Peak Season: Maximize revenue through premium pricing and potentially longer minimum stays. Ensure high availability.
- Low Season: Offer competitive pricing, special promotions (e.g., extended stay discounts), and flexible cancellation policies. Target off-season travelers like remote workers or budget-conscious guests.
- Shoulder Seasons: Implement dynamic pricing that balances peak and low rates. Target weekend travelers or specific events. Offer slightly more flexible terms than peak season.
- Regularly analyze your own performance against these Joanópolis seasonality benchmarks and adjust your pricing and availability strategy accordingly.
Best Areas for Airbnb Investment in Joanópolis (2026)
Exploring the top neighborhoods for short-term rentals in Joanópolis? This section highlights key areas, outlining why they are attractive for hosts and guests, along with notable local attractions. Consider these locations based on your target guest profile and investment strategy.
| Neighborhood / Area | Why Host Here? (Target Guests & Appeal) | Key Attractions & Landmarks |
|---|---|---|
| Centro Histórico | The historical center of Joanópolis offers charm and cultural significance, making it a great spot for tourists interested in history and local culture. | Museu Municipal de Joanópolis, Igreja Matriz de Santo António, Parque Dr. João Gualberto, feiras de artesanato, praça dos correios |
| Rio Jaguari | This area provides beautiful natural scenery along the river, ideal for those looking for a relaxing getaway surrounded by nature. | Trilha do Rio Jaguari, pesca esportiva, passeios de barco, caminhadas, picnics à beira do rio |
| Serra do Lopo | Known for its stunning natural landscapes and hiking trails, perfect for ecotourism and outdoor activities, attracting nature lovers and adventure seekers. | Pico do Lopo, trilhas para caminhadas, mirantes, emerge nature experience, tour de mountain bike |
| Joanópolis do Sertão | A quaint area offering a rural experience with local farms and fresh produce, appealing to tourists looking for an authentic Brazilian countryside experience. | fazendas de café, tour de agropecuária, festa do queijo, degustação de produtos locais, caminhos rurais |
| Praça da Matriz | A vibrant community hub with local shops, cafes, and markets, perfect for those looking for local culture and gastronomy. | mercado municipal, cafezinhos locais, eventos culturais, shows de música ao vivo, artesanato local |
| Cachoeiras do Joanópolis | Famous for its beautiful waterfalls, this area attracts visitors for nature activities and relaxation, making it ideal for eco-conscious travelers. | Cachoeira do Crispim, Cachoeira do Salto, trilhas ao redor das cachoeiras, passeios a cavalo, picnics em áreas naturais |
| Bairro do Campo | This area offers vast green spaces and is a peaceful retreat, attracting visitors who prefer a quieter, rural environment away from the urban hustle. | caminhadas a cavalo, observação de aves, experiências de vida na fazenda, atividade de cultivo agrícola, cultivo de plantas |
| Mirante do Vôo Livre | A popular spot for paragliding enthusiasts and those who enjoy breathtaking views, appealing to adventure travelers seeking adrenaline and picturesque landscapes. | vôos de parapente, pontos de vista incríveis, atividades ao ar livre, encontros de aventura, eventos de esportes radicais |
Understanding Airbnb License Requirements & STR Laws in Joanópolis (2026)
While Joanópolis, São Paulo, Brazil currently shows low STR regulations, specific Airbnb license requirements might still exist or change. Always verify the latest short term rental regulations and Airbnb license requirements directly with local government authorities for Joanópolis to ensure full compliance before hosting.
(Source: AirROI data, 2026, finding no licensed listings among those analyzed)
Top Performing Airbnb Properties in Joanópolis (2026)
Benchmark your potential! Explore examples of top-performing Airbnb properties in Joanópolisbased on Trailing Twelve Month (TTM) revenue. Analyze their characteristics, revenue, occupancy rate, and ADR to understand what drives success in this market.
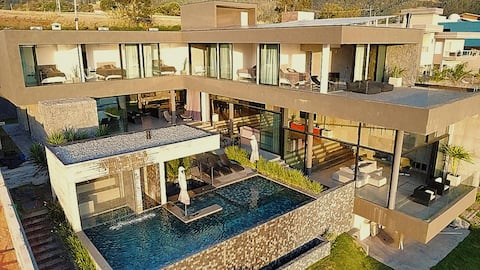
Contemporary House in a Condominium in Represa
Entire Place • 6 bedrooms

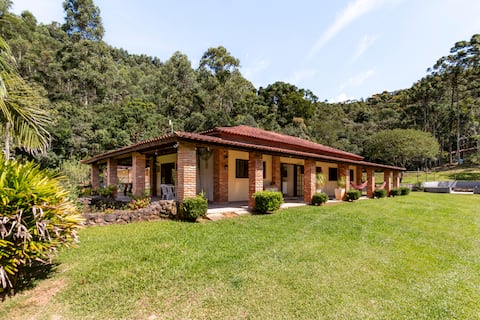
House in a condominium - Represa in Joanópolis
Entire Place • 3 bedrooms

ALTAR, a floating house to blend with nature
Entire Place • 1 bedroom
Beautiful pool house with sunbed and hot tub near waterfall
Entire Place • 5 bedrooms

Domo Bubble with Jacuzzi
Entire Place • 1 bedroom

Altar Prainha – Joanópolis Beach
Entire Place • 1 bedroom
Note: Performance varies based on location, size, amenities, seasonality, and management quality. Data reflects the past 12 months.
Top Performing Airbnb Hosts in Joanópolis (2026)
Learn from the best! This table showcases top-performing Airbnb hosts in Joanópolis based on the number of properties managed and estimated total revenue over the past year. Analyze their scale and performance metrics.
| Host Name | Properties | Grossing Revenue | Stay Reviews | Avg Rating |
|---|---|---|---|---|
| Rodrigo | 1 | $129,202 | 75 | 4.89/5.0 |
| O Altar | 2 | $96,615 | 66 | 4.94/5.0 |
| Juliana | 1 | $79,695 | 11 | 5.00/5.0 |
| Rafael | 2 | $70,026 | 552 | 4.88/5.0 |
| Thiago | 2 | $53,958 | 219 | 4.93/5.0 |
| Matheus | 5 | $52,096 | 269 | 4.97/5.0 |
| Regina | 2 | $50,488 | 173 | 5.00/5.0 |
| Cristina | 2 | $47,693 | 255 | 4.96/5.0 |
| Theo | 2 | $46,095 | 80 | 4.97/5.0 |
| Tifani Declair | 1 | $40,891 | 139 | 4.98/5.0 |
Analyzing the strategies of top hosts, such as their property selection, pricing, and guest communication, can offer valuable lessons for optimizing your own Airbnb operations in Joanópolis.
Dive Deeper: Advanced Joanópolis STR Market Data (2026)
Ready to unlock more insights? AirROI provides access to advanced metrics and comprehensive Airbnb data for Joanópolis. Explore detailed analytics beyond this report to refine your investment strategy, optimize pricing, and maximize your vacation rental profits.
Explore Advanced MetricsJoanópolis Short-Term Rental Market Composition (2026): Property & Room Types
Room Type Distribution
Property Type Distribution
Market Composition Insights for Joanópolis
- The Joanópolis Airbnb market composition is heavily skewed towards Entire Home/Apt listings, which make up 96.1% of the 207 active rentals. This indicates strong guest preference for privacy and space.
- Looking at the property type distribution in Joanópolis, House properties are the most common (81.2%), reflecting the local real estate landscape.
- Houses represent a significant 81.2% portion, catering likely to families or larger groups.
- Smaller segments like hotel/boutique, apartment/condo, others, unique stays (combined 9.0%) offer potential for unique stay experiences.
Joanópolis Airbnb Room Capacity Analysis (2026): Bedroom Distribution
Distribution of Listings by Number of Bedrooms
Room Capacity Insights for Joanópolis
- The dominant room capacity in Joanópolis is 1 bedroom listings, making up 24.6% of the market. This suggests a strong demand for properties suitable for couples or solo travelers.
- Together, 1 bedroom and 2 bedrooms properties represent 48.8% of the active Airbnb listings in Joanópolis, indicating a high concentration in these sizes.
- A significant 44.4% of listings offer 3+ bedrooms, catering to larger groups and families seeking more space in Joanópolis.
Joanópolis Vacation Rental Guest Capacity Trends (2026)
Distribution of Listings by Guest Capacity
Guest Capacity Insights for Joanópolis
- The most common guest capacity trend in Joanópolis vacation rentals is listings accommodating 8+ guests (49.3%). This suggests the primary traveler segment is likely larger groups.
- Properties designed for 8+ guests and 2 guests dominate the Joanópolis STR market, accounting for 64.3% of listings.
- 57.5% of properties accommodate 6+ guests, serving the market segment for larger families or group travel in Joanópolis.
- On average, properties in Joanópolis are equipped to host 5.8 guests.
Joanópolis Airbnb Booking Patterns (2026): Available vs. Booked Days
Available Days Distribution
Booked Days Distribution
Booking Pattern Insights for Joanópolis
- The most common availability pattern in Joanópolis falls within the 271-366 days range, representing 63.3% of listings. This suggests many properties have significant open periods on their calendars.
- Approximately 87.5% of listings show high availability (181+ days open annually), indicating potential for increased bookings or specific owner usage patterns.
- For booked days, the 31-90 days range is most frequent in Joanópolis (42.5%), reflecting common guest stay durations or potential owner blocking patterns.
- A notable 12.5% of properties secure long booking periods (181+ days booked per year), highlighting successful long-term rental strategies or significant owner usage.
Joanópolis Airbnb Minimum Stay Requirements Analysis
Distribution of Listings by Minimum Night Requirement
1 Night
35 listings
16.9% of total
2 Nights
102 listings
49.3% of total
3 Nights
2 listings
1% of total
4-6 Nights
3 listings
1.4% of total
7-29 Nights
1 listings
0.5% of total
30+ Nights
64 listings
30.9% of total
Key Insights
- The most prevalent minimum stay requirement in Joanópolis is 2 Nights, adopted by 49.3% of listings. This highlights the market's preference for shorter, flexible bookings.
- A strong majority (66.2%) of the Joanópolis Airbnb data shows acceptance of very short stays (1-2 nights), indicating a dynamic, high-turnover market.
- A significant segment (30.9%) caters to monthly stays (30+ nights) in Joanópolis, pointing to opportunities in the extended-stay market.
Recommendations
- Align with the market by considering a 2 Nights minimum stay, as 49.3% of Joanópolis hosts use this setting.
- If feasible, allowing 1-night stays, especially midweek or during low season, could capture last-minute bookings, as only 16.9% currently do.
- A 2-night minimum appears standard (49.3%). Consider this for weekends or peak periods.
- Explore offering discounts for stays of 30+ nights to attract the 30.9% of the market seeking extended stays.
- Adjust minimum nights based on seasonality – potentially shorter during low season and longer during peak demand periods in Joanópolis.
Joanópolis Airbnb Cancellation Policy Trends Analysis (2026)
Limited
2 listings
1% of total
Super Strict 30 Days
3 listings
1.4% of total
Flexible
46 listings
22.2% of total
Moderate
56 listings
27.1% of total
Firm
81 listings
39.1% of total
Strict
19 listings
9.2% of total
Cancellation Policy Insights for Joanópolis
- The prevailing Airbnb cancellation policy trend in Joanópolis is Firm, used by 39.1% of listings.
- There's a relatively balanced mix between guest-friendly (49.3%) and stricter (48.3%) policies, offering choices for different guest needs.
- Strict cancellation policies are quite rare (9.2%), potentially making listings with this policy less competitive unless justified by high demand or property type.
Recommendations for Hosts
- Consider adopting a Firm policy to align with the 39.1% market standard in Joanópolis.
- Using a Strict policy might deter some guests, as only 9.2% of listings use it. Evaluate if potential revenue protection outweighs possible lower booking rates.
- Regularly review your cancellation policy against competitors and market demand shifts in Joanópolis.
Joanópolis STR Booking Lead Time Analysis (2026)
Average Booking Lead Time by Month
Booking Lead Time Insights for Joanópolis
- The overall average booking lead time for vacation rentals in Joanópolis is 31 days.
- Guests book furthest in advance for stays during December (average 60 days), likely coinciding with peak travel demand or local events.
- The shortest booking windows occur for stays in August (average 14 days), indicating more last-minute travel plans during this time.
- Seasonally, Winter (41 days avg.) sees the longest lead times, while Summer (20 days avg.) has the shortest, reflecting typical travel planning cycles.
Recommendations for Hosts
- Use the overall average lead time (31 days) as a baseline for your pricing and availability strategy in Joanópolis.
- For December stays, consider implementing length-of-stay discounts or slightly higher rates for bookings made less than 60 days out to capitalize on advance planning.
- During August, focus on last-minute booking availability and promotions, as guests book with very short notice (14 days avg.).
- Target marketing efforts for the Winter season well in advance (at least 41 days) to capture early planners.
- Monitor your own booking lead times against these Joanópolis averages to identify opportunities for dynamic pricing adjustments.
Popular & Essential Airbnb Amenities in Joanópolis (2026)
Amenity Prevalence
Amenity Insights for Joanópolis
- Essential amenities in Joanópolis that guests expect include: Wifi, Kitchen, Free parking on premises. Lacking these (any) could significantly impact bookings.
- Popular amenities like TV, Pets allowed, Dishes and silverware are common but not universal. Offering these can provide a competitive edge.
Recommendations for Hosts
- Ensure your listing includes all essential amenities for Joanópolis: Wifi, Kitchen, Free parking on premises.
- Prioritize adding missing essentials: Wifi, Kitchen, Free parking on premises.
- Consider adding popular differentiators like TV or Pets allowed to increase appeal.
- Highlight unique or less common amenities you offer (e.g., hot tub, dedicated workspace, EV charger) in your listing description and photos.
- Regularly check competitor amenities in Joanópolis to stay competitive.
Joanópolis Airbnb Guest Demographics & Profile Analysis (2026)
Guest Profile Summary for Joanópolis
- The typical guest profile for Airbnb in Joanópolis consists of primarily domestic travelers (98%), often arriving from nearby São Paulo, typically belonging to the Post-2000s (Gen Z/Alpha) group (50%), primarily speaking Portuguese or English.
- Domestic travelers account for 98.3% of guests.
- Key international markets include Brazil (98.3%) and United States (0.4%).
- Top languages spoken are Portuguese (44.9%) followed by English (31.2%).
- A significant demographic segment is the Post-2000s (Gen Z/Alpha) group, representing 50% of guests.
Recommendations for Hosts
- Target domestic marketing efforts towards travelers from São Paulo and Campinas.
- Tailor amenities and listing descriptions to appeal to the dominant Post-2000s (Gen Z/Alpha) demographic (e.g., highlight fast WiFi, smart home features, local guides).
- Highlight unique local experiences or amenities relevant to the primary guest profile.
- Consider seasonal promotions aligned with peak travel times for key origin markets.
Nearby Short-Term Rental Market Comparison
How does the Joanópolis Airbnb market stack up against its neighbors? Compare key performance metrics like average monthly revenue, ADR, and occupancy rates in surrounding areas to understand the broader regional STR landscape.
| Market | Active Properties | Monthly Revenue | Daily Rate | Avg. Occupancy |
|---|---|---|---|---|
| Riviera de São Lourenço | 10 | $2,868 | $213.78 | 46% |
| Tuiuti | 18 | $1,686 | $156.45 | 30% |
| Itupeva | 136 | $1,561 | $225.82 | 28% |
| Morungaba | 31 | $1,435 | $263.39 | 27% |
| Campo Limpo Paulista | 49 | $1,428 | $181.02 | 30% |
| Valinhos | 61 | $1,370 | $176.28 | 33% |
| Itatiba | 171 | $1,331 | $177.58 | 29% |
| Vargem | 48 | $1,319 | $190.42 | 28% |
| Elias Fausto | 13 | $1,296 | $143.78 | 30% |
| Porto Feliz | 69 | $1,279 | $260.86 | 27% |