Eldorado Airbnb Market Analysis 2026: Short Term Rental Data & Vacation Rental Statistics in São Paulo, Brazil
Is Airbnb profitable in Eldorado in 2026? Explore comprehensive Airbnb analytics for Eldorado, São Paulo, Brazil to uncover income potential. This 2026 STR market report for Eldorado, based on AirROI data from February 2025 to January 2026, reveals key trends in the niche market of 24 active listings.
Whether you're considering an Airbnb investment in Eldorado, optimizing your existing vacation rental, or exploring rental arbitrage opportunities, understanding the Eldorado Airbnb data is crucial. Leveraging the low regulation environment is key to maximizing your short term rental income potential. Let's dive into the specifics.
Key Eldorado Airbnb Performance Metrics Overview
Monthly Airbnb Revenue Variations & Income Potential in Eldorado (2026)
Understanding the monthly revenue variations for Airbnb listings in Eldorado is key to maximizing your short term rental income potential. Seasonality significantly impacts earnings. Our analysis, based on data from the past 12 months, shows that the peak revenue month for STRs in Eldorado is typically March, while August often presents the lowest earnings, highlighting opportunities for strategic pricing adjustments during shoulder and low seasons. Explore the typical Airbnb income in Eldorado across different performance tiers:
- Best-in-class properties (Top 10%) achieve $502+ monthly, often utilizing dynamic pricing and superior guest experiences.
- Strong performing properties (Top 25%) earn $374 or more, indicating effective management and desirable locations/amenities.
- Typical properties (Median) generate around $278 per month, representing the average market performance.
- Entry-level properties (Bottom 25%) see earnings around $170, often with potential for optimization.
Average Monthly Airbnb Earnings Trend in Eldorado
Eldorado Airbnb Occupancy Rate Trends (2026)
Maximize your bookings by understanding the Eldorado STR occupancy trends. Seasonal demand shifts significantly influence how often properties are booked. Typically, Marchsees the highest demand (peak season occupancy), while August experiences the lowest (low season). Effective strategies, like adjusting minimum stays or offering promotions, can boost occupancy during slower periods. Here's how different property tiers perform in Eldorado:
- Best-in-class properties (Top 10%) achieve 33%+ occupancy, indicating high desirability and potentially optimized availability.
- Strong performing properties (Top 25%) maintain 26% or higher occupancy, suggesting good market fit and guest satisfaction.
- Typical properties (Median) have an occupancy rate around 18%.
- Entry-level properties (Bottom 25%) average 13% occupancy, potentially facing higher vacancy.
Average Monthly Occupancy Rate Trend in Eldorado
Average Daily Rate (ADR) Airbnb Trends in Eldorado (2026)
Effective short term rental pricing strategy in Eldorado involves understanding monthly ADR fluctuations. The Average Daily Rate (ADR) for Airbnb in Eldorado typically peaks in January and dips lowest during August. Leveraging Airbnb dynamic pricing tools or strategies based on this seasonality can significantly boost revenue. Here's a look at the typical nightly rates achieved:
- Best-in-class properties (Top 10%) command rates of $101+ per night, often due to premium features or locations.
- Strong performing properties (Top 25%) achieve nightly rates of $56 or more.
- Typical properties (Median) charge around $48 per night.
- Entry-level properties (Bottom 25%) earn around $38 per night.
Average Daily Rate (ADR) Trend by Month in Eldorado
Get Live Eldorado Market Intelligence 👇
Explore Real-time Analytics
Airbnb Seasonality Analysis & Trends in Eldorado (2026)
Peak Season (March, December, February)
- Revenue averages $423 per month
- Occupancy rates average 24.0%
- Daily rates average $56
Shoulder Season
- Revenue averages $319 per month
- Occupancy maintains around 21.8%
- Daily rates hold near $54
Low Season (August, September, October)
- Revenue drops to average $156 per month
- Occupancy decreases to average 11.5%
- Daily rates adjust to average $52
Seasonality Insights for Eldorado
- The Airbnb seasonality in Eldorado shows highly seasonal trends requiring careful strategy. While the sections above show seasonal averages, it's also insightful to look at the extremes:
- During the high season, the absolute peak month showcases Eldorado's highest earning potential, with monthly revenues capable of climbing to $502, occupancy reaching a high of 29.0%, and ADRs peaking at $61.
- Conversely, the slowest single month of the year, typically falling within the low season, marks the market's lowest point. In this month, revenue might dip to $142, occupancy could drop to 10.4%, and ADRs may adjust down to $49.
- Understanding both the seasonal averages and these monthly peaks and troughs in revenue, occupancy, and ADR is crucial for maximizing your Airbnb profit potential in Eldorado.
Seasonal Strategies for Maximizing Profit
- Peak Season: Maximize revenue through premium pricing and potentially longer minimum stays. Ensure high availability.
- Low Season: Offer competitive pricing, special promotions (e.g., extended stay discounts), and flexible cancellation policies. Target off-season travelers like remote workers or budget-conscious guests.
- Shoulder Seasons: Implement dynamic pricing that balances peak and low rates. Target weekend travelers or specific events. Offer slightly more flexible terms than peak season.
- Regularly analyze your own performance against these Eldorado seasonality benchmarks and adjust your pricing and availability strategy accordingly.
Best Areas for Airbnb Investment in Eldorado (2026)
Exploring the top neighborhoods for short-term rentals in Eldorado? This section highlights key areas, outlining why they are attractive for hosts and guests, along with notable local attractions. Consider these locations based on your target guest profile and investment strategy.
| Neighborhood / Area | Why Host Here? (Target Guests & Appeal) | Key Attractions & Landmarks |
|---|---|---|
| Jardins | Sought-after neighborhood known for upscale shopping, fine dining, and cultural attractions. Popular with tourists for its vibrant atmosphere and proximity to Avenida Paulista. | Avenida Paulista, Ibirapuera Park, Museum of Modern Art, Shopping Centers, Cultural Institutions |
| Vila Madalena | Bohemian neighborhood famous for its artistic vibe, street art, and nightlife. Ideal for young travelers and those seeking a unique, local experience. | Beco do Batman, Casa da Vila, Bars and Restaurants, Art Galleries, Cultural Events |
| Pinheiros | Trendy area with a mix of dining options, cultural institutions, and great public transport. Attracts both tourists and locals looking for a vibrant atmosphere. | Villa-Lobos Park, Shopping Eldorado, Local Markets, Art Spaces, Music Venues |
| Morumbi | Residential neighborhood with luxury amenities and close proximity to major attractions. Attractive for families and business travelers. | Shopping Morumbi, Morumbi Stadium, Ibirapuera Park, Cultural Centers, Business Districts |
| Brooklin | Modern neighborhood with a mix of business and leisure, popular with international travelers and business professionals. Offers great urban amenities. | Shopping D, Brooklin Nova York, Bourbon Theater, Parks, High-end Restaurants |
| Centro | The historic downtown area with a mix of culture, history, and nightlife. Attracts budget-conscious travelers and culture enthusiasts. | Municipal Market, Pátio do Colégio, São Paulo Cathedral, Luz Station, Cultural Institutions |
| Alto de Pinheiros | Quiet, green suburb close to the city center. Great for families and those seeking a calm stay while still being near the city's attractions. | Pinheiros River, Parks, Local Cafes, Cultural Institutions, Residential Areas |
| Moema | Charming neighborhood renowned for its parks and close to Ibirapuera Park. Popular among families and business travelers for its safety and amenities. | Ibirapuera Park, Shopping Moema, Local Restaurants, Cultural Centers, Public Transport Access |
Understanding Airbnb License Requirements & STR Laws in Eldorado (2026)
While Eldorado, São Paulo, Brazil currently shows low STR regulations, specific Airbnb license requirements might still exist or change. Always verify the latest short term rental regulations and Airbnb license requirements directly with local government authorities for Eldorado to ensure full compliance before hosting.
(Source: AirROI data, 2026, based on 4% licensed listings)
Top Performing Airbnb Properties in Eldorado (2026)
Benchmark your potential! Explore examples of top-performing Airbnb properties in Eldoradobased on Trailing Twelve Month (TTM) revenue. Analyze their characteristics, revenue, occupancy rate, and ADR to understand what drives success in this market.

Recanto das Águas - Chalé Quadruple Luxury
Private Room • N/A
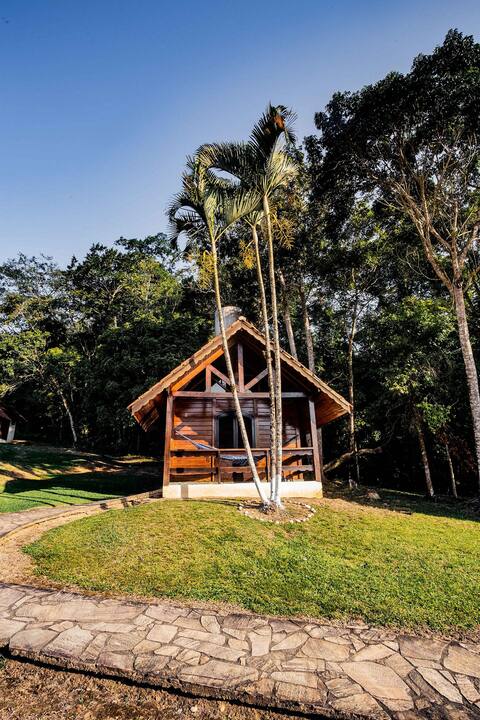
Recanto das Águas - Chalet in the Atlantic Forest
Private Room • N/A

Farm in the City Center
Entire Place • 3 bedrooms

Recanto das Águas - Chalet in the Atlantic Forest
Private Room • 1 bedroom

Recanto das Águas - Chalet in the Atlantic Forest
Private Room • 1 bedroom

Recanto das Águas - Chalet in the Atlantic Forest
Private Room • N/A
Note: Performance varies based on location, size, amenities, seasonality, and management quality. Data reflects the past 12 months.
Top Performing Airbnb Hosts in Eldorado (2026)
Learn from the best! This table showcases top-performing Airbnb hosts in Eldorado based on the number of properties managed and estimated total revenue over the past year. Analyze their scale and performance metrics.
| Host Name | Properties | Grossing Revenue | Stay Reviews | Avg Rating |
|---|---|---|---|---|
| Marcelo | 14 | $52,145 | 85 | 4.65/5.0 |
| Fernando José | 1 | $4,790 | 68 | 4.94/5.0 |
| Caroline Mariano | 2 | $4,411 | 43 | 4.86/5.0 |
| Mateus França | 1 | $2,990 | 23 | 4.87/5.0 |
| Nadieli | 3 | $1,952 | 4 | Not Rated |
| Casa Do Rio | 1 | $1,811 | 1 | Not Rated |
| Fernando | 1 | $1,203 | 15 | 4.47/5.0 |
| Edson | 1 | $81 | 3 | 4.67/5.0 |
Analyzing the strategies of top hosts, such as their property selection, pricing, and guest communication, can offer valuable lessons for optimizing your own Airbnb operations in Eldorado.
Dive Deeper: Advanced Eldorado STR Market Data (2026)
Ready to unlock more insights? AirROI provides access to advanced metrics and comprehensive Airbnb data for Eldorado. Explore detailed analytics beyond this report to refine your investment strategy, optimize pricing, and maximize your vacation rental profits.
Explore Advanced MetricsEldorado Short-Term Rental Market Composition (2026): Property & Room Types
Room Type Distribution
Property Type Distribution
Market Composition Insights for Eldorado
- The Eldorado Airbnb market composition is heavily skewed towards Private Room listings, which make up 66.7% of the 24 active rentals. This indicates strong guest preference for privacy and space.
- Looking at the property type distribution in Eldorado, House properties are the most common (62.5%), reflecting the local real estate landscape.
- Houses represent a significant 62.5% portion, catering likely to families or larger groups.
- The presence of 29.2% Hotel/Boutique listings indicates integration with traditional hospitality.
- Smaller segments like apartment/condo, outdoor/unique (combined 8.4%) offer potential for unique stay experiences.
Eldorado Airbnb Room Capacity Analysis (2026): Bedroom Distribution
Distribution of Listings by Number of Bedrooms
Room Capacity Insights for Eldorado
- The dominant room capacity in Eldorado is 1 bedroom listings, making up 33.3% of the market. This suggests a strong demand for properties suitable for couples or solo travelers.
- Together, 1 bedroom and 3 bedrooms properties represent 45.8% of the active Airbnb listings in Eldorado, indicating a high concentration in these sizes.
Eldorado Vacation Rental Guest Capacity Trends (2026)
Distribution of Listings by Guest Capacity
Guest Capacity Insights for Eldorado
- The most common guest capacity trend in Eldorado vacation rentals is listings accommodating 4 guests (25%). This suggests the primary traveler segment is likely small families or groups.
- Properties designed for 4 guests and 2 guests dominate the Eldorado STR market, accounting for 37.5% of listings.
- 12.5% of properties accommodate 6+ guests, serving the market segment for larger families or group travel in Eldorado.
- On average, properties in Eldorado are equipped to host 2.3 guests.
Eldorado Airbnb Booking Patterns (2026): Available vs. Booked Days
Available Days Distribution
Booked Days Distribution
Booking Pattern Insights for Eldorado
- The most common availability pattern in Eldorado falls within the 271-366 days range, representing 91.7% of listings. This suggests many properties have significant open periods on their calendars.
- Approximately 100.0% of listings show high availability (181+ days open annually), indicating potential for increased bookings or specific owner usage patterns.
- For booked days, the 31-90 days range is most frequent in Eldorado (70.8%), reflecting common guest stay durations or potential owner blocking patterns.
Eldorado Airbnb Minimum Stay Requirements Analysis
Distribution of Listings by Minimum Night Requirement
1 Night
21 listings
87.5% of total
2 Nights
3 listings
12.5% of total
Key Insights
- The most prevalent minimum stay requirement in Eldorado is 1 Night, adopted by 87.5% of listings. This highlights the market's preference for shorter, flexible bookings.
- A strong majority (100.0%) of the Eldorado Airbnb data shows acceptance of very short stays (1-2 nights), indicating a dynamic, high-turnover market.
Recommendations
- Align with the market by considering a 1 Night minimum stay, as 87.5% of Eldorado hosts use this setting.
- Adjust minimum nights based on seasonality – potentially shorter during low season and longer during peak demand periods in Eldorado.
Eldorado Airbnb Cancellation Policy Trends Analysis (2026)
Flexible
7 listings
29.2% of total
Moderate
15 listings
62.5% of total
Firm
2 listings
8.3% of total
Cancellation Policy Insights for Eldorado
- The prevailing Airbnb cancellation policy trend in Eldorado is Moderate, used by 62.5% of listings.
- The market strongly favors guest-friendly terms, with 91.7% of listings offering Flexible or Moderate policies. This suggests guests in Eldorado may expect booking flexibility.
Recommendations for Hosts
- Consider adopting a Moderate policy to align with the 62.5% market standard in Eldorado.
- Regularly review your cancellation policy against competitors and market demand shifts in Eldorado.
Eldorado STR Booking Lead Time Analysis (2026)
Average Booking Lead Time by Month
Booking Lead Time Insights for Eldorado
- The overall average booking lead time for vacation rentals in Eldorado is 31 days.
- Guests book furthest in advance for stays during August (average 77 days), likely coinciding with peak travel demand or local events.
- The shortest booking windows occur for stays in March (average 12 days), indicating more last-minute travel plans during this time.
- Seasonally, Summer (40 days avg.) sees the longest lead times, while Spring (19 days avg.) has the shortest, reflecting typical travel planning cycles.
Recommendations for Hosts
- Use the overall average lead time (31 days) as a baseline for your pricing and availability strategy in Eldorado.
- For August stays, consider implementing length-of-stay discounts or slightly higher rates for bookings made less than 77 days out to capitalize on advance planning.
- During March, focus on last-minute booking availability and promotions, as guests book with very short notice (12 days avg.).
- Target marketing efforts for the Summer season well in advance (at least 40 days) to capture early planners.
- Monitor your own booking lead times against these Eldorado averages to identify opportunities for dynamic pricing adjustments.
Popular & Essential Airbnb Amenities in Eldorado (2026)
Amenity Prevalence
Amenity Insights for Eldorado
- Essential amenities in Eldorado that guests expect include: Wifi. Lacking these (this) could significantly impact bookings.
- Popular amenities like TV, Free parking on premises, Backyard are common but not universal. Offering these can provide a competitive edge.
Recommendations for Hosts
- Ensure your listing includes all essential amenities for Eldorado: Wifi.
- Prioritize adding missing essentials: Wifi.
- Consider adding popular differentiators like TV or Free parking on premises to increase appeal.
- Highlight unique or less common amenities you offer (e.g., hot tub, dedicated workspace, EV charger) in your listing description and photos.
- Regularly check competitor amenities in Eldorado to stay competitive.
Eldorado Airbnb Guest Demographics & Profile Analysis (2026)
Guest Profile Summary for Eldorado
- The typical guest profile for Airbnb in Eldorado consists of primarily domestic travelers (100%), often arriving from nearby São Paulo, typically belonging to the Post-2000s (Gen Z/Alpha) group (50%), primarily speaking Portuguese or English.
- Domestic travelers account for 100.0% of guests.
- Top languages spoken are Portuguese (60.7%) followed by English (32.1%).
- A significant demographic segment is the Post-2000s (Gen Z/Alpha) group, representing 50% of guests.
Recommendations for Hosts
- Target domestic marketing efforts towards travelers from São Paulo and Rio de Janeiro.
- Tailor amenities and listing descriptions to appeal to the dominant Post-2000s (Gen Z/Alpha) demographic (e.g., highlight fast WiFi, smart home features, local guides).
- Highlight unique local experiences or amenities relevant to the primary guest profile.
- Consider seasonal promotions aligned with peak travel times for key origin markets.
Nearby Short-Term Rental Market Comparison
How does the Eldorado Airbnb market stack up against its neighbors? Compare key performance metrics like average monthly revenue, ADR, and occupancy rates in surrounding areas to understand the broader regional STR landscape.
| Market | Active Properties | Monthly Revenue | Daily Rate | Avg. Occupancy |
|---|---|---|---|---|
| Arandu | 36 | $1,896 | $275.63 | 25% |
| Itupeva | 136 | $1,561 | $225.82 | 28% |
| Itaí | 88 | $1,300 | $248.75 | 21% |
| Elias Fausto | 13 | $1,296 | $143.78 | 30% |
| Almirante Tamandaré | 16 | $1,292 | $118.23 | 39% |
| Porto Feliz | 69 | $1,279 | $260.86 | 27% |
| Tietê | 14 | $1,245 | $237.69 | 25% |
| Mairinque | 347 | $1,200 | $177.68 | 27% |
| Itu | 272 | $1,169 | $198.29 | 26% |
| Quatro Barras | 39 | $1,134 | $137.97 | 32% |