Volta Redonda Airbnb Market Analysis 2026: Short Term Rental Data & Vacation Rental Statistics in Rio de Janeiro, Brazil
Is Airbnb profitable in Volta Redonda in 2026? Explore comprehensive Airbnb analytics for Volta Redonda, Rio de Janeiro, Brazil to uncover income potential. This 2026 STR market report for Volta Redonda, based on AirROI data from February 2025 to January 2026, reveals key trends in the niche market of 120 active listings.
Whether you're considering an Airbnb investment in Volta Redonda, optimizing your existing vacation rental, or exploring rental arbitrage opportunities, understanding the Volta Redonda Airbnb data is crucial. Leveraging the low regulation environment is key to maximizing your short term rental income potential. Let's dive into the specifics.
Key Volta Redonda Airbnb Performance Metrics Overview
Monthly Airbnb Revenue Variations & Income Potential in Volta Redonda (2026)
Understanding the monthly revenue variations for Airbnb listings in Volta Redonda is key to maximizing your short term rental income potential. Seasonality significantly impacts earnings. Our analysis, based on data from the past 12 months, shows that the peak revenue month for STRs in Volta Redonda is typically February, while November often presents the lowest earnings, highlighting opportunities for strategic pricing adjustments during shoulder and low seasons. Explore the typical Airbnb income in Volta Redonda across different performance tiers:
- Best-in-class properties (Top 10%) achieve $784+ monthly, often utilizing dynamic pricing and superior guest experiences.
- Strong performing properties (Top 25%) earn $545 or more, indicating effective management and desirable locations/amenities.
- Typical properties (Median) generate around $295 per month, representing the average market performance.
- Entry-level properties (Bottom 25%) see earnings around $132, often with potential for optimization.
Average Monthly Airbnb Earnings Trend in Volta Redonda
Volta Redonda Airbnb Occupancy Rate Trends (2026)
Maximize your bookings by understanding the Volta Redonda STR occupancy trends. Seasonal demand shifts significantly influence how often properties are booked. Typically, Februarysees the highest demand (peak season occupancy), while November experiences the lowest (low season). Effective strategies, like adjusting minimum stays or offering promotions, can boost occupancy during slower periods. Here's how different property tiers perform in Volta Redonda:
- Best-in-class properties (Top 10%) achieve 78%+ occupancy, indicating high desirability and potentially optimized availability.
- Strong performing properties (Top 25%) maintain 60% or higher occupancy, suggesting good market fit and guest satisfaction.
- Typical properties (Median) have an occupancy rate around 35%.
- Entry-level properties (Bottom 25%) average 16% occupancy, potentially facing higher vacancy.
Average Monthly Occupancy Rate Trend in Volta Redonda
Average Daily Rate (ADR) Airbnb Trends in Volta Redonda (2026)
Effective short term rental pricing strategy in Volta Redonda involves understanding monthly ADR fluctuations. The Average Daily Rate (ADR) for Airbnb in Volta Redonda typically peaks in December and dips lowest during April. Leveraging Airbnb dynamic pricing tools or strategies based on this seasonality can significantly boost revenue. Here's a look at the typical nightly rates achieved:
- Best-in-class properties (Top 10%) command rates of $50+ per night, often due to premium features or locations.
- Strong performing properties (Top 25%) achieve nightly rates of $36 or more.
- Typical properties (Median) charge around $26 per night.
- Entry-level properties (Bottom 25%) earn around $18 per night.
Average Daily Rate (ADR) Trend by Month in Volta Redonda
Get Live Volta Redonda Market Intelligence 👇

Explore Real-time Analytics
Airbnb Seasonality Analysis & Trends in Volta Redonda (2026)
Peak Season (February, September, March)
- Revenue averages $471 per month
- Occupancy rates average 47.4%
- Daily rates average $29
Shoulder Season
- Revenue averages $401 per month
- Occupancy maintains around 38.5%
- Daily rates hold near $30
Low Season (January, June, November)
- Revenue drops to average $320 per month
- Occupancy decreases to average 33.4%
- Daily rates adjust to average $32
Seasonality Insights for Volta Redonda
- The Airbnb seasonality in Volta Redonda shows moderate seasonality with distinct peak and low periods. While the sections above show seasonal averages, it's also insightful to look at the extremes:
- During the high season, the absolute peak month showcases Volta Redonda's highest earning potential, with monthly revenues capable of climbing to $475, occupancy reaching a high of 51.6%, and ADRs peaking at $34.
- Conversely, the slowest single month of the year, typically falling within the low season, marks the market's lowest point. In this month, revenue might dip to $290, occupancy could drop to 30.9%, and ADRs may adjust down to $28.
- Understanding both the seasonal averages and these monthly peaks and troughs in revenue, occupancy, and ADR is crucial for maximizing your Airbnb profit potential in Volta Redonda.
Seasonal Strategies for Maximizing Profit
- Peak Season: Maximize revenue through premium pricing and potentially longer minimum stays. Ensure high availability.
- Low Season: Offer competitive pricing, special promotions (e.g., extended stay discounts), and flexible cancellation policies. Target off-season travelers like remote workers or budget-conscious guests.
- Shoulder Seasons: Implement dynamic pricing that balances peak and low rates. Target weekend travelers or specific events. Offer slightly more flexible terms than peak season.
- Regularly analyze your own performance against these Volta Redonda seasonality benchmarks and adjust your pricing and availability strategy accordingly.
Best Areas for Airbnb Investment in Volta Redonda (2026)
Exploring the top neighborhoods for short-term rentals in Volta Redonda? This section highlights key areas, outlining why they are attractive for hosts and guests, along with notable local attractions. Consider these locations based on your target guest profile and investment strategy.
| Neighborhood / Area | Why Host Here? (Target Guests & Appeal) | Key Attractions & Landmarks |
|---|---|---|
| Centro | The heart of Volta Redonda, Centro is bustling with commercial activity, shopping, and local attractions. It attracts both business travelers and leisure visitors due to its accessibility and amenities. | Shopping Palladium, Estádio da Cidadania, Volta Redonda Park, Museu Ciência e Tecnologia, Igreja Matriz de Nossa Senhora da Conceição |
| Aterrado | A vibrant residential neighborhood known for its family-friendly atmosphere, parks, and community events. It's popular among locals and offers a more authentic stay for visitors. | Aterrado Plaza Shopping, Parque Municipal Dom Agostinho Petrine, Caminho do Ouro, Teatro Gacemss |
| Santa Cruz | This area offers a quieter, suburban vibe with lush green spaces and a close-knit community feel. It appeals to visitors looking for a peaceful retreat while still being close to the city amenities. | Parque da Cidade, Cascata do Moinho, Centro Cultural Jornalista Osvaldo Lima, Parque Natural Municipal |
| Vila Santa Rosa | Known for its residential atmosphere and local dining options, this neighborhood offers a unique local experience and is an emerging area for short-term rentals. | Beco do Batman, Mercado Municipal, Igreja São Sebastião, Lake of Vila Santa Rosa |
| Jardim Paraíba | A popular neighborhood among young families and professionals. It features parks and recreational areas, making it appealing to tourists seeking outdoor activities. | Praça Ana Furtado, Parque da Rua 11, Jardim Botânico, Local cafes and shops |
| Alto da Boa Vista | This area is known for its scenic views and is a bit more upscale. It attracts nature lovers and those who enjoy hiking and outdoor activities, making it ideal for eco-tourism. | Mirante do Alto, Parque da Cidade, Trilhas e Caminhadas, Recreational areas |
| Laranjal | A neighborhood known for its vibrant cultural scene and nightlife. It attracts younger crowds and those looking to experience the local culture and nightlife. | Bar da Rua, Cultural events, Local music venues, Restaurants and nightlife spots |
| Volta Redonda Industrial Area | Closer to industrial parks, this area is more commercial; however, it attracts business travelers and workers looking for short stays due to its proximity to industries. | Shopping centers nearby, Industrial tourism, Workspaces and business amenities |
Understanding Airbnb License Requirements & STR Laws in Volta Redonda (2026)
While Volta Redonda, Rio de Janeiro, Brazil currently shows low STR regulations, specific Airbnb license requirements might still exist or change. Always verify the latest short term rental regulations and Airbnb license requirements directly with local government authorities for Volta Redonda to ensure full compliance before hosting.
(Source: AirROI data, 2026, finding no licensed listings among those analyzed)
Top Performing Airbnb Properties in Volta Redonda (2026)
Benchmark your potential! Explore examples of top-performing Airbnb properties in Volta Redondabased on Trailing Twelve Month (TTM) revenue. Analyze their characteristics, revenue, occupancy rate, and ADR to understand what drives success in this market.
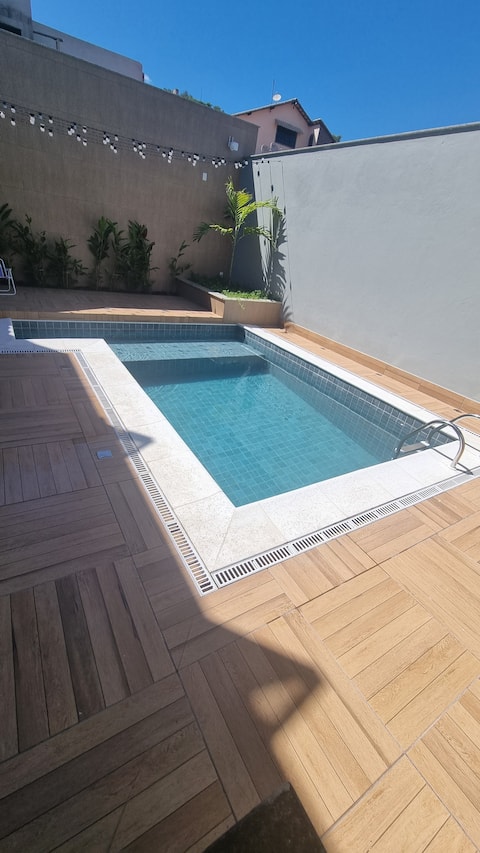
Modern home with pool.
Entire Place • 3 bedrooms
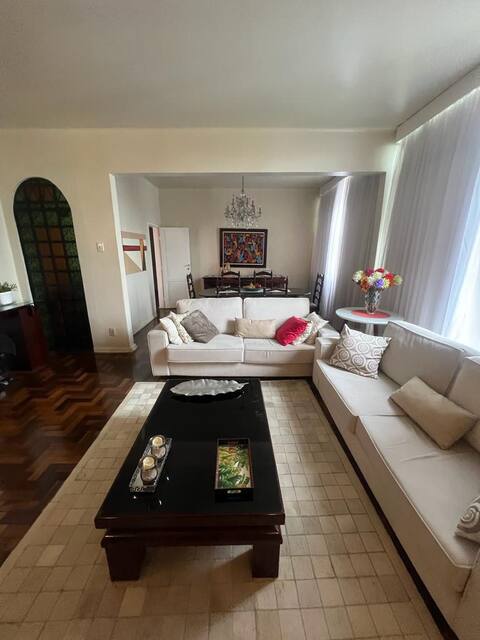
Luxury apartment in the best location!
Entire Place • 3 bedrooms
![Casa Refúgio do Vale *Unimed* [Valley Refuge House *Unimed*]](https://a0.muscache.com/im/pictures/hosting/Hosting-1286012141412041135/original/43a702e4-ebdd-4367-be15-76b8572f0202.jpeg?im_w=480&im_format=avif)
Casa Refúgio do Vale *Unimed* [Valley Refuge House *Unimed*]
Entire Place • 2 bedrooms

Ground floor apartment 1 - Jacarandá Pitanga
Entire Place • 2 bedrooms

Casa Cidade Nova, Jd. Belvedere.
Entire Place • 3 bedrooms

Modern and cozy flat VR-2
Entire Place • 1 bedroom
Note: Performance varies based on location, size, amenities, seasonality, and management quality. Data reflects the past 12 months.
Top Performing Airbnb Hosts in Volta Redonda (2026)
Learn from the best! This table showcases top-performing Airbnb hosts in Volta Redonda based on the number of properties managed and estimated total revenue over the past year. Analyze their scale and performance metrics.
| Host Name | Properties | Grossing Revenue | Stay Reviews | Avg Rating |
|---|---|---|---|---|
| Celso Anfitrião | 12 | $34,370 | 191 | 4.47/5.0 |
| Gustavo Guimarães | 1 | $31,046 | 7 | 5.00/5.0 |
| Aline Verneck | 14 | $25,860 | 220 | 4.51/5.0 |
| Celso Henrique | 5 | $16,254 | 278 | 4.47/5.0 |
| Samuel Nogueira | 2 | $16,093 | 172 | 4.92/5.0 |
| Cristiano | 3 | $14,662 | 67 | 4.88/5.0 |
| Lumy Hospedagens | 1 | $11,658 | 19 | 4.74/5.0 |
| Wellington | 2 | $11,263 | 68 | 4.89/5.0 |
| Keilla | 9 | $11,196 | 24 | 4.85/5.0 |
| Luís Carlos | 3 | $10,664 | 95 | 4.99/5.0 |
Analyzing the strategies of top hosts, such as their property selection, pricing, and guest communication, can offer valuable lessons for optimizing your own Airbnb operations in Volta Redonda.
Dive Deeper: Advanced Volta Redonda STR Market Data (2026)
Ready to unlock more insights? AirROI provides access to advanced metrics and comprehensive Airbnb data for Volta Redonda. Explore detailed analytics beyond this report to refine your investment strategy, optimize pricing, and maximize your vacation rental profits.
Explore Advanced MetricsVolta Redonda Short-Term Rental Market Composition (2026): Property & Room Types
Room Type Distribution
Property Type Distribution
Market Composition Insights for Volta Redonda
- The Volta Redonda Airbnb market composition is heavily skewed towards Entire Home/Apt listings, which make up 81.7% of the 120 active rentals. This indicates strong guest preference for privacy and space.
- Looking at the property type distribution in Volta Redonda, Apartment/Condo properties are the most common (69.2%), reflecting the local real estate landscape.
- Houses represent a significant 28.3% portion, catering likely to families or larger groups.
- Smaller segments like others, hotel/boutique (combined 2.5%) offer potential for unique stay experiences.
Volta Redonda Airbnb Room Capacity Analysis (2026): Bedroom Distribution
Distribution of Listings by Number of Bedrooms
Room Capacity Insights for Volta Redonda
- The dominant room capacity in Volta Redonda is 1 bedroom listings, making up 46.7% of the market. This suggests a strong demand for properties suitable for couples or solo travelers.
- Together, 1 bedroom and 2 bedrooms properties represent 70.9% of the active Airbnb listings in Volta Redonda, indicating a high concentration in these sizes.
- Listings with 3+ bedrooms (9.1%) represent a smaller niche, potentially indicating an underserved market for larger group accommodations in Volta Redonda.
Volta Redonda Vacation Rental Guest Capacity Trends (2026)
Distribution of Listings by Guest Capacity
Guest Capacity Insights for Volta Redonda
- The most common guest capacity trend in Volta Redonda vacation rentals is listings accommodating 2 guests (18.3%). This suggests the primary traveler segment is likely couples or solo travelers.
- Properties designed for 2 guests and 4 guests dominate the Volta Redonda STR market, accounting for 35.8% of listings.
- 17.5% of properties accommodate 6+ guests, serving the market segment for larger families or group travel in Volta Redonda.
- On average, properties in Volta Redonda are equipped to host 3.0 guests.
Volta Redonda Airbnb Booking Patterns (2026): Available vs. Booked Days
Available Days Distribution
Booked Days Distribution
Booking Pattern Insights for Volta Redonda
- The most common availability pattern in Volta Redonda falls within the 271-366 days range, representing 60.8% of listings. This suggests many properties have significant open periods on their calendars.
- Approximately 84.1% of listings show high availability (181+ days open annually), indicating potential for increased bookings or specific owner usage patterns.
- For booked days, the 31-90 days range is most frequent in Volta Redonda (33.3%), reflecting common guest stay durations or potential owner blocking patterns.
- A notable 18.3% of properties secure long booking periods (181+ days booked per year), highlighting successful long-term rental strategies or significant owner usage.
Volta Redonda Airbnb Minimum Stay Requirements Analysis
Distribution of Listings by Minimum Night Requirement
1 Night
58 listings
48.3% of total
2 Nights
17 listings
14.2% of total
3 Nights
5 listings
4.2% of total
7-29 Nights
9 listings
7.5% of total
30+ Nights
31 listings
25.8% of total
Key Insights
- The most prevalent minimum stay requirement in Volta Redonda is 1 Night, adopted by 48.3% of listings. This highlights the market's preference for shorter, flexible bookings.
- A strong majority (62.5%) of the Volta Redonda Airbnb data shows acceptance of very short stays (1-2 nights), indicating a dynamic, high-turnover market.
- A significant segment (25.8%) caters to monthly stays (30+ nights) in Volta Redonda, pointing to opportunities in the extended-stay market.
Recommendations
- Align with the market by considering a 1 Night minimum stay, as 48.3% of Volta Redonda hosts use this setting.
- Explore offering discounts for stays of 30+ nights to attract the 25.8% of the market seeking extended stays.
- Adjust minimum nights based on seasonality – potentially shorter during low season and longer during peak demand periods in Volta Redonda.
Volta Redonda Airbnb Cancellation Policy Trends Analysis (2026)
Super Strict 60 Days
3 listings
2.5% of total
Limited
5 listings
4.2% of total
Flexible
38 listings
31.9% of total
Moderate
33 listings
27.7% of total
Firm
22 listings
18.5% of total
Strict
18 listings
15.1% of total
Cancellation Policy Insights for Volta Redonda
- The prevailing Airbnb cancellation policy trend in Volta Redonda is Flexible, used by 31.9% of listings.
- There's a relatively balanced mix between guest-friendly (59.6%) and stricter (33.6%) policies, offering choices for different guest needs.
Recommendations for Hosts
- Consider adopting a Flexible policy to align with the 31.9% market standard in Volta Redonda.
- Regularly review your cancellation policy against competitors and market demand shifts in Volta Redonda.
Volta Redonda STR Booking Lead Time Analysis (2026)
Average Booking Lead Time by Month
Booking Lead Time Insights for Volta Redonda
- The overall average booking lead time for vacation rentals in Volta Redonda is 15 days.
- Guests book furthest in advance for stays during April (average 21 days), likely coinciding with peak travel demand or local events.
- The shortest booking windows occur for stays in October (average 10 days), indicating more last-minute travel plans during this time.
- Seasonally, Spring (17 days avg.) sees the longest lead times, while Fall (13 days avg.) has the shortest, reflecting typical travel planning cycles.
Recommendations for Hosts
- Use the overall average lead time (15 days) as a baseline for your pricing and availability strategy in Volta Redonda.
- Target marketing efforts for the Spring season well in advance (at least 17 days) to capture early planners.
- Monitor your own booking lead times against these Volta Redonda averages to identify opportunities for dynamic pricing adjustments.
Popular & Essential Airbnb Amenities in Volta Redonda (2026)
Amenity Prevalence
Amenity Insights for Volta Redonda
- Essential amenities in Volta Redonda that guests expect include: Wifi. Lacking these (this) could significantly impact bookings.
- Popular amenities like Kitchen, TV, Hot water are common but not universal. Offering these can provide a competitive edge.
Recommendations for Hosts
- Ensure your listing includes all essential amenities for Volta Redonda: Wifi.
- Prioritize adding missing essentials: Wifi.
- Consider adding popular differentiators like Kitchen or TV to increase appeal.
- Highlight unique or less common amenities you offer (e.g., hot tub, dedicated workspace, EV charger) in your listing description and photos.
- Regularly check competitor amenities in Volta Redonda to stay competitive.
Volta Redonda Airbnb Guest Demographics & Profile Analysis (2026)
Guest Profile Summary for Volta Redonda
- The typical guest profile for Airbnb in Volta Redonda consists of primarily domestic travelers (96%), often arriving from nearby Rio de Janeiro, typically belonging to the Post-2000s (Gen Z/Alpha) group (50%), primarily speaking Portuguese or English.
- Domestic travelers account for 95.8% of guests.
- Key international markets include Brazil (95.8%) and United States (2.2%).
- Top languages spoken are Portuguese (50.6%) followed by English (30%).
- A significant demographic segment is the Post-2000s (Gen Z/Alpha) group, representing 50% of guests.
Recommendations for Hosts
- Target domestic marketing efforts towards travelers from Rio de Janeiro and São Paulo.
- Tailor amenities and listing descriptions to appeal to the dominant Post-2000s (Gen Z/Alpha) demographic (e.g., highlight fast WiFi, smart home features, local guides).
- Highlight unique local experiences or amenities relevant to the primary guest profile.
- Consider seasonal promotions aligned with peak travel times for key origin markets.
Nearby Short-Term Rental Market Comparison
How does the Volta Redonda Airbnb market stack up against its neighbors? Compare key performance metrics like average monthly revenue, ADR, and occupancy rates in surrounding areas to understand the broader regional STR landscape.
| Market | Active Properties | Monthly Revenue | Daily Rate | Avg. Occupancy |
|---|---|---|---|---|
| Ilha Grande | 11 | $1,783 | $166.42 | 38% |
| Areal | 82 | $1,532 | $198.25 | 30% |
| Queluz | 17 | $1,291 | $152.05 | 30% |
| Brazópolis | 21 | $1,209 | $152.11 | 29% |
| Santa Branca | 53 | $1,138 | $195.49 | 25% |
| Jambeiro | 22 | $1,135 | $185.50 | 24% |
| São Sebastião | 6,175 | $1,114 | $188.11 | 28% |
| Rio de Janeiro | 27,660 | $1,085 | $106.45 | 43% |
| Angra dos Reis | 2,446 | $1,017 | $158.25 | 33% |
| Paraisópolis | 104 | $1,004 | $108.16 | 32% |