São Gonçalo Airbnb Market Analysis 2026: Short Term Rental Data & Vacation Rental Statistics in Rio de Janeiro, Brazil
Is Airbnb profitable in São Gonçalo in 2026? Explore comprehensive Airbnb analytics for São Gonçalo, Rio de Janeiro, Brazil to uncover income potential. This 2026 STR market report for São Gonçalo, based on AirROI data from February 2025 to January 2026, reveals key trends in the niche market of 22 active listings.
Whether you're considering an Airbnb investment in São Gonçalo, optimizing your existing vacation rental, or exploring rental arbitrage opportunities, understanding the São Gonçalo Airbnb data is crucial. Leveraging the low regulation environment is key to maximizing your short term rental income potential. Let's dive into the specifics.
Key São Gonçalo Airbnb Performance Metrics Overview
Monthly Airbnb Revenue Variations & Income Potential in São Gonçalo (2026)
Understanding the monthly revenue variations for Airbnb listings in São Gonçalo is key to maximizing your short term rental income potential. Seasonality significantly impacts earnings. Our analysis, based on data from the past 12 months, shows that the peak revenue month for STRs in São Gonçalo is typically April, while February often presents the lowest earnings, highlighting opportunities for strategic pricing adjustments during shoulder and low seasons. Explore the typical Airbnb income in São Gonçalo across different performance tiers:
- Best-in-class properties (Top 10%) achieve $992+ monthly, often utilizing dynamic pricing and superior guest experiences.
- Strong performing properties (Top 25%) earn $588 or more, indicating effective management and desirable locations/amenities.
- Typical properties (Median) generate around $299 per month, representing the average market performance.
- Entry-level properties (Bottom 25%) see earnings around $127, often with potential for optimization.
Average Monthly Airbnb Earnings Trend in São Gonçalo
São Gonçalo Airbnb Occupancy Rate Trends (2026)
Maximize your bookings by understanding the São Gonçalo STR occupancy trends. Seasonal demand shifts significantly influence how often properties are booked. Typically, Aprilsees the highest demand (peak season occupancy), while January experiences the lowest (low season). Effective strategies, like adjusting minimum stays or offering promotions, can boost occupancy during slower periods. Here's how different property tiers perform in São Gonçalo:
- Best-in-class properties (Top 10%) achieve 70%+ occupancy, indicating high desirability and potentially optimized availability.
- Strong performing properties (Top 25%) maintain 51% or higher occupancy, suggesting good market fit and guest satisfaction.
- Typical properties (Median) have an occupancy rate around 28%.
- Entry-level properties (Bottom 25%) average 11% occupancy, potentially facing higher vacancy.
Average Monthly Occupancy Rate Trend in São Gonçalo
Average Daily Rate (ADR) Airbnb Trends in São Gonçalo (2026)
Effective short term rental pricing strategy in São Gonçalo involves understanding monthly ADR fluctuations. The Average Daily Rate (ADR) for Airbnb in São Gonçalo typically peaks in September and dips lowest during February. Leveraging Airbnb dynamic pricing tools or strategies based on this seasonality can significantly boost revenue. Here's a look at the typical nightly rates achieved:
- Best-in-class properties (Top 10%) command rates of $102+ per night, often due to premium features or locations.
- Strong performing properties (Top 25%) achieve nightly rates of $46 or more.
- Typical properties (Median) charge around $32 per night.
- Entry-level properties (Bottom 25%) earn around $27 per night.
Average Daily Rate (ADR) Trend by Month in São Gonçalo
Get Live São Gonçalo Market Intelligence 👇

Explore Real-time Analytics
Airbnb Seasonality Analysis & Trends in São Gonçalo (2026)
Peak Season (April, May, December)
- Revenue averages $533 per month
- Occupancy rates average 40.6%
- Daily rates average $45
Shoulder Season
- Revenue averages $434 per month
- Occupancy maintains around 31.6%
- Daily rates hold near $45
Low Season (February, August, September)
- Revenue drops to average $318 per month
- Occupancy decreases to average 28.0%
- Daily rates adjust to average $47
Seasonality Insights for São Gonçalo
- The Airbnb seasonality in São Gonçalo shows moderate seasonality with distinct peak and low periods. While the sections above show seasonal averages, it's also insightful to look at the extremes:
- During the high season, the absolute peak month showcases São Gonçalo's highest earning potential, with monthly revenues capable of climbing to $601, occupancy reaching a high of 44.0%, and ADRs peaking at $50.
- Conversely, the slowest single month of the year, typically falling within the low season, marks the market's lowest point. In this month, revenue might dip to $309, occupancy could drop to 26.2%, and ADRs may adjust down to $43.
- Understanding both the seasonal averages and these monthly peaks and troughs in revenue, occupancy, and ADR is crucial for maximizing your Airbnb profit potential in São Gonçalo.
Seasonal Strategies for Maximizing Profit
- Peak Season: Maximize revenue through premium pricing and potentially longer minimum stays. Ensure high availability.
- Low Season: Offer competitive pricing, special promotions (e.g., extended stay discounts), and flexible cancellation policies. Target off-season travelers like remote workers or budget-conscious guests.
- Shoulder Seasons: Implement dynamic pricing that balances peak and low rates. Target weekend travelers or specific events. Offer slightly more flexible terms than peak season.
- Regularly analyze your own performance against these São Gonçalo seasonality benchmarks and adjust your pricing and availability strategy accordingly.
Best Areas for Airbnb Investment in São Gonçalo (2026)
Exploring the top neighborhoods for short-term rentals in São Gonçalo? This section highlights key areas, outlining why they are attractive for hosts and guests, along with notable local attractions. Consider these locations based on your target guest profile and investment strategy.
| Neighborhood / Area | Why Host Here? (Target Guests & Appeal) | Key Attractions & Landmarks |
|---|---|---|
| Jardim Carvalho | A vibrant neighborhood with a mix of local culture and modern amenities. Great for families and offers easy access to parks and shopping areas. | Shopping Promenade, Parks and green areas, Local dining options, Cultural events, Community activities |
| Cacique | Known for its affordability and proximity to various amenities. Attracts budget-conscious travelers and families seeking longer stays. | Affordable local markets, Public parks, Community centers, Cultural festivals, Easy public transport access |
| Cohab | A growing area with new developments and infrastructure improvements. Perfect for visitors looking for a quieter stay yet still close to the city. | New shopping centers, Local eateries, Parks, Community art initiatives, Public transport links |
| Lindo Parque | Offers a mix of residential and leisure spaces, making it appealing for travelers seeking a more laid-back environment with easy access to city attractions. | Local parks, Leisure centers, Residential amenities, Community events, Shuttle services to major attractions |
| São Gonçalo Centro | The heart of the city with numerous shops, restaurants, and cultural sites. Ideal for visitors wanting an authentic city experience with everything nearby. | Historic landmarks, Shopping streets, Local restaurants, Cultural sites, Public transport hub |
| Porto da Pedra | An area known for its cultural richness and local festivities, attracting tourists interested in experiencing the culture of São Gonçalo. | Cultural festivals, Local markets, Samba schools, Art galleries, Historical sites |
| Neves | A neighborhood with a community spirit and growing tourist interest. Offers a diverse local experience while being accessible to larger city attractions. | Neighborhood events, Public parks, Local cuisine, Shopping options, Art and culture initiatives |
| Almerinda | An emerging area with affordable housing and great access to public transport. It is becoming popular among tourists looking for budget-friendly options. | Local markets, Shopping centers, Community parks, Cultural activities, Public transport access |
Understanding Airbnb License Requirements & STR Laws in São Gonçalo (2026)
While São Gonçalo, Rio de Janeiro, Brazil currently shows low STR regulations, specific Airbnb license requirements might still exist or change. Always verify the latest short term rental regulations and Airbnb license requirements directly with local government authorities for São Gonçalo to ensure full compliance before hosting.
(Source: AirROI data, 2026, finding no licensed listings among those analyzed)
Top Performing Airbnb Properties in São Gonçalo (2026)
Benchmark your potential! Explore examples of top-performing Airbnb properties in São Gonçalobased on Trailing Twelve Month (TTM) revenue. Analyze their characteristics, revenue, occupancy rate, and ADR to understand what drives success in this market.
House in a rural area
Entire Place • 5 bedrooms
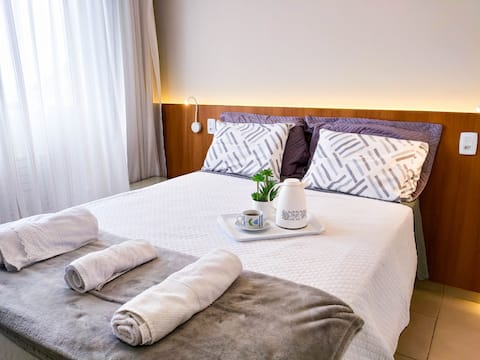
Beautiful apartment in the center of São Gonçalo
Entire Place • 2 bedrooms

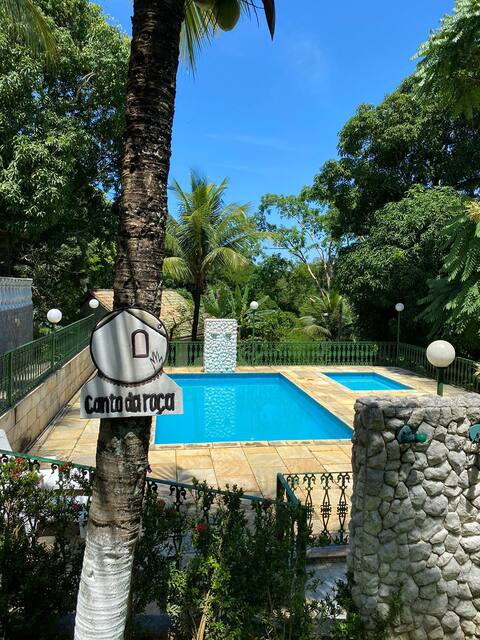
Beautiful house with a pool.
Entire Place • 1 bedroom
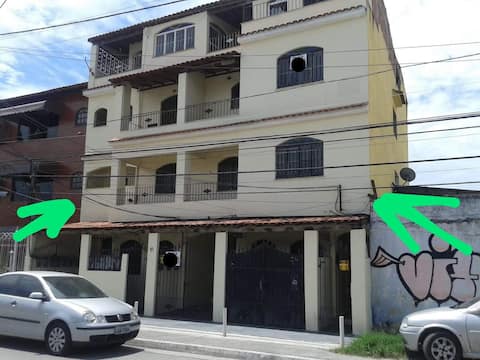
2 bedroom apartment with garage and balcony, facing a ventilated area.
Entire Place • 2 bedrooms

"Home Sweet Home in Alcântara"
Entire Place • 2 bedrooms
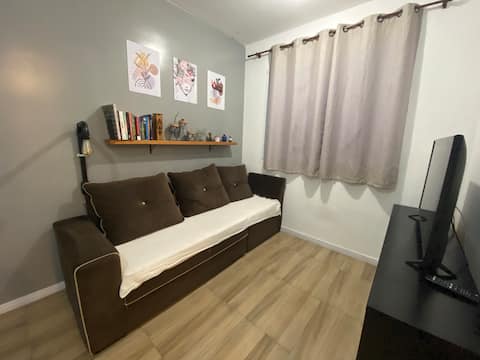
Comfortable apartment near the Rio/Niterói bridge
Entire Place • 1 bedroom
Note: Performance varies based on location, size, amenities, seasonality, and management quality. Data reflects the past 12 months.
Top Performing Airbnb Hosts in São Gonçalo (2026)
Learn from the best! This table showcases top-performing Airbnb hosts in São Gonçalo based on the number of properties managed and estimated total revenue over the past year. Analyze their scale and performance metrics.
| Host Name | Properties | Grossing Revenue | Stay Reviews | Avg Rating |
|---|---|---|---|---|
| Victoria | 1 | $13,519 | 12 | 5.00/5.0 |
| Gil Fernandes | 6 | $11,456 | 40 | 4.62/5.0 |
| Luiz | 1 | $7,957 | 135 | 4.93/5.0 |
| Helio Victor | 2 | $6,312 | 59 | 4.88/5.0 |
| Ana Lúcia | 1 | $5,781 | 130 | 4.98/5.0 |
| Dualy | 1 | $5,037 | 40 | 4.95/5.0 |
| Marcela Azeredo | 2 | $4,968 | 19 | 5.00/5.0 |
| Gilcar | 1 | $4,208 | 1 | Not Rated |
| Dalva | 1 | $3,732 | 2 | Not Rated |
| Alba | 1 | $2,071 | 65 | 4.80/5.0 |
Analyzing the strategies of top hosts, such as their property selection, pricing, and guest communication, can offer valuable lessons for optimizing your own Airbnb operations in São Gonçalo.
Dive Deeper: Advanced São Gonçalo STR Market Data (2026)
Ready to unlock more insights? AirROI provides access to advanced metrics and comprehensive Airbnb data for São Gonçalo. Explore detailed analytics beyond this report to refine your investment strategy, optimize pricing, and maximize your vacation rental profits.
Explore Advanced MetricsSão Gonçalo Short-Term Rental Market Composition (2026): Property & Room Types
Room Type Distribution
Property Type Distribution
Market Composition Insights for São Gonçalo
- The São Gonçalo Airbnb market composition is heavily skewed towards Entire Home/Apt listings, which make up 95.5% of the 22 active rentals. This indicates strong guest preference for privacy and space.
- Looking at the property type distribution in São Gonçalo, Apartment/Condo properties are the most common (59.1%), reflecting the local real estate landscape.
- Houses represent a significant 36.4% portion, catering likely to families or larger groups.
- Smaller segments like hotel/boutique (combined 4.5%) offer potential for unique stay experiences.
São Gonçalo Airbnb Room Capacity Analysis (2026): Bedroom Distribution
Distribution of Listings by Number of Bedrooms
Room Capacity Insights for São Gonçalo
- The dominant room capacity in São Gonçalo is 2 bedrooms listings, making up 50% of the market. This suggests a strong demand for properties suitable for couples or solo travelers.
- Together, 2 bedrooms and 1 bedroom properties represent 86.4% of the active Airbnb listings in São Gonçalo, indicating a high concentration in these sizes.
- Listings with 3+ bedrooms (9.0%) represent a smaller niche, potentially indicating an underserved market for larger group accommodations in São Gonçalo.
São Gonçalo Vacation Rental Guest Capacity Trends (2026)
Distribution of Listings by Guest Capacity
Guest Capacity Insights for São Gonçalo
- The most common guest capacity trend in São Gonçalo vacation rentals is listings accommodating 3 guests (31.8%). This suggests the primary traveler segment is likely small families or groups.
- Properties designed for 3 guests and 6 guests dominate the São Gonçalo STR market, accounting for 50.0% of listings.
- 36.4% of properties accommodate 6+ guests, serving the market segment for larger families or group travel in São Gonçalo.
- On average, properties in São Gonçalo are equipped to host 4.4 guests.
São Gonçalo Airbnb Booking Patterns (2026): Available vs. Booked Days
Available Days Distribution
Booked Days Distribution
Booking Pattern Insights for São Gonçalo
- The most common availability pattern in São Gonçalo falls within the 271-366 days range, representing 72.7% of listings. This suggests many properties have significant open periods on their calendars.
- Approximately 100.0% of listings show high availability (181+ days open annually), indicating potential for increased bookings or specific owner usage patterns.
- For booked days, the 31-90 days range is most frequent in São Gonçalo (45.5%), reflecting common guest stay durations or potential owner blocking patterns.
- A notable 4.5% of properties secure long booking periods (181+ days booked per year), highlighting successful long-term rental strategies or significant owner usage.
São Gonçalo Airbnb Minimum Stay Requirements Analysis
Distribution of Listings by Minimum Night Requirement
1 Night
7 listings
31.8% of total
2 Nights
4 listings
18.2% of total
3 Nights
1 listings
4.5% of total
4-6 Nights
1 listings
4.5% of total
7-29 Nights
4 listings
18.2% of total
30+ Nights
5 listings
22.7% of total
Key Insights
- The most prevalent minimum stay requirement in São Gonçalo is 1 Night, adopted by 31.8% of listings. This highlights the market's preference for shorter, flexible bookings.
- A significant segment (22.7%) caters to monthly stays (30+ nights) in São Gonçalo, pointing to opportunities in the extended-stay market.
Recommendations
- Align with the market by considering a 1 Night minimum stay, as 31.8% of São Gonçalo hosts use this setting.
- Explore offering discounts for stays of 30+ nights to attract the 22.7% of the market seeking extended stays.
- Adjust minimum nights based on seasonality – potentially shorter during low season and longer during peak demand periods in São Gonçalo.
São Gonçalo Airbnb Cancellation Policy Trends Analysis (2026)
Flexible
7 listings
31.8% of total
Moderate
3 listings
13.6% of total
Firm
11 listings
50% of total
Strict
1 listings
4.5% of total
Cancellation Policy Insights for São Gonçalo
- The prevailing Airbnb cancellation policy trend in São Gonçalo is Firm, used by 50% of listings.
- A majority (54.5%) of hosts in São Gonçalo utilize Firm or Strict policies, indicating a market where hosts prioritize booking security.
- Strict cancellation policies are quite rare (4.5%), potentially making listings with this policy less competitive unless justified by high demand or property type.
Recommendations for Hosts
- Consider adopting a Firm policy to align with the 50% market standard in São Gonçalo.
- Using a Strict policy might deter some guests, as only 4.5% of listings use it. Evaluate if potential revenue protection outweighs possible lower booking rates.
- Regularly review your cancellation policy against competitors and market demand shifts in São Gonçalo.
São Gonçalo STR Booking Lead Time Analysis (2026)
Average Booking Lead Time by Month
Booking Lead Time Insights for São Gonçalo
- The overall average booking lead time for vacation rentals in São Gonçalo is 15 days.
- Guests book furthest in advance for stays during April (average 32 days), likely coinciding with peak travel demand or local events.
- The shortest booking windows occur for stays in August (average 8 days), indicating more last-minute travel plans during this time.
- Seasonally, Spring (23 days avg.) sees the longest lead times, while Winter (15 days avg.) has the shortest, reflecting typical travel planning cycles.
Recommendations for Hosts
- Use the overall average lead time (15 days) as a baseline for your pricing and availability strategy in São Gonçalo.
- For April stays, consider implementing length-of-stay discounts or slightly higher rates for bookings made less than 32 days out to capitalize on advance planning.
- Target marketing efforts for the Spring season well in advance (at least 23 days) to capture early planners.
- Monitor your own booking lead times against these São Gonçalo averages to identify opportunities for dynamic pricing adjustments.
Popular & Essential Airbnb Amenities in São Gonçalo (2026)
Amenity Prevalence
Amenity Insights for São Gonçalo
- Essential amenities in São Gonçalo that guests expect include: TV, Wifi. Lacking these (any) could significantly impact bookings.
- Popular amenities like Kitchen, Bed linens, Free parking on premises are common but not universal. Offering these can provide a competitive edge.
Recommendations for Hosts
- Ensure your listing includes all essential amenities for São Gonçalo: TV, Wifi.
- Prioritize adding missing essentials: TV, Wifi.
- Consider adding popular differentiators like Kitchen or Bed linens to increase appeal.
- Highlight unique or less common amenities you offer (e.g., hot tub, dedicated workspace, EV charger) in your listing description and photos.
- Regularly check competitor amenities in São Gonçalo to stay competitive.
São Gonçalo Airbnb Guest Demographics & Profile Analysis (2026)
Guest Profile Summary for São Gonçalo
- The typical guest profile for Airbnb in São Gonçalo consists of primarily domestic travelers (90%), often arriving from nearby Rio de Janeiro, typically belonging to the Post-2000s (Gen Z/Alpha) group (50%), primarily speaking Portuguese or English.
- Domestic travelers account for 90.2% of guests.
- Key international markets include Brazil (90.2%) and France (3.9%).
- Top languages spoken are Portuguese (56.8%) followed by English (27%).
- A significant demographic segment is the Post-2000s (Gen Z/Alpha) group, representing 50% of guests.
Recommendations for Hosts
- Target domestic marketing efforts towards travelers from Rio de Janeiro and São Paulo.
- Tailor amenities and listing descriptions to appeal to the dominant Post-2000s (Gen Z/Alpha) demographic (e.g., highlight fast WiFi, smart home features, local guides).
- Highlight unique local experiences or amenities relevant to the primary guest profile.
- Consider seasonal promotions aligned with peak travel times for key origin markets.
Nearby Short-Term Rental Market Comparison
How does the São Gonçalo Airbnb market stack up against its neighbors? Compare key performance metrics like average monthly revenue, ADR, and occupancy rates in surrounding areas to understand the broader regional STR landscape.
| Market | Active Properties | Monthly Revenue | Daily Rate | Avg. Occupancy |
|---|---|---|---|---|
| Ilha Grande | 11 | $1,783 | $166.42 | 38% |
| Areal | 82 | $1,532 | $198.25 | 30% |
| Queluz | 17 | $1,291 | $152.05 | 30% |
| Rio de Janeiro | 27,660 | $1,085 | $106.45 | 43% |
| Angra dos Reis | 2,446 | $1,017 | $158.25 | 33% |
| Petrópolis | 2,096 | $964 | $143.70 | 27% |
| Paraíba do Sul | 49 | $930 | $208.87 | 25% |
| Ijaci | 16 | $792 | $140.06 | 28% |
| Itanhandu | 31 | $788 | $108.00 | 22% |
| Guapimirim | 142 | $778 | $123.54 | 27% |