Nova Iguaçu Airbnb Market Analysis 2026: Short Term Rental Data & Vacation Rental Statistics in Rio de Janeiro, Brazil
Is Airbnb profitable in Nova Iguaçu in 2026? Explore comprehensive Airbnb analytics for Nova Iguaçu, Rio de Janeiro, Brazil to uncover income potential. This 2026 STR market report for Nova Iguaçu, based on AirROI data from February 2025 to January 2026, reveals key trends in the niche market of 50 active listings.
Whether you're considering an Airbnb investment in Nova Iguaçu, optimizing your existing vacation rental, or exploring rental arbitrage opportunities, understanding the Nova Iguaçu Airbnb data is crucial. Leveraging the low regulation environment is key to maximizing your short term rental income potential. Let's dive into the specifics.
Key Nova Iguaçu Airbnb Performance Metrics Overview
Monthly Airbnb Revenue Variations & Income Potential in Nova Iguaçu (2026)
Understanding the monthly revenue variations for Airbnb listings in Nova Iguaçu is key to maximizing your short term rental income potential. Seasonality significantly impacts earnings. Our analysis, based on data from the past 12 months, shows that the peak revenue month for STRs in Nova Iguaçu is typically December, while August often presents the lowest earnings, highlighting opportunities for strategic pricing adjustments during shoulder and low seasons. Explore the typical Airbnb income in Nova Iguaçu across different performance tiers:
- Best-in-class properties (Top 10%) achieve $720+ monthly, often utilizing dynamic pricing and superior guest experiences.
- Strong performing properties (Top 25%) earn $476 or more, indicating effective management and desirable locations/amenities.
- Typical properties (Median) generate around $268 per month, representing the average market performance.
- Entry-level properties (Bottom 25%) see earnings around $122, often with potential for optimization.
Average Monthly Airbnb Earnings Trend in Nova Iguaçu
Nova Iguaçu Airbnb Occupancy Rate Trends (2026)
Maximize your bookings by understanding the Nova Iguaçu STR occupancy trends. Seasonal demand shifts significantly influence how often properties are booked. Typically, Februarysees the highest demand (peak season occupancy), while August experiences the lowest (low season). Effective strategies, like adjusting minimum stays or offering promotions, can boost occupancy during slower periods. Here's how different property tiers perform in Nova Iguaçu:
- Best-in-class properties (Top 10%) achieve 68%+ occupancy, indicating high desirability and potentially optimized availability.
- Strong performing properties (Top 25%) maintain 50% or higher occupancy, suggesting good market fit and guest satisfaction.
- Typical properties (Median) have an occupancy rate around 29%.
- Entry-level properties (Bottom 25%) average 13% occupancy, potentially facing higher vacancy.
Average Monthly Occupancy Rate Trend in Nova Iguaçu
Average Daily Rate (ADR) Airbnb Trends in Nova Iguaçu (2026)
Effective short term rental pricing strategy in Nova Iguaçu involves understanding monthly ADR fluctuations. The Average Daily Rate (ADR) for Airbnb in Nova Iguaçu typically peaks in December and dips lowest during February. Leveraging Airbnb dynamic pricing tools or strategies based on this seasonality can significantly boost revenue. Here's a look at the typical nightly rates achieved:
- Best-in-class properties (Top 10%) command rates of $82+ per night, often due to premium features or locations.
- Strong performing properties (Top 25%) achieve nightly rates of $40 or more.
- Typical properties (Median) charge around $32 per night.
- Entry-level properties (Bottom 25%) earn around $23 per night.
Average Daily Rate (ADR) Trend by Month in Nova Iguaçu
Get Live Nova Iguaçu Market Intelligence 👇

Explore Real-time Analytics
Airbnb Seasonality Analysis & Trends in Nova Iguaçu (2026)
Peak Season (December, March, October)
- Revenue averages $434 per month
- Occupancy rates average 38.7%
- Daily rates average $42
Shoulder Season
- Revenue averages $343 per month
- Occupancy maintains around 33.6%
- Daily rates hold near $38
Low Season (April, May, August)
- Revenue drops to average $285 per month
- Occupancy decreases to average 29.1%
- Daily rates adjust to average $36
Seasonality Insights for Nova Iguaçu
- The Airbnb seasonality in Nova Iguaçu shows highly seasonal trends requiring careful strategy. While the sections above show seasonal averages, it's also insightful to look at the extremes:
- During the high season, the absolute peak month showcases Nova Iguaçu's highest earning potential, with monthly revenues capable of climbing to $515, occupancy reaching a high of 42.9%, and ADRs peaking at $46.
- Conversely, the slowest single month of the year, typically falling within the low season, marks the market's lowest point. In this month, revenue might dip to $267, occupancy could drop to 25.9%, and ADRs may adjust down to $34.
- Understanding both the seasonal averages and these monthly peaks and troughs in revenue, occupancy, and ADR is crucial for maximizing your Airbnb profit potential in Nova Iguaçu.
Seasonal Strategies for Maximizing Profit
- Peak Season: Maximize revenue through premium pricing and potentially longer minimum stays. Ensure high availability.
- Low Season: Offer competitive pricing, special promotions (e.g., extended stay discounts), and flexible cancellation policies. Target off-season travelers like remote workers or budget-conscious guests.
- Shoulder Seasons: Implement dynamic pricing that balances peak and low rates. Target weekend travelers or specific events. Offer slightly more flexible terms than peak season.
- Regularly analyze your own performance against these Nova Iguaçu seasonality benchmarks and adjust your pricing and availability strategy accordingly.
Best Areas for Airbnb Investment in Nova Iguaçu (2026)
Exploring the top neighborhoods for short-term rentals in Nova Iguaçu? This section highlights key areas, outlining why they are attractive for hosts and guests, along with notable local attractions. Consider these locations based on your target guest profile and investment strategy.
| Neighborhood / Area | Why Host Here? (Target Guests & Appeal) | Key Attractions & Landmarks |
|---|---|---|
| Centro | The bustling downtown area of Nova Iguaçu, offering a blend of culture, commerce, and transportation options. Ideal for business travelers and tourists looking to explore the city. | Igreja de Nossa Senhora da Penha, Teatro Sylvio Monteiro, Shopping Nova Iguaçu, Praça dos direitos humanos, Fábrica do Som |
| Iguaçu Riverfront | Scenic area along the Iguaçu River offering outdoor activities and beautiful views. Perfect for nature lovers and those seeking a peaceful retreat close to city amenities. | Parque Natural Municipal de Nova Iguaçu, Riverfront parks, Iguassu Waterfalls, Biking trails, Scenic viewpoints |
| Jardim Anastácio | A residential neighborhood that is gaining popularity due to its family-friendly environment and close proximity to schools and shops. A great area for longer-term stays. | Local parks, Community centers, Shopping options, Restaurants, Cultural events |
| Nova Iguaçu Shopping | Home to one of the largest shopping malls in the region, attracting shoppers and entertainment seekers alike. Ideal for tourists looking for a mix of shopping and leisure. | Cinema, Food court, Retail stores, Family entertainment options, Event spaces |
| Hudson | A growing neighborhood known for good public transport links and diverse dining options. It is a key commuter area for those traveling to Rio de Janeiro. | Local restaurants, Parks, Easy access to public transport, Community activities, Local festivals |
| Parque Ipanema | A well-planned residential area with parks and green spaces, appealing to families and tourists who want a quiet yet vibrant atmosphere. | Parque Ipanema, Cafés, Local markets, Community events, Recreational facilities |
| Santo Antonio | Known for its blend of urban and rural living, this area attracts those looking for a quieter lifestyle while still being close to urban amenities. | Local farms, Marketplaces, Parks, Cultural sights, Historical landmarks |
| Cascadura | A fast-developing region with access to good infrastructure and local amenities, appealing to both locals and tourists for its convenience and accessibility. | Shopping areas, Transport options, Local eateries, Parks, Community engagement activities |
Understanding Airbnb License Requirements & STR Laws in Nova Iguaçu (2026)
While Nova Iguaçu, Rio de Janeiro, Brazil currently shows low STR regulations, specific Airbnb license requirements might still exist or change. Always verify the latest short term rental regulations and Airbnb license requirements directly with local government authorities for Nova Iguaçu to ensure full compliance before hosting.
(Source: AirROI data, 2026, based on 2% licensed listings)
Top Performing Airbnb Properties in Nova Iguaçu (2026)
Benchmark your potential! Explore examples of top-performing Airbnb properties in Nova Iguaçubased on Trailing Twelve Month (TTM) revenue. Analyze their characteristics, revenue, occupancy rate, and ADR to understand what drives success in this market.

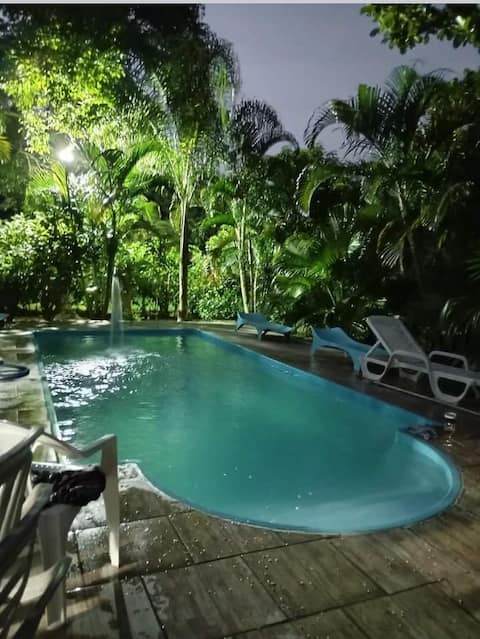
House with swimming pool in a quiet neighborhood in Nova Iguaçu
Entire Place • 1 bedroom
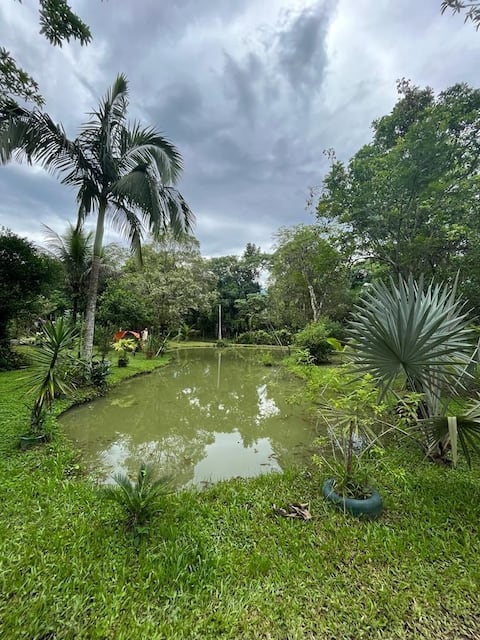
great place with beautiful lake
Entire Place • 4 bedrooms
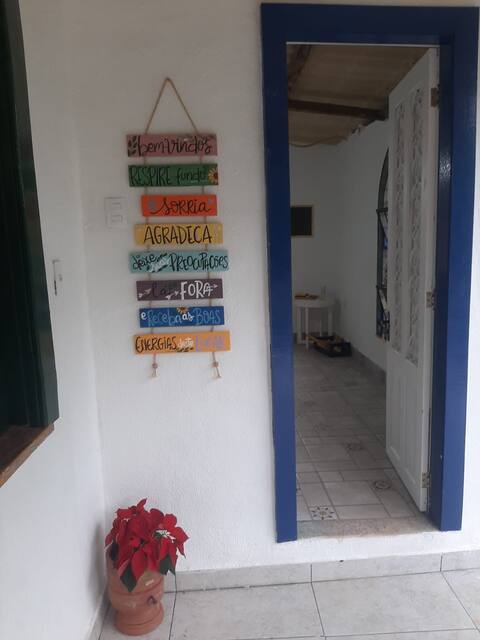
Sítio Amanhecer, a haven of peace! Groups only!
Private Room • 3 bedrooms

Cozy house with private pool in Tinguá
Entire Place • 2 bedrooms
A farm in the midst of nature.
Entire Place • 2 bedrooms

Lovely Loft/tiny house, Wellness, AR+Wi-Fi+TV
Entire Place • 1 bedroom
Note: Performance varies based on location, size, amenities, seasonality, and management quality. Data reflects the past 12 months.
Top Performing Airbnb Hosts in Nova Iguaçu (2026)
Learn from the best! This table showcases top-performing Airbnb hosts in Nova Iguaçu based on the number of properties managed and estimated total revenue over the past year. Analyze their scale and performance metrics.
| Host Name | Properties | Grossing Revenue | Stay Reviews | Avg Rating |
|---|---|---|---|---|
| Emanoel | 4 | $14,316 | 125 | 4.91/5.0 |
| Jorge Luiz | 2 | $12,837 | 11 | 5.00/5.0 |
| Jocimar Bruno | 1 | $11,637 | 86 | 4.94/5.0 |
| João Freitas | 1 | $10,212 | 36 | 4.86/5.0 |
| Areta Guimarães | 2 | $10,011 | 111 | 4.95/5.0 |
| Glaucio | 1 | $9,014 | 6 | 5.00/5.0 |
| Cassio | 2 | $8,861 | 95 | 4.41/5.0 |
| Jannayna Michelle | 1 | $8,753 | 27 | 5.00/5.0 |
| Joao | 4 | $5,141 | 99 | 4.56/5.0 |
| João Maria | 5 | $4,856 | 98 | 4.83/5.0 |
Analyzing the strategies of top hosts, such as their property selection, pricing, and guest communication, can offer valuable lessons for optimizing your own Airbnb operations in Nova Iguaçu.
Dive Deeper: Advanced Nova Iguaçu STR Market Data (2026)
Ready to unlock more insights? AirROI provides access to advanced metrics and comprehensive Airbnb data for Nova Iguaçu. Explore detailed analytics beyond this report to refine your investment strategy, optimize pricing, and maximize your vacation rental profits.
Explore Advanced MetricsNova Iguaçu Short-Term Rental Market Composition (2026): Property & Room Types
Room Type Distribution
Property Type Distribution
Market Composition Insights for Nova Iguaçu
- The Nova Iguaçu Airbnb market composition is heavily skewed towards Entire Home/Apt listings, which make up 72% of the 50 active rentals. This indicates strong guest preference for privacy and space.
- Looking at the property type distribution in Nova Iguaçu, House properties are the most common (46%), reflecting the local real estate landscape.
- Houses represent a significant 46% portion, catering likely to families or larger groups.
- The presence of 16% Hotel/Boutique listings indicates integration with traditional hospitality.
- Smaller segments like outdoor/unique (combined 2.0%) offer potential for unique stay experiences.
Nova Iguaçu Airbnb Room Capacity Analysis (2026): Bedroom Distribution
Distribution of Listings by Number of Bedrooms
Room Capacity Insights for Nova Iguaçu
- The dominant room capacity in Nova Iguaçu is 1 bedroom listings, making up 70% of the market. This suggests a strong demand for properties suitable for couples or solo travelers.
- Together, 1 bedroom and 2 bedrooms properties represent 84.0% of the active Airbnb listings in Nova Iguaçu, indicating a high concentration in these sizes.
- With over half the market (70%) consisting of studios or 1-bedroom units, Nova Iguaçu is particularly well-suited for individuals or couples.
- Listings with 3+ bedrooms (6.0%) represent a smaller niche, potentially indicating an underserved market for larger group accommodations in Nova Iguaçu.
Nova Iguaçu Vacation Rental Guest Capacity Trends (2026)
Distribution of Listings by Guest Capacity
Guest Capacity Insights for Nova Iguaçu
- The most common guest capacity trend in Nova Iguaçu vacation rentals is listings accommodating 2 guests (34%). This suggests the primary traveler segment is likely couples or solo travelers.
- Properties designed for 2 guests and 3 guests dominate the Nova Iguaçu STR market, accounting for 52.0% of listings.
- 16.0% of properties accommodate 6+ guests, serving the market segment for larger families or group travel in Nova Iguaçu.
- On average, properties in Nova Iguaçu are equipped to host 3.0 guests.
Nova Iguaçu Airbnb Booking Patterns (2026): Available vs. Booked Days
Available Days Distribution
Booked Days Distribution
Booking Pattern Insights for Nova Iguaçu
- The most common availability pattern in Nova Iguaçu falls within the 271-366 days range, representing 64% of listings. This suggests many properties have significant open periods on their calendars.
- Approximately 90.0% of listings show high availability (181+ days open annually), indicating potential for increased bookings or specific owner usage patterns.
- For booked days, the 1-30 days range is most frequent in Nova Iguaçu (32%), reflecting common guest stay durations or potential owner blocking patterns.
- A notable 10.0% of properties secure long booking periods (181+ days booked per year), highlighting successful long-term rental strategies or significant owner usage.
Nova Iguaçu Airbnb Minimum Stay Requirements Analysis
Distribution of Listings by Minimum Night Requirement
1 Night
23 listings
46% of total
2 Nights
9 listings
18% of total
4-6 Nights
2 listings
4% of total
7-29 Nights
2 listings
4% of total
30+ Nights
14 listings
28% of total
Key Insights
- The most prevalent minimum stay requirement in Nova Iguaçu is 1 Night, adopted by 46% of listings. This highlights the market's preference for shorter, flexible bookings.
- A strong majority (64.0%) of the Nova Iguaçu Airbnb data shows acceptance of very short stays (1-2 nights), indicating a dynamic, high-turnover market.
- A significant segment (28%) caters to monthly stays (30+ nights) in Nova Iguaçu, pointing to opportunities in the extended-stay market.
Recommendations
- Align with the market by considering a 1 Night minimum stay, as 46% of Nova Iguaçu hosts use this setting.
- Explore offering discounts for stays of 30+ nights to attract the 28% of the market seeking extended stays.
- Adjust minimum nights based on seasonality – potentially shorter during low season and longer during peak demand periods in Nova Iguaçu.
Nova Iguaçu Airbnb Cancellation Policy Trends Analysis (2026)
Flexible
28 listings
56% of total
Moderate
9 listings
18% of total
Firm
8 listings
16% of total
Strict
5 listings
10% of total
Cancellation Policy Insights for Nova Iguaçu
- The prevailing Airbnb cancellation policy trend in Nova Iguaçu is Flexible, used by 56% of listings.
- The market strongly favors guest-friendly terms, with 74.0% of listings offering Flexible or Moderate policies. This suggests guests in Nova Iguaçu may expect booking flexibility.
Recommendations for Hosts
- Consider adopting a Flexible policy to align with the 56% market standard in Nova Iguaçu.
- Given the high prevalence of Flexible policies (56%), offering this can enhance booking appeal, especially during shoulder seasons.
- Using a Strict policy might deter some guests, as only 10% of listings use it. Evaluate if potential revenue protection outweighs possible lower booking rates.
- Regularly review your cancellation policy against competitors and market demand shifts in Nova Iguaçu.
Nova Iguaçu STR Booking Lead Time Analysis (2026)
Average Booking Lead Time by Month
Booking Lead Time Insights for Nova Iguaçu
- The overall average booking lead time for vacation rentals in Nova Iguaçu is 21 days.
- Guests book furthest in advance for stays during December (average 23 days), likely coinciding with peak travel demand or local events.
- The shortest booking windows occur for stays in February (average 7 days), indicating more last-minute travel plans during this time.
- Seasonally, Winter (15 days avg.) sees the longest lead times, while Fall (13 days avg.) has the shortest, reflecting typical travel planning cycles.
Recommendations for Hosts
- Use the overall average lead time (21 days) as a baseline for your pricing and availability strategy in Nova Iguaçu.
- During February, focus on last-minute booking availability and promotions, as guests book with very short notice (7 days avg.).
- Target marketing efforts for the Winter season well in advance (at least 15 days) to capture early planners.
- Monitor your own booking lead times against these Nova Iguaçu averages to identify opportunities for dynamic pricing adjustments.
Popular & Essential Airbnb Amenities in Nova Iguaçu (2026)
Amenity Prevalence
Amenity Insights for Nova Iguaçu
- Essential amenities in Nova Iguaçu that guests expect include: Wifi. Lacking these (this) could significantly impact bookings.
- Popular amenities like TV, Air conditioning, Kitchen are common but not universal. Offering these can provide a competitive edge.
Recommendations for Hosts
- Ensure your listing includes all essential amenities for Nova Iguaçu: Wifi.
- Prioritize adding missing essentials: Wifi.
- Consider adding popular differentiators like TV or Air conditioning to increase appeal.
- Highlight unique or less common amenities you offer (e.g., hot tub, dedicated workspace, EV charger) in your listing description and photos.
- Regularly check competitor amenities in Nova Iguaçu to stay competitive.
Nova Iguaçu Airbnb Guest Demographics & Profile Analysis (2026)
Guest Profile Summary for Nova Iguaçu
- The typical guest profile for Airbnb in Nova Iguaçu consists of primarily domestic travelers (94%), often arriving from nearby Rio de Janeiro, typically belonging to the Post-2000s (Gen Z/Alpha) group (50%), primarily speaking Portuguese or English.
- Domestic travelers account for 93.6% of guests.
- Key international markets include Brazil (93.6%) and Argentina (1.6%).
- Top languages spoken are Portuguese (59%) followed by English (21.6%).
- A significant demographic segment is the Post-2000s (Gen Z/Alpha) group, representing 50% of guests.
Recommendations for Hosts
- Target domestic marketing efforts towards travelers from Rio de Janeiro and São Paulo.
- Tailor amenities and listing descriptions to appeal to the dominant Post-2000s (Gen Z/Alpha) demographic (e.g., highlight fast WiFi, smart home features, local guides).
- Highlight unique local experiences or amenities relevant to the primary guest profile.
- Consider seasonal promotions aligned with peak travel times for key origin markets.
Nearby Short-Term Rental Market Comparison
How does the Nova Iguaçu Airbnb market stack up against its neighbors? Compare key performance metrics like average monthly revenue, ADR, and occupancy rates in surrounding areas to understand the broader regional STR landscape.
| Market | Active Properties | Monthly Revenue | Daily Rate | Avg. Occupancy |
|---|---|---|---|---|
| Ilha Grande | 11 | $1,783 | $166.42 | 38% |
| Areal | 82 | $1,532 | $198.25 | 30% |
| Queluz | 17 | $1,291 | $152.05 | 30% |
| Rio de Janeiro | 27,660 | $1,085 | $106.45 | 43% |
| Angra dos Reis | 2,446 | $1,017 | $158.25 | 33% |
| Petrópolis | 2,096 | $964 | $143.70 | 27% |
| Paraíba do Sul | 49 | $930 | $208.87 | 25% |
| Ijaci | 16 | $792 | $140.06 | 28% |
| Itanhandu | 31 | $788 | $108.00 | 22% |
| Guapimirim | 142 | $778 | $123.54 | 27% |