Niterói Airbnb Market Analysis 2026: Short Term Rental Data & Vacation Rental Statistics in Rio de Janeiro, Brazil
Is Airbnb profitable in Niterói in 2026? Explore comprehensive Airbnb analytics for Niterói, Rio de Janeiro, Brazil to uncover income potential. This 2026 STR market report for Niterói, based on AirROI data from February 2025 to January 2026, reveals key trends in the market of 986 active listings.
Whether you're considering an Airbnb investment in Niterói, optimizing your existing vacation rental, or exploring rental arbitrage opportunities, understanding the Niterói Airbnb data is crucial. Leveraging the low regulation environment is key to maximizing your short term rental income potential. Let's dive into the specifics.
Key Niterói Airbnb Performance Metrics Overview
Monthly Airbnb Revenue Variations & Income Potential in Niterói (2026)
Understanding the monthly revenue variations for Airbnb listings in Niterói is key to maximizing your short term rental income potential. Seasonality significantly impacts earnings. Our analysis, based on data from the past 12 months, shows that the peak revenue month for STRs in Niterói is typically December, while June often presents the lowest earnings, highlighting opportunities for strategic pricing adjustments during shoulder and low seasons. Explore the typical Airbnb income in Niterói across different performance tiers:
- Best-in-class properties (Top 10%) achieve $2,096+ monthly, often utilizing dynamic pricing and superior guest experiences.
- Strong performing properties (Top 25%) earn $1,254 or more, indicating effective management and desirable locations/amenities.
- Typical properties (Median) generate around $642 per month, representing the average market performance.
- Entry-level properties (Bottom 25%) see earnings around $277, often with potential for optimization.
Average Monthly Airbnb Earnings Trend in Niterói
Niterói Airbnb Occupancy Rate Trends (2026)
Maximize your bookings by understanding the Niterói STR occupancy trends. Seasonal demand shifts significantly influence how often properties are booked. Typically, Marchsees the highest demand (peak season occupancy), while January experiences the lowest (low season). Effective strategies, like adjusting minimum stays or offering promotions, can boost occupancy during slower periods. Here's how different property tiers perform in Niterói:
- Best-in-class properties (Top 10%) achieve 81%+ occupancy, indicating high desirability and potentially optimized availability.
- Strong performing properties (Top 25%) maintain 62% or higher occupancy, suggesting good market fit and guest satisfaction.
- Typical properties (Median) have an occupancy rate around 36%.
- Entry-level properties (Bottom 25%) average 16% occupancy, potentially facing higher vacancy.
Average Monthly Occupancy Rate Trend in Niterói
Average Daily Rate (ADR) Airbnb Trends in Niterói (2026)
Effective short term rental pricing strategy in Niterói involves understanding monthly ADR fluctuations. The Average Daily Rate (ADR) for Airbnb in Niterói typically peaks in December and dips lowest during April. Leveraging Airbnb dynamic pricing tools or strategies based on this seasonality can significantly boost revenue. Here's a look at the typical nightly rates achieved:
- Best-in-class properties (Top 10%) command rates of $169+ per night, often due to premium features or locations.
- Strong performing properties (Top 25%) achieve nightly rates of $91 or more.
- Typical properties (Median) charge around $56 per night.
- Entry-level properties (Bottom 25%) earn around $38 per night.
Average Daily Rate (ADR) Trend by Month in Niterói
Get Live Niterói Market Intelligence 👇

Explore Real-time Analytics
Airbnb Seasonality Analysis & Trends in Niterói (2026)
Peak Season (December, March, January)
- Revenue averages $1,181 per month
- Occupancy rates average 40.9%
- Daily rates average $89
Shoulder Season
- Revenue averages $983 per month
- Occupancy maintains around 41.2%
- Daily rates hold near $80
Low Season (May, June, September)
- Revenue drops to average $845 per month
- Occupancy decreases to average 37.1%
- Daily rates adjust to average $80
Seasonality Insights for Niterói
- The Airbnb seasonality in Niterói shows moderate seasonality with distinct peak and low periods. While the sections above show seasonal averages, it's also insightful to look at the extremes:
- During the high season, the absolute peak month showcases Niterói's highest earning potential, with monthly revenues capable of climbing to $1,290, occupancy reaching a high of 47.7%, and ADRs peaking at $96.
- Conversely, the slowest single month of the year, typically falling within the low season, marks the market's lowest point. In this month, revenue might dip to $835, occupancy could drop to 36.0%, and ADRs may adjust down to $75.
- Understanding both the seasonal averages and these monthly peaks and troughs in revenue, occupancy, and ADR is crucial for maximizing your Airbnb profit potential in Niterói.
Seasonal Strategies for Maximizing Profit
- Peak Season: Maximize revenue through premium pricing and potentially longer minimum stays. Ensure high availability.
- Low Season: Offer competitive pricing, special promotions (e.g., extended stay discounts), and flexible cancellation policies. Target off-season travelers like remote workers or budget-conscious guests.
- Shoulder Seasons: Implement dynamic pricing that balances peak and low rates. Target weekend travelers or specific events. Offer slightly more flexible terms than peak season.
- Regularly analyze your own performance against these Niterói seasonality benchmarks and adjust your pricing and availability strategy accordingly.
Best Areas for Airbnb Investment in Niterói (2026)
Exploring the top neighborhoods for short-term rentals in Niterói? This section highlights key areas, outlining why they are attractive for hosts and guests, along with notable local attractions. Consider these locations based on your target guest profile and investment strategy.
| Neighborhood / Area | Why Host Here? (Target Guests & Appeal) | Key Attractions & Landmarks |
|---|---|---|
| Icaraí | A vibrant and upscale neighborhood known for its beautiful beach, excellent restaurants, and cultural institutions. It's a popular choice for families and young professionals looking for leisure and lifestyle. | Icaraí Beach, Museu de Arte Contemporânea, Praia de São Francisco, Shopping Icaraí, Parque da Cidade |
| São Francisco | This charming area is known for its picturesque views of Guanabara Bay and a laid-back atmosphere. It attracts nature lovers and those seeking a peaceful beach retreat. | São Francisco Beach, Caminho do Vento, Beco do Batman, Parque da Cidade, Fortaleza de Santa Cruz |
| Niterói Centro | The city's downtown area offers a blend of urban life with commerce, cultural sites, and historical significance. It’s a strategic location for business travelers and tourists. | Teatro Municipal, Cantareira, Caminho dos Antiquários, Supermercado Guanabara, Praça da República |
| Charitas | Known for its waterfront and proximity to the ferry to Rio, Charitas appeals to those looking for a scenic environment and easy access to both cities. | Charitas Beach, Ferry Terminal, Parque Natural Municipal da Serra da Tiririca, Shopping Bay Market |
| Engenho do Mato | A residential area that offers a mix of nature and tranquility, perfect for those looking to escape the city. It attracts nature enthusiasts. | Parque Estadual da Serra da Tiririca, Trilhas e mirantes, Mirante do Engenho do Mato, Vistas para a Baía de Guanabara |
| Jurujuba | A quaint neighborhood known for its fishing community and beautiful bay views. It appeals to those interested in a local experience. | Jurujuba Beach, Caminho do Litoral, sightseeing boats, Vistas para a Praia de Icaraí |
| Alcabala | A developing area known for its emerging local businesses and proximity to natural attractions, presenting investment opportunities. | Alcabala Beach, Local eateries, Trailheads to surrounding parks |
| Caminho Niemeyer | An architectural marvel area that draws tourists and locals alike due to its stunning buildings and cultural significance. Great for short-term rentals. | Museu de Arte Contemporânea, Centro de Artes UFF, Vistas panorâmicas, Events and exhibitions |
Understanding Airbnb License Requirements & STR Laws in Niterói (2026)
While Niterói, Rio de Janeiro, Brazil currently shows low STR regulations, specific Airbnb license requirements might still exist or change. Always verify the latest short term rental regulations and Airbnb license requirements directly with local government authorities for Niterói to ensure full compliance before hosting.
(Source: AirROI data, 2026, based on 1% licensed listings)
Top Performing Airbnb Properties in Niterói (2026)
Benchmark your potential! Explore examples of top-performing Airbnb properties in Niteróibased on Trailing Twelve Month (TTM) revenue. Analyze their characteristics, revenue, occupancy rate, and ADR to understand what drives success in this market.

The Dream House in Piratininga
Entire Place • 4 bedrooms
Casa das Janelas Azuis - Camboinhas Beach.
Entire Place • 7 bedrooms

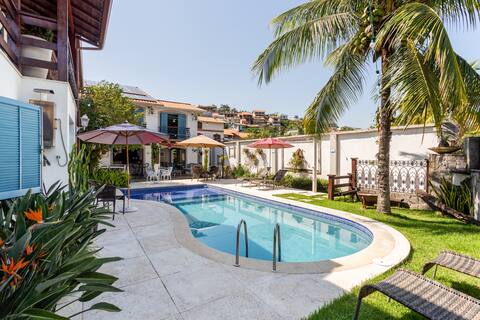
Luxury Villa Beach | Private Pool & Outdoor Oasis
Entire Place • 5 bedrooms

Ocean view ecological paradise
Entire Place • 5 bedrooms

Casa Cond Ocean House Camboinhas Feet in the Sand 4qts
Entire Place • 4 bedrooms

House 200m from the beach (new pool)
Entire Place • 5 bedrooms
Note: Performance varies based on location, size, amenities, seasonality, and management quality. Data reflects the past 12 months.
Top Performing Airbnb Hosts in Niterói (2026)
Learn from the best! This table showcases top-performing Airbnb hosts in Niterói based on the number of properties managed and estimated total revenue over the past year. Analyze their scale and performance metrics.
| Host Name | Properties | Grossing Revenue | Stay Reviews | Avg Rating |
|---|---|---|---|---|
| Priscila Formaggeri | 21 | $423,042 | 725 | 4.95/5.0 |
| Victor | 8 | $383,928 | 429 | 4.84/5.0 |
| Leandro | 1 | $148,291 | 24 | 5.00/5.0 |
| Júlia R Franco | 8 | $103,413 | 1144 | 4.97/5.0 |
| Carla | 1 | $98,771 | 15 | 5.00/5.0 |
| Fábio | 1 | $84,655 | 172 | 4.97/5.0 |
| Monica | 2 | $77,110 | 111 | 4.99/5.0 |
| Douglas | 11 | $68,525 | 349 | 4.62/5.0 |
| Angélica | 1 | $66,294 | 38 | 5.00/5.0 |
| Lilia | 1 | $55,611 | 9 | 5.00/5.0 |
Analyzing the strategies of top hosts, such as their property selection, pricing, and guest communication, can offer valuable lessons for optimizing your own Airbnb operations in Niterói.
Dive Deeper: Advanced Niterói STR Market Data (2026)
Ready to unlock more insights? AirROI provides access to advanced metrics and comprehensive Airbnb data for Niterói. Explore detailed analytics beyond this report to refine your investment strategy, optimize pricing, and maximize your vacation rental profits.
Explore Advanced MetricsNiterói Short-Term Rental Market Composition (2026): Property & Room Types
Room Type Distribution
Property Type Distribution
Market Composition Insights for Niterói
- The Niterói Airbnb market composition is heavily skewed towards Entire Home/Apt listings, which make up 83.1% of the 986 active rentals. This indicates strong guest preference for privacy and space.
- Looking at the property type distribution in Niterói, Apartment/Condo properties are the most common (58.1%), reflecting the local real estate landscape.
- Houses represent a significant 32.9% portion, catering likely to families or larger groups.
- The presence of 7.1% Hotel/Boutique listings indicates integration with traditional hospitality.
- Smaller segments like others, outdoor/unique (combined 1.9%) offer potential for unique stay experiences.
Niterói Airbnb Room Capacity Analysis (2026): Bedroom Distribution
Distribution of Listings by Number of Bedrooms
Room Capacity Insights for Niterói
- The dominant room capacity in Niterói is 1 bedroom listings, making up 41.4% of the market. This suggests a strong demand for properties suitable for couples or solo travelers.
- Together, 1 bedroom and 2 bedrooms properties represent 64.2% of the active Airbnb listings in Niterói, indicating a high concentration in these sizes.
Niterói Vacation Rental Guest Capacity Trends (2026)
Distribution of Listings by Guest Capacity
Guest Capacity Insights for Niterói
- The most common guest capacity trend in Niterói vacation rentals is listings accommodating 4 guests (25.2%). This suggests the primary traveler segment is likely small families or groups.
- Properties designed for 4 guests and 2 guests dominate the Niterói STR market, accounting for 43.0% of listings.
- 26.1% of properties accommodate 6+ guests, serving the market segment for larger families or group travel in Niterói.
- On average, properties in Niterói are equipped to host 3.8 guests.
Niterói Airbnb Booking Patterns (2026): Available vs. Booked Days
Available Days Distribution
Booked Days Distribution
Booking Pattern Insights for Niterói
- The most common availability pattern in Niterói falls within the 271-366 days range, representing 55.4% of listings. This suggests many properties have significant open periods on their calendars.
- Approximately 79.9% of listings show high availability (181+ days open annually), indicating potential for increased bookings or specific owner usage patterns.
- For booked days, the 31-90 days range is most frequent in Niterói (29.7%), reflecting common guest stay durations or potential owner blocking patterns.
- A notable 20.9% of properties secure long booking periods (181+ days booked per year), highlighting successful long-term rental strategies or significant owner usage.
Niterói Airbnb Minimum Stay Requirements Analysis
Distribution of Listings by Minimum Night Requirement
1 Night
240 listings
24.3% of total
2 Nights
276 listings
28% of total
3 Nights
90 listings
9.1% of total
4-6 Nights
49 listings
5% of total
7-29 Nights
21 listings
2.1% of total
30+ Nights
310 listings
31.4% of total
Key Insights
- The most prevalent minimum stay requirement in Niterói is 30+ Nights, adopted by 31.4% of listings. This highlights the market's preference for longer commitments.
- A significant segment (31.4%) caters to monthly stays (30+ nights) in Niterói, pointing to opportunities in the extended-stay market.
Recommendations
- Align with the market by considering a 30+ Nights minimum stay, as 31.4% of Niterói hosts use this setting.
- If feasible, allowing 1-night stays, especially midweek or during low season, could capture last-minute bookings, as only 24.3% currently do.
- Explore offering discounts for stays of 30+ nights to attract the 31.4% of the market seeking extended stays.
- Adjust minimum nights based on seasonality – potentially shorter during low season and longer during peak demand periods in Niterói.
Niterói Airbnb Cancellation Policy Trends Analysis (2026)
Super Strict 60 Days
5 listings
0.5% of total
Super Strict 30 Days
2 listings
0.2% of total
Limited
25 listings
2.5% of total
Flexible
217 listings
22.1% of total
Moderate
261 listings
26.5% of total
Firm
360 listings
36.6% of total
Strict
114 listings
11.6% of total
Cancellation Policy Insights for Niterói
- The prevailing Airbnb cancellation policy trend in Niterói is Firm, used by 36.6% of listings.
- There's a relatively balanced mix between guest-friendly (48.6%) and stricter (48.2%) policies, offering choices for different guest needs.
Recommendations for Hosts
- Consider adopting a Firm policy to align with the 36.6% market standard in Niterói.
- Using a Strict policy might deter some guests, as only 11.6% of listings use it. Evaluate if potential revenue protection outweighs possible lower booking rates.
- Regularly review your cancellation policy against competitors and market demand shifts in Niterói.
Niterói STR Booking Lead Time Analysis (2026)
Average Booking Lead Time by Month
Booking Lead Time Insights for Niterói
- The overall average booking lead time for vacation rentals in Niterói is 27 days.
- Guests book furthest in advance for stays during December (average 45 days), likely coinciding with peak travel demand or local events.
- The shortest booking windows occur for stays in June (average 18 days), indicating more last-minute travel plans during this time.
- Seasonally, Winter (34 days avg.) sees the longest lead times, while Summer (22 days avg.) has the shortest, reflecting typical travel planning cycles.
Recommendations for Hosts
- Use the overall average lead time (27 days) as a baseline for your pricing and availability strategy in Niterói.
- For December stays, consider implementing length-of-stay discounts or slightly higher rates for bookings made less than 45 days out to capitalize on advance planning.
- Target marketing efforts for the Winter season well in advance (at least 34 days) to capture early planners.
- Monitor your own booking lead times against these Niterói averages to identify opportunities for dynamic pricing adjustments.
Popular & Essential Airbnb Amenities in Niterói (2026)
Amenity Prevalence
Amenity Insights for Niterói
- Essential amenities in Niterói that guests expect include: Wifi. Lacking these (this) could significantly impact bookings.
- Popular amenities like Kitchen, TV, Air conditioning are common but not universal. Offering these can provide a competitive edge.
Recommendations for Hosts
- Ensure your listing includes all essential amenities for Niterói: Wifi.
- Prioritize adding missing essentials: Wifi.
- Consider adding popular differentiators like Kitchen or TV to increase appeal.
- Highlight unique or less common amenities you offer (e.g., hot tub, dedicated workspace, EV charger) in your listing description and photos.
- Regularly check competitor amenities in Niterói to stay competitive.
Niterói Airbnb Guest Demographics & Profile Analysis (2026)
Guest Profile Summary for Niterói
- The typical guest profile for Airbnb in Niterói consists of primarily domestic travelers (83%), often arriving from nearby Rio de Janeiro, typically belonging to the Post-2000s (Gen Z/Alpha) group (50%), primarily speaking Portuguese or English.
- Domestic travelers account for 82.5% of guests.
- Key international markets include Brazil (82.5%) and United States (4.6%).
- Top languages spoken are Portuguese (38%) followed by English (32.7%).
- A significant demographic segment is the Post-2000s (Gen Z/Alpha) group, representing 50% of guests.
Recommendations for Hosts
- Target domestic marketing efforts towards travelers from Rio de Janeiro and São Paulo.
- Tailor amenities and listing descriptions to appeal to the dominant Post-2000s (Gen Z/Alpha) demographic (e.g., highlight fast WiFi, smart home features, local guides).
- Highlight unique local experiences or amenities relevant to the primary guest profile.
- Consider seasonal promotions aligned with peak travel times for key origin markets.
Nearby Short-Term Rental Market Comparison
How does the Niterói Airbnb market stack up against its neighbors? Compare key performance metrics like average monthly revenue, ADR, and occupancy rates in surrounding areas to understand the broader regional STR landscape.
| Market | Active Properties | Monthly Revenue | Daily Rate | Avg. Occupancy |
|---|---|---|---|---|
| Ilha Grande | 11 | $1,783 | $166.42 | 38% |
| Areal | 82 | $1,532 | $198.25 | 30% |
| Queluz | 17 | $1,291 | $152.05 | 30% |
| Rio de Janeiro | 27,660 | $1,085 | $106.45 | 43% |
| Angra dos Reis | 2,446 | $1,017 | $158.25 | 33% |
| Petrópolis | 2,096 | $964 | $143.70 | 27% |
| Paraíba do Sul | 49 | $930 | $208.87 | 25% |
| Ijaci | 16 | $792 | $140.06 | 28% |
| Itanhandu | 31 | $788 | $108.00 | 22% |
| Guapimirim | 142 | $778 | $123.54 | 27% |