Maricá Airbnb Market Analysis 2026: Short Term Rental Data & Vacation Rental Statistics in Rio de Janeiro, Brazil
Is Airbnb profitable in Maricá in 2026? Explore comprehensive Airbnb analytics for Maricá, Rio de Janeiro, Brazil to uncover income potential. This 2026 STR market report for Maricá, based on AirROI data from February 2025 to January 2026, reveals key trends in the market of 527 active listings.
Whether you're considering an Airbnb investment in Maricá, optimizing your existing vacation rental, or exploring rental arbitrage opportunities, understanding the Maricá Airbnb data is crucial. Leveraging the low regulation environment is key to maximizing your short term rental income potential. Let's dive into the specifics.
Key Maricá Airbnb Performance Metrics Overview
Monthly Airbnb Revenue Variations & Income Potential in Maricá (2026)
Understanding the monthly revenue variations for Airbnb listings in Maricá is key to maximizing your short term rental income potential. Seasonality significantly impacts earnings. Our analysis, based on data from the past 12 months, shows that the peak revenue month for STRs in Maricá is typically December, while August often presents the lowest earnings, highlighting opportunities for strategic pricing adjustments during shoulder and low seasons. Explore the typical Airbnb income in Maricá across different performance tiers:
- Best-in-class properties (Top 10%) achieve $1,779+ monthly, often utilizing dynamic pricing and superior guest experiences.
- Strong performing properties (Top 25%) earn $1,023 or more, indicating effective management and desirable locations/amenities.
- Typical properties (Median) generate around $507 per month, representing the average market performance.
- Entry-level properties (Bottom 25%) see earnings around $228, often with potential for optimization.
Average Monthly Airbnb Earnings Trend in Maricá
Maricá Airbnb Occupancy Rate Trends (2026)
Maximize your bookings by understanding the Maricá STR occupancy trends. Seasonal demand shifts significantly influence how often properties are booked. Typically, Marchsees the highest demand (peak season occupancy), while August experiences the lowest (low season). Effective strategies, like adjusting minimum stays or offering promotions, can boost occupancy during slower periods. Here's how different property tiers perform in Maricá:
- Best-in-class properties (Top 10%) achieve 66%+ occupancy, indicating high desirability and potentially optimized availability.
- Strong performing properties (Top 25%) maintain 41% or higher occupancy, suggesting good market fit and guest satisfaction.
- Typical properties (Median) have an occupancy rate around 22%.
- Entry-level properties (Bottom 25%) average 10% occupancy, potentially facing higher vacancy.
Average Monthly Occupancy Rate Trend in Maricá
Average Daily Rate (ADR) Airbnb Trends in Maricá (2026)
Effective short term rental pricing strategy in Maricá involves understanding monthly ADR fluctuations. The Average Daily Rate (ADR) for Airbnb in Maricá typically peaks in December and dips lowest during April. Leveraging Airbnb dynamic pricing tools or strategies based on this seasonality can significantly boost revenue. Here's a look at the typical nightly rates achieved:
- Best-in-class properties (Top 10%) command rates of $175+ per night, often due to premium features or locations.
- Strong performing properties (Top 25%) achieve nightly rates of $119 or more.
- Typical properties (Median) charge around $76 per night.
- Entry-level properties (Bottom 25%) earn around $46 per night.
Average Daily Rate (ADR) Trend by Month in Maricá
Get Live Maricá Market Intelligence 👇

Explore Real-time Analytics
Airbnb Seasonality Analysis & Trends in Maricá (2026)
Peak Season (December, March, January)
- Revenue averages $1,078 per month
- Occupancy rates average 32.8%
- Daily rates average $99
Shoulder Season
- Revenue averages $735 per month
- Occupancy maintains around 29.6%
- Daily rates hold near $91
Low Season (June, August, September)
- Revenue drops to average $564 per month
- Occupancy decreases to average 23.4%
- Daily rates adjust to average $92
Seasonality Insights for Maricá
- The Airbnb seasonality in Maricá shows highly seasonal trends requiring careful strategy. While the sections above show seasonal averages, it's also insightful to look at the extremes:
- During the high season, the absolute peak month showcases Maricá's highest earning potential, with monthly revenues capable of climbing to $1,143, occupancy reaching a high of 37.5%, and ADRs peaking at $103.
- Conversely, the slowest single month of the year, typically falling within the low season, marks the market's lowest point. In this month, revenue might dip to $541, occupancy could drop to 21.8%, and ADRs may adjust down to $88.
- Understanding both the seasonal averages and these monthly peaks and troughs in revenue, occupancy, and ADR is crucial for maximizing your Airbnb profit potential in Maricá.
Seasonal Strategies for Maximizing Profit
- Peak Season: Maximize revenue through premium pricing and potentially longer minimum stays. Ensure high availability.
- Low Season: Offer competitive pricing, special promotions (e.g., extended stay discounts), and flexible cancellation policies. Target off-season travelers like remote workers or budget-conscious guests.
- Shoulder Seasons: Implement dynamic pricing that balances peak and low rates. Target weekend travelers or specific events. Offer slightly more flexible terms than peak season.
- Regularly analyze your own performance against these Maricá seasonality benchmarks and adjust your pricing and availability strategy accordingly.
Best Areas for Airbnb Investment in Maricá (2026)
Exploring the top neighborhoods for short-term rentals in Maricá? This section highlights key areas, outlining why they are attractive for hosts and guests, along with notable local attractions. Consider these locations based on your target guest profile and investment strategy.
| Neighborhood / Area | Why Host Here? (Target Guests & Appeal) | Key Attractions & Landmarks |
|---|---|---|
| Praia de Jacó | A bustling beach area known for its nightlife and water sports, attracting tourists looking for fun and relaxation by the sea. | Jacó Beach, Surfing spots, Bars and nightclubs, Local eateries, Water sports activities |
| Praia do Pontal | This quieter beach offers natural beauty and a peaceful environment, perfect for families and those seeking a getaway from the hustle. | Pontal Beach, Nature trails, Bird watching, Kayaking, Local seafood restaurants |
| Manoel Ribeiro | A growing area with new developments, attracting visitors looking for more affordable accommodation options near the coast. | Local markets, Community events, Cultural experiences, Parks and green areas, Nearby beaches |
| Saquarema | Famous for its surfing competitions, it attracts tourists and surfers from all over, particularly during the summer. | Saquarema Beach, Lake of Saquarema, Surf schools, Cultural festivals, Historical sites |
| Búzios | While slightly outside Maricá, it's a very popular destination with beautiful beaches and a vibrant social scene, ideal for Airbnb. | Rua das Pedras, Beaches like Geribá, Water sports, Nightlife, Shopping and dining |
| Centro de Maricá | The town center boasts historical buildings and cultural attractions, making it a unique place for visitors. | Maricá Cultural Center, Historical architecture, Local festivals, Markets and shopping, Parks |
| Praia de Itaipuaçu | An emerging beach destination with stunning views, attracting families and those looking for less commercialized beach experience. | Itaipuaçu Beach, Natural landscapes, Cozy beach bars, Fishing spots, Scenic views |
| Lagoon of Maricá | A serene area perfect for nature lovers, offering bird watching and a peaceful escape, very appealing for eco-tourism. | Maricá Lagoon, Fishing activities, Kayaking, Nature reserves, Relaxation spots |
Understanding Airbnb License Requirements & STR Laws in Maricá (2026)
While Maricá, Rio de Janeiro, Brazil currently shows low STR regulations, specific Airbnb license requirements might still exist or change. Always verify the latest short term rental regulations and Airbnb license requirements directly with local government authorities for Maricá to ensure full compliance before hosting.
(Source: AirROI data, 2026, based on 0% licensed listings)
Top Performing Airbnb Properties in Maricá (2026)
Benchmark your potential! Explore examples of top-performing Airbnb properties in Maricábased on Trailing Twelve Month (TTM) revenue. Analyze their characteristics, revenue, occupancy rate, and ADR to understand what drives success in this market.
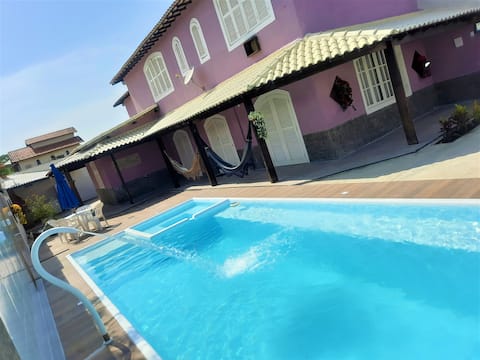
Casarão Violeta: 4 en-suites w/air-conditioning, 500 meters from the beach, Sinuca
Entire Place • 4 bedrooms
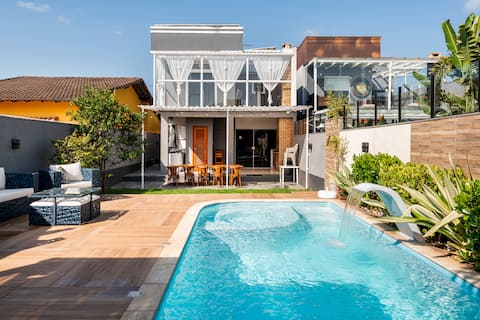
Large house in Itaipuaçu with swimming pool and barbecue area
Entire Place • 5 bedrooms

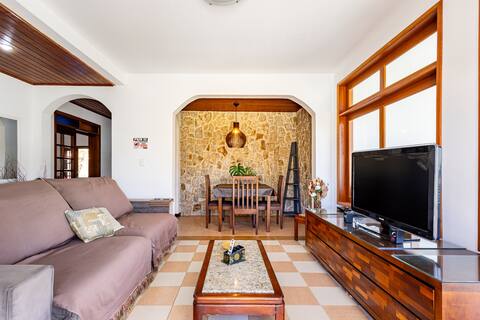
Atlantic Corner
Entire Place • 2 bedrooms
Casa Barroso
Entire Place • 3 bedrooms
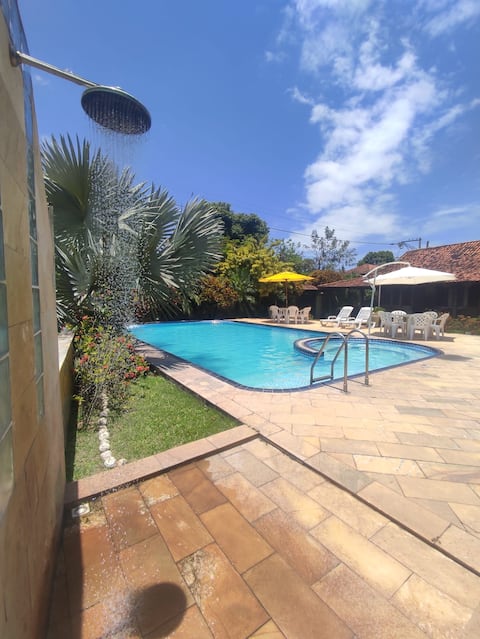
ONLY LEISURE. BEAUTIFUL SPACE, COMPLETE LINEAR HOUSE
Entire Place • 4 bedrooms
Route51 Great beach house for family to relax.
Entire Place • 2 bedrooms
Note: Performance varies based on location, size, amenities, seasonality, and management quality. Data reflects the past 12 months.
Top Performing Airbnb Hosts in Maricá (2026)
Learn from the best! This table showcases top-performing Airbnb hosts in Maricá based on the number of properties managed and estimated total revenue over the past year. Analyze their scale and performance metrics.
| Host Name | Properties | Grossing Revenue | Stay Reviews | Avg Rating |
|---|---|---|---|---|
| Christiane | 1 | $46,431 | 87 | 4.97/5.0 |
| Henrique | 2 | $44,244 | 219 | 4.87/5.0 |
| Fernanda | 1 | $40,771 | 73 | 4.99/5.0 |
| Margareth | 2 | $38,284 | 209 | 4.89/5.0 |
| Hugo | 4 | $36,030 | 59 | 4.61/5.0 |
| Wallace | 1 | $35,463 | 22 | 5.00/5.0 |
| Leonardo | 1 | $34,149 | 65 | 4.94/5.0 |
| Leonardo | 4 | $32,213 | 749 | 4.94/5.0 |
| Fernando | 1 | $31,643 | 50 | 4.96/5.0 |
| Thaissa | 2 | $31,536 | 86 | 4.88/5.0 |
Analyzing the strategies of top hosts, such as their property selection, pricing, and guest communication, can offer valuable lessons for optimizing your own Airbnb operations in Maricá.
Dive Deeper: Advanced Maricá STR Market Data (2026)
Ready to unlock more insights? AirROI provides access to advanced metrics and comprehensive Airbnb data for Maricá. Explore detailed analytics beyond this report to refine your investment strategy, optimize pricing, and maximize your vacation rental profits.
Explore Advanced MetricsMaricá Short-Term Rental Market Composition (2026): Property & Room Types
Room Type Distribution
Property Type Distribution
Market Composition Insights for Maricá
- The Maricá Airbnb market composition is heavily skewed towards Entire Home/Apt listings, which make up 92.8% of the 527 active rentals. This indicates strong guest preference for privacy and space.
- Looking at the property type distribution in Maricá, House properties are the most common (87.1%), reflecting the local real estate landscape.
- Houses represent a significant 87.1% portion, catering likely to families or larger groups.
- Smaller segments like hotel/boutique, others, outdoor/unique, unique stays (combined 4.9%) offer potential for unique stay experiences.
Maricá Airbnb Room Capacity Analysis (2026): Bedroom Distribution
Distribution of Listings by Number of Bedrooms
Room Capacity Insights for Maricá
- The dominant room capacity in Maricá is 2 bedrooms listings, making up 27.9% of the market. This suggests a strong demand for properties suitable for couples or solo travelers.
- Together, 2 bedrooms and 3 bedrooms properties represent 55.6% of the active Airbnb listings in Maricá, indicating a high concentration in these sizes.
- A significant 45.9% of listings offer 3+ bedrooms, catering to larger groups and families seeking more space in Maricá.
Maricá Vacation Rental Guest Capacity Trends (2026)
Distribution of Listings by Guest Capacity
Guest Capacity Insights for Maricá
- The most common guest capacity trend in Maricá vacation rentals is listings accommodating 8+ guests (52.6%). This suggests the primary traveler segment is likely larger groups.
- Properties designed for 8+ guests and 6 guests dominate the Maricá STR market, accounting for 66.3% of listings.
- 70.3% of properties accommodate 6+ guests, serving the market segment for larger families or group travel in Maricá.
- On average, properties in Maricá are equipped to host 6.1 guests.
Maricá Airbnb Booking Patterns (2026): Available vs. Booked Days
Available Days Distribution
Booked Days Distribution
Booking Pattern Insights for Maricá
- The most common availability pattern in Maricá falls within the 271-366 days range, representing 72.7% of listings. This suggests many properties have significant open periods on their calendars.
- Approximately 92.8% of listings show high availability (181+ days open annually), indicating potential for increased bookings or specific owner usage patterns.
- For booked days, the 1-30 days range is most frequent in Maricá (35.9%), reflecting common guest stay durations or potential owner blocking patterns.
- A notable 7.6% of properties secure long booking periods (181+ days booked per year), highlighting successful long-term rental strategies or significant owner usage.
Maricá Airbnb Minimum Stay Requirements Analysis
Distribution of Listings by Minimum Night Requirement
1 Night
160 listings
30.4% of total
2 Nights
200 listings
38% of total
3 Nights
24 listings
4.6% of total
4-6 Nights
5 listings
0.9% of total
7-29 Nights
4 listings
0.8% of total
30+ Nights
134 listings
25.4% of total
Key Insights
- The most prevalent minimum stay requirement in Maricá is 2 Nights, adopted by 38% of listings. This highlights the market's preference for shorter, flexible bookings.
- A strong majority (68.4%) of the Maricá Airbnb data shows acceptance of very short stays (1-2 nights), indicating a dynamic, high-turnover market.
- A significant segment (25.4%) caters to monthly stays (30+ nights) in Maricá, pointing to opportunities in the extended-stay market.
Recommendations
- Align with the market by considering a 2 Nights minimum stay, as 38% of Maricá hosts use this setting.
- Explore offering discounts for stays of 30+ nights to attract the 25.4% of the market seeking extended stays.
- Adjust minimum nights based on seasonality – potentially shorter during low season and longer during peak demand periods in Maricá.
Maricá Airbnb Cancellation Policy Trends Analysis (2026)
Limited
17 listings
3.2% of total
Flexible
144 listings
27.4% of total
Moderate
138 listings
26.3% of total
Firm
169 listings
32.2% of total
Strict
57 listings
10.9% of total
Cancellation Policy Insights for Maricá
- The prevailing Airbnb cancellation policy trend in Maricá is Firm, used by 32.2% of listings.
- There's a relatively balanced mix between guest-friendly (53.7%) and stricter (43.1%) policies, offering choices for different guest needs.
Recommendations for Hosts
- Consider adopting a Firm policy to align with the 32.2% market standard in Maricá.
- Using a Strict policy might deter some guests, as only 10.9% of listings use it. Evaluate if potential revenue protection outweighs possible lower booking rates.
- Regularly review your cancellation policy against competitors and market demand shifts in Maricá.
Maricá STR Booking Lead Time Analysis (2026)
Average Booking Lead Time by Month
Booking Lead Time Insights for Maricá
- The overall average booking lead time for vacation rentals in Maricá is 35 days.
- Guests book furthest in advance for stays during December (average 58 days), likely coinciding with peak travel demand or local events.
- The shortest booking windows occur for stays in June (average 12 days), indicating more last-minute travel plans during this time.
- Seasonally, Winter (43 days avg.) sees the longest lead times, while Summer (17 days avg.) has the shortest, reflecting typical travel planning cycles.
Recommendations for Hosts
- Use the overall average lead time (35 days) as a baseline for your pricing and availability strategy in Maricá.
- For December stays, consider implementing length-of-stay discounts or slightly higher rates for bookings made less than 58 days out to capitalize on advance planning.
- During June, focus on last-minute booking availability and promotions, as guests book with very short notice (12 days avg.).
- Target marketing efforts for the Winter season well in advance (at least 43 days) to capture early planners.
- Monitor your own booking lead times against these Maricá averages to identify opportunities for dynamic pricing adjustments.
Popular & Essential Airbnb Amenities in Maricá (2026)
Amenity Prevalence
Amenity Insights for Maricá
- Essential amenities in Maricá that guests expect include: Wifi. Lacking these (this) could significantly impact bookings.
- Popular amenities like Kitchen, TV, Free parking on premises are common but not universal. Offering these can provide a competitive edge.
- A pool is a highly desired but not standard amenity, making it a key feature for attracting guests seeking leisure in Maricá.
Recommendations for Hosts
- Ensure your listing includes all essential amenities for Maricá: Wifi.
- Prioritize adding missing essentials: Wifi.
- Consider adding popular differentiators like Kitchen or TV to increase appeal.
- Highlight unique or less common amenities you offer (e.g., hot tub, dedicated workspace, EV charger) in your listing description and photos.
- Regularly check competitor amenities in Maricá to stay competitive.
Maricá Airbnb Guest Demographics & Profile Analysis (2026)
Guest Profile Summary for Maricá
- The typical guest profile for Airbnb in Maricá consists of primarily domestic travelers (94%), often arriving from nearby Rio de Janeiro, typically belonging to the Post-2000s (Gen Z/Alpha) group (50%), primarily speaking Portuguese or English.
- Domestic travelers account for 94.2% of guests.
- Key international markets include Brazil (94.2%) and United States (1.1%).
- Top languages spoken are Portuguese (51.3%) followed by English (29.1%).
- A significant demographic segment is the Post-2000s (Gen Z/Alpha) group, representing 50% of guests.
Recommendations for Hosts
- Target domestic marketing efforts towards travelers from Rio de Janeiro and Niterói.
- Tailor amenities and listing descriptions to appeal to the dominant Post-2000s (Gen Z/Alpha) demographic (e.g., highlight fast WiFi, smart home features, local guides).
- Highlight unique local experiences or amenities relevant to the primary guest profile.
- Consider seasonal promotions aligned with peak travel times for key origin markets.
Nearby Short-Term Rental Market Comparison
How does the Maricá Airbnb market stack up against its neighbors? Compare key performance metrics like average monthly revenue, ADR, and occupancy rates in surrounding areas to understand the broader regional STR landscape.
| Market | Active Properties | Monthly Revenue | Daily Rate | Avg. Occupancy |
|---|---|---|---|---|
| Areal | 82 | $1,532 | $198.25 | 30% |
| Armação dos Búzios | 4,351 | $1,216 | $171.43 | 34% |
| Rio de Janeiro | 27,660 | $1,085 | $106.45 | 43% |
| Petrópolis | 2,096 | $964 | $143.70 | 27% |
| Para�íba do Sul | 49 | $930 | $208.87 | 25% |
| Guapimirim | 142 | $778 | $123.54 | 27% |
| Itaboraí | 42 | $734 | $138.13 | 28% |
| Teresópolis | 758 | $688 | $110.18 | 29% |
| Niterói | 986 | $687 | $85.16 | 37% |
| Magé | 31 | $680 | $140.31 | 22% |