Itatiaia Airbnb Market Analysis 2026: Short Term Rental Data & Vacation Rental Statistics in Rio de Janeiro, Brazil
Is Airbnb profitable in Itatiaia in 2026? Explore comprehensive Airbnb analytics for Itatiaia, Rio de Janeiro, Brazil to uncover income potential. This 2026 STR market report for Itatiaia, based on AirROI data from February 2025 to January 2026, reveals key trends in the market of 564 active listings.
Whether you're considering an Airbnb investment in Itatiaia, optimizing your existing vacation rental, or exploring rental arbitrage opportunities, understanding the Itatiaia Airbnb data is crucial. Leveraging the low regulation environment is key to maximizing your short term rental income potential. Let's dive into the specifics.
Key Itatiaia Airbnb Performance Metrics Overview
Monthly Airbnb Revenue Variations & Income Potential in Itatiaia (2026)
Understanding the monthly revenue variations for Airbnb listings in Itatiaia is key to maximizing your short term rental income potential. Seasonality significantly impacts earnings. Our analysis, based on data from the past 12 months, shows that the peak revenue month for STRs in Itatiaia is typically December, while February often presents the lowest earnings, highlighting opportunities for strategic pricing adjustments during shoulder and low seasons. Explore the typical Airbnb income in Itatiaia across different performance tiers:
- Best-in-class properties (Top 10%) achieve $1,734+ monthly, often utilizing dynamic pricing and superior guest experiences.
- Strong performing properties (Top 25%) earn $937 or more, indicating effective management and desirable locations/amenities.
- Typical properties (Median) generate around $444 per month, representing the average market performance.
- Entry-level properties (Bottom 25%) see earnings around $211, often with potential for optimization.
Average Monthly Airbnb Earnings Trend in Itatiaia
Itatiaia Airbnb Occupancy Rate Trends (2026)
Maximize your bookings by understanding the Itatiaia STR occupancy trends. Seasonal demand shifts significantly influence how often properties are booked. Typically, Julysees the highest demand (peak season occupancy), while February experiences the lowest (low season). Effective strategies, like adjusting minimum stays or offering promotions, can boost occupancy during slower periods. Here's how different property tiers perform in Itatiaia:
- Best-in-class properties (Top 10%) achieve 62%+ occupancy, indicating high desirability and potentially optimized availability.
- Strong performing properties (Top 25%) maintain 40% or higher occupancy, suggesting good market fit and guest satisfaction.
- Typical properties (Median) have an occupancy rate around 23%.
- Entry-level properties (Bottom 25%) average 12% occupancy, potentially facing higher vacancy.
Average Monthly Occupancy Rate Trend in Itatiaia
Average Daily Rate (ADR) Airbnb Trends in Itatiaia (2026)
Effective short term rental pricing strategy in Itatiaia involves understanding monthly ADR fluctuations. The Average Daily Rate (ADR) for Airbnb in Itatiaia typically peaks in December and dips lowest during February. Leveraging Airbnb dynamic pricing tools or strategies based on this seasonality can significantly boost revenue. Here's a look at the typical nightly rates achieved:
- Best-in-class properties (Top 10%) command rates of $167+ per night, often due to premium features or locations.
- Strong performing properties (Top 25%) achieve nightly rates of $99 or more.
- Typical properties (Median) charge around $60 per night.
- Entry-level properties (Bottom 25%) earn around $40 per night.
Average Daily Rate (ADR) Trend by Month in Itatiaia
Get Live Itatiaia Market Intelligence 👇

Explore Real-time Analytics
Airbnb Seasonality Analysis & Trends in Itatiaia (2026)
Peak Season (December, July, January)
- Revenue averages $920 per month
- Occupancy rates average 31.7%
- Daily rates average $94
Shoulder Season
- Revenue averages $741 per month
- Occupancy maintains around 28.9%
- Daily rates hold near $84
Low Season (February, May, September)
- Revenue drops to average $612 per month
- Occupancy decreases to average 25.7%
- Daily rates adjust to average $82
Seasonality Insights for Itatiaia
- The Airbnb seasonality in Itatiaia shows moderate seasonality with distinct peak and low periods. While the sections above show seasonal averages, it's also insightful to look at the extremes:
- During the high season, the absolute peak month showcases Itatiaia's highest earning potential, with monthly revenues capable of climbing to $1,063, occupancy reaching a high of 33.7%, and ADRs peaking at $101.
- Conversely, the slowest single month of the year, typically falling within the low season, marks the market's lowest point. In this month, revenue might dip to $559, occupancy could drop to 25.0%, and ADRs may adjust down to $76.
- Understanding both the seasonal averages and these monthly peaks and troughs in revenue, occupancy, and ADR is crucial for maximizing your Airbnb profit potential in Itatiaia.
Seasonal Strategies for Maximizing Profit
- Peak Season: Maximize revenue through premium pricing and potentially longer minimum stays. Ensure high availability.
- Low Season: Offer competitive pricing, special promotions (e.g., extended stay discounts), and flexible cancellation policies. Target off-season travelers like remote workers or budget-conscious guests.
- Shoulder Seasons: Implement dynamic pricing that balances peak and low rates. Target weekend travelers or specific events. Offer slightly more flexible terms than peak season.
- Regularly analyze your own performance against these Itatiaia seasonality benchmarks and adjust your pricing and availability strategy accordingly.
Best Areas for Airbnb Investment in Itatiaia (2026)
Exploring the top neighborhoods for short-term rentals in Itatiaia? This section highlights key areas, outlining why they are attractive for hosts and guests, along with notable local attractions. Consider these locations based on your target guest profile and investment strategy.
| Neighborhood / Area | Why Host Here? (Target Guests & Appeal) | Key Attractions & Landmarks |
|---|---|---|
| Park Itatiaia | A key part of the Itatiaia National Park, offering stunning mountain views, hiking, and outdoor activities. Ideal for nature lovers seeking a tranquil retreat. | Caminho da Pedra, Pico das Agulhas Negras, Cascata do Maromba, Praia do Sul, Trilha do Mirante |
| Maromba | A charming village near waterfalls and natural pools, popular among tourists for its natural beauty and eco-tourism. Great for guests looking for relaxation and adventure. | Cachoeira do Escorrega, Cachoeira dos Primata, Cachoeira da Maromba, Parque Nacional de Itatiaia, Trilha da Pedra do Altar |
| Petrópolis | A historical city nearby known for its imperial history and cooler climate. Popular for weekend getaways and cultural experiences. | Museu Imperial, Palácio de Cristal, Catedral de São Pedro de Alcântara, Rua Teresa, Casa de Santos Dumont |
| Visconde de Mauá | A beautiful area with stunning scenery and various outdoor activities, attracting nature enthusiasts and adventure seekers. | Cachoeira do Santo Antônio, Cachoeira do Alambique, Trilha da Pedra Selada, Parque Nacional de Itatiaia, Centro de Visconde de Mauá |
| Itatiaia Village | The main access point to the national park, offering various amenities for tourists while being close to nature. | Restaurantes locais, Loja de produtos artesanais, Campo de Futebol de Itatiaia, Trilha da Serra do Papagaio, Centro de Informação do Parque |
| Condomínio do Lago | A serene residential area by a lake, perfect for tourists seeking peace and proximity to nature while being a short drive from attractions. | Lago de Itatiaia, Trilhas locais, Área de lazer, Observação de aves, Pesca esportiva |
| Vale do Pavão | A nature lovers' haven known for its breathtaking landscapes and ecological tourism, ideal for those looking to disconnect from urban life. | Mirante do Pavão, Trilhas ecológicas, Cachoeiras escondidas, Atividades de agroturismo, Observação de fauna |
| Serrinha do Alambari | Known for its beautiful landscapes and rural charm, this area attracts guests looking for a more rustic experience with nature. | Cachoeira do Alambari, Trilhas para caminhadas., Riacho do Alambari, Experiências rurais, Visitas a propriedades rurais |
Understanding Airbnb License Requirements & STR Laws in Itatiaia (2026)
While Itatiaia, Rio de Janeiro, Brazil currently shows low STR regulations, specific Airbnb license requirements might still exist or change. Always verify the latest short term rental regulations and Airbnb license requirements directly with local government authorities for Itatiaia to ensure full compliance before hosting.
(Source: AirROI data, 2026, based on 0% licensed listings)
Top Performing Airbnb Properties in Itatiaia (2026)
Benchmark your potential! Explore examples of top-performing Airbnb properties in Itatiaiabased on Trailing Twelve Month (TTM) revenue. Analyze their characteristics, revenue, occupancy rate, and ADR to understand what drives success in this market.
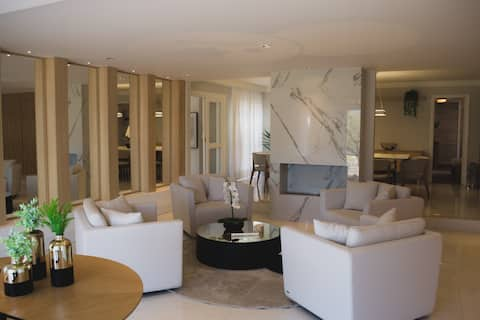
Lake House · Comfort and exclusivity in Penedo
Entire Place • 3 bedrooms
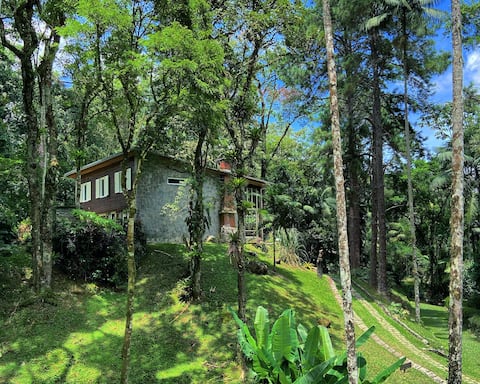
Modernist Chalet in the middle of the Forest
Entire Place • 3 bedrooms

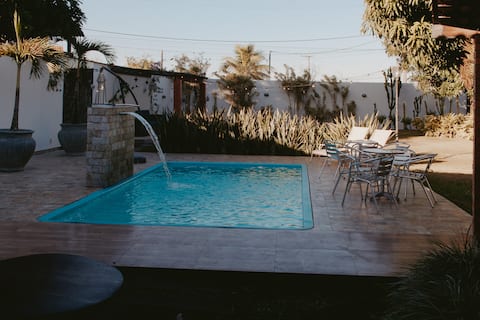
Wooden Chalet in Downtown Penedo with Pool
Entire Place • 5 bedrooms

House with 6 EN-SUITES and CLOSE to the center of Penedo.
Entire Place • 6 bedrooms

Paradise in Alto Penedo: Pool with incredible view
Entire Place • 6 bedrooms
Country house in Itatiaia RJ for 20 people!
Entire Place • 5 bedrooms
Note: Performance varies based on location, size, amenities, seasonality, and management quality. Data reflects the past 12 months.
Top Performing Airbnb Hosts in Itatiaia (2026)
Learn from the best! This table showcases top-performing Airbnb hosts in Itatiaia based on the number of properties managed and estimated total revenue over the past year. Analyze their scale and performance metrics.
| Host Name | Properties | Grossing Revenue | Stay Reviews | Avg Rating |
|---|---|---|---|---|
| João Pedro Matos | 9 | $124,495 | 2014 | 4.80/5.0 |
| Beatriz | 4 | $124,355 | 229 | 5.00/5.0 |
| Geraldo Henrique | 3 | $95,271 | 184 | 4.87/5.0 |
| Bianca | 4 | $92,554 | 497 | 4.81/5.0 |
| Márcia | 3 | $78,671 | 73 | 5.00/5.0 |
| Silvia Rejane | 9 | $75,203 | 454 | 4.82/5.0 |
| Raquel Braga | 7 | $72,757 | 469 | 4.95/5.0 |
| Cristina CASTELLOES | 1 | $64,326 | 147 | 4.93/5.0 |
| Pedro Henrique | 13 | $63,050 | 1077 | 4.74/5.0 |
| Cláudio | 1 | $58,318 | 102 | 4.98/5.0 |
Analyzing the strategies of top hosts, such as their property selection, pricing, and guest communication, can offer valuable lessons for optimizing your own Airbnb operations in Itatiaia.
Dive Deeper: Advanced Itatiaia STR Market Data (2026)
Ready to unlock more insights? AirROI provides access to advanced metrics and comprehensive Airbnb data for Itatiaia. Explore detailed analytics beyond this report to refine your investment strategy, optimize pricing, and maximize your vacation rental profits.
Explore Advanced MetricsItatiaia Short-Term Rental Market Composition (2026): Property & Room Types
Room Type Distribution
Property Type Distribution
Market Composition Insights for Itatiaia
- The Itatiaia Airbnb market composition is heavily skewed towards Entire Home/Apt listings, which make up 84.4% of the 564 active rentals. This indicates strong guest preference for privacy and space.
- Looking at the property type distribution in Itatiaia, House properties are the most common (72.3%), reflecting the local real estate landscape.
- Houses represent a significant 72.3% portion, catering likely to families or larger groups.
- The presence of 10.8% Hotel/Boutique listings indicates integration with traditional hospitality.
- Smaller segments like outdoor/unique (combined 2.7%) offer potential for unique stay experiences.
Itatiaia Airbnb Room Capacity Analysis (2026): Bedroom Distribution
Distribution of Listings by Number of Bedrooms
Room Capacity Insights for Itatiaia
- The dominant room capacity in Itatiaia is 1 bedroom listings, making up 36.7% of the market. This suggests a strong demand for properties suitable for couples or solo travelers.
- Together, 1 bedroom and 2 bedrooms properties represent 58.0% of the active Airbnb listings in Itatiaia, indicating a high concentration in these sizes.
- A significant 26.6% of listings offer 3+ bedrooms, catering to larger groups and families seeking more space in Itatiaia.
Itatiaia Vacation Rental Guest Capacity Trends (2026)
Distribution of Listings by Guest Capacity
Guest Capacity Insights for Itatiaia
- The most common guest capacity trend in Itatiaia vacation rentals is listings accommodating 8+ guests (21.3%). This suggests the primary traveler segment is likely larger groups.
- Properties designed for 8+ guests and 2 guests dominate the Itatiaia STR market, accounting for 40.6% of listings.
- 38.0% of properties accommodate 6+ guests, serving the market segment for larger families or group travel in Itatiaia.
- On average, properties in Itatiaia are equipped to host 4.3 guests.
Itatiaia Airbnb Booking Patterns (2026): Available vs. Booked Days
Available Days Distribution
Booked Days Distribution
Booking Pattern Insights for Itatiaia
- The most common availability pattern in Itatiaia falls within the 271-366 days range, representing 67.2% of listings. This suggests many properties have significant open periods on their calendars.
- Approximately 92.4% of listings show high availability (181+ days open annually), indicating potential for increased bookings or specific owner usage patterns.
- For booked days, the 31-90 days range is most frequent in Itatiaia (39.5%), reflecting common guest stay durations or potential owner blocking patterns.
- A notable 8.0% of properties secure long booking periods (181+ days booked per year), highlighting successful long-term rental strategies or significant owner usage.
Itatiaia Airbnb Minimum Stay Requirements Analysis
Distribution of Listings by Minimum Night Requirement
1 Night
176 listings
31.2% of total
2 Nights
223 listings
39.5% of total
3 Nights
4 listings
0.7% of total
4-6 Nights
2 listings
0.4% of total
7-29 Nights
2 listings
0.4% of total
30+ Nights
157 listings
27.8% of total
Key Insights
- The most prevalent minimum stay requirement in Itatiaia is 2 Nights, adopted by 39.5% of listings. This highlights the market's preference for shorter, flexible bookings.
- A strong majority (70.7%) of the Itatiaia Airbnb data shows acceptance of very short stays (1-2 nights), indicating a dynamic, high-turnover market.
- A significant segment (27.8%) caters to monthly stays (30+ nights) in Itatiaia, pointing to opportunities in the extended-stay market.
Recommendations
- Align with the market by considering a 2 Nights minimum stay, as 39.5% of Itatiaia hosts use this setting.
- Explore offering discounts for stays of 30+ nights to attract the 27.8% of the market seeking extended stays.
- Adjust minimum nights based on seasonality – potentially shorter during low season and longer during peak demand periods in Itatiaia.
Itatiaia Airbnb Cancellation Policy Trends Analysis (2026)
Limited
7 listings
1.2% of total
Non-refundable
2 listings
0.4% of total
Refundable
4 listings
0.7% of total
Super Strict 60 Days
2 listings
0.4% of total
Flexible
139 listings
24.6% of total
Moderate
205 listings
36.3% of total
Firm
165 listings
29.3% of total
Strict
40 listings
7.1% of total
Cancellation Policy Insights for Itatiaia
- The prevailing Airbnb cancellation policy trend in Itatiaia is Moderate, used by 36.3% of listings.
- There's a relatively balanced mix between guest-friendly (60.9%) and stricter (36.4%) policies, offering choices for different guest needs.
- Strict cancellation policies are quite rare (7.1%), potentially making listings with this policy less competitive unless justified by high demand or property type.
Recommendations for Hosts
- Consider adopting a Moderate policy to align with the 36.3% market standard in Itatiaia.
- Using a Strict policy might deter some guests, as only 7.1% of listings use it. Evaluate if potential revenue protection outweighs possible lower booking rates.
- Regularly review your cancellation policy against competitors and market demand shifts in Itatiaia.
Itatiaia STR Booking Lead Time Analysis (2026)
Average Booking Lead Time by Month
Booking Lead Time Insights for Itatiaia
- The overall average booking lead time for vacation rentals in Itatiaia is 33 days.
- Guests book furthest in advance for stays during November (average 48 days), likely coinciding with peak travel demand or local events.
- The shortest booking windows occur for stays in September (average 23 days), indicating more last-minute travel plans during this time.
- Seasonally, Winter (34 days avg.) sees the longest lead times, while Spring (31 days avg.) has the shortest, reflecting typical travel planning cycles.
Recommendations for Hosts
- Use the overall average lead time (33 days) as a baseline for your pricing and availability strategy in Itatiaia.
- For November stays, consider implementing length-of-stay discounts or slightly higher rates for bookings made less than 48 days out to capitalize on advance planning.
- Target marketing efforts for the Winter season well in advance (at least 34 days) to capture early planners.
- Monitor your own booking lead times against these Itatiaia averages to identify opportunities for dynamic pricing adjustments.
Popular & Essential Airbnb Amenities in Itatiaia (2026)
Amenity Prevalence
Amenity Insights for Itatiaia
- Essential amenities in Itatiaia that guests expect include: Wifi, TV. Lacking these (any) could significantly impact bookings.
- Popular amenities like Free parking on premises, Hot water, Kitchen are common but not universal. Offering these can provide a competitive edge.
Recommendations for Hosts
- Ensure your listing includes all essential amenities for Itatiaia: Wifi, TV.
- Prioritize adding missing essentials: Wifi, TV.
- Consider adding popular differentiators like Free parking on premises or Hot water to increase appeal.
- Highlight unique or less common amenities you offer (e.g., hot tub, dedicated workspace, EV charger) in your listing description and photos.
- Regularly check competitor amenities in Itatiaia to stay competitive.
Itatiaia Airbnb Guest Demographics & Profile Analysis (2026)
Guest Profile Summary for Itatiaia
- The typical guest profile for Airbnb in Itatiaia consists of primarily domestic travelers (96%), often arriving from nearby Rio de Janeiro, typically belonging to the Post-2000s (Gen Z/Alpha) group (50%), primarily speaking Portuguese or English.
- Domestic travelers account for 96.4% of guests.
- Key international markets include Brazil (96.4%) and United States (1.2%).
- Top languages spoken are Portuguese (50.3%) followed by English (29.1%).
- A significant demographic segment is the Post-2000s (Gen Z/Alpha) group, representing 50% of guests.
Recommendations for Hosts
- Target domestic marketing efforts towards travelers from Rio de Janeiro and São Paulo.
- Tailor amenities and listing descriptions to appeal to the dominant Post-2000s (Gen Z/Alpha) demographic (e.g., highlight fast WiFi, smart home features, local guides).
- Highlight unique local experiences or amenities relevant to the primary guest profile.
- Consider seasonal promotions aligned with peak travel times for key origin markets.
Nearby Short-Term Rental Market Comparison
How does the Itatiaia Airbnb market stack up against its neighbors? Compare key performance metrics like average monthly revenue, ADR, and occupancy rates in surrounding areas to understand the broader regional STR landscape.
| Market | Active Properties | Monthly Revenue | Daily Rate | Avg. Occupancy |
|---|---|---|---|---|
| Ilha Grande | 11 | $1,783 | $166.42 | 38% |
| Areal | 82 | $1,532 | $198.25 | 30% |
| Queluz | 17 | $1,291 | $152.05 | 30% |
| Brazópolis | 21 | $1,209 | $152.11 | 29% |
| Santa Branca | 53 | $1,138 | $195.49 | 25% |
| Jambeiro | 22 | $1,135 | $185.50 | 24% |
| São Sebastião | 6,175 | $1,114 | $188.11 | 28% |
| Rio de Janeiro | 27,660 | $1,085 | $106.45 | 43% |
| Angra dos Reis | 2,446 | $1,017 | $158.25 | 33% |
| Paraisópolis | 104 | $1,004 | $108.16 | 32% |