Itaboraí Airbnb Market Analysis 2026: Short Term Rental Data & Vacation Rental Statistics in Rio de Janeiro, Brazil
Is Airbnb profitable in Itaboraí in 2026? Explore comprehensive Airbnb analytics for Itaboraí, Rio de Janeiro, Brazil to uncover income potential. This 2026 STR market report for Itaboraí, based on AirROI data from February 2025 to January 2026, reveals key trends in the niche market of 42 active listings.
Whether you're considering an Airbnb investment in Itaboraí, optimizing your existing vacation rental, or exploring rental arbitrage opportunities, understanding the Itaboraí Airbnb data is crucial. Leveraging the low regulation environment is key to maximizing your short term rental income potential. Let's dive into the specifics.
Key Itaboraí Airbnb Performance Metrics Overview
Monthly Airbnb Revenue Variations & Income Potential in Itaboraí (2026)
Understanding the monthly revenue variations for Airbnb listings in Itaboraí is key to maximizing your short term rental income potential. Seasonality significantly impacts earnings. Our analysis, based on data from the past 12 months, shows that the peak revenue month for STRs in Itaboraí is typically March, while September often presents the lowest earnings, highlighting opportunities for strategic pricing adjustments during shoulder and low seasons. Explore the typical Airbnb income in Itaboraí across different performance tiers:
- Best-in-class properties (Top 10%) achieve $2,260+ monthly, often utilizing dynamic pricing and superior guest experiences.
- Strong performing properties (Top 25%) earn $1,197 or more, indicating effective management and desirable locations/amenities.
- Typical properties (Median) generate around $583 per month, representing the average market performance.
- Entry-level properties (Bottom 25%) see earnings around $328, often with potential for optimization.
Average Monthly Airbnb Earnings Trend in Itaboraí
Itaboraí Airbnb Occupancy Rate Trends (2026)
Maximize your bookings by understanding the Itaboraí STR occupancy trends. Seasonal demand shifts significantly influence how often properties are booked. Typically, Marchsees the highest demand (peak season occupancy), while July experiences the lowest (low season). Effective strategies, like adjusting minimum stays or offering promotions, can boost occupancy during slower periods. Here's how different property tiers perform in Itaboraí:
- Best-in-class properties (Top 10%) achieve 61%+ occupancy, indicating high desirability and potentially optimized availability.
- Strong performing properties (Top 25%) maintain 45% or higher occupancy, suggesting good market fit and guest satisfaction.
- Typical properties (Median) have an occupancy rate around 26%.
- Entry-level properties (Bottom 25%) average 13% occupancy, potentially facing higher vacancy.
Average Monthly Occupancy Rate Trend in Itaboraí
Average Daily Rate (ADR) Airbnb Trends in Itaboraí (2026)
Effective short term rental pricing strategy in Itaboraí involves understanding monthly ADR fluctuations. The Average Daily Rate (ADR) for Airbnb in Itaboraí typically peaks in February and dips lowest during October. Leveraging Airbnb dynamic pricing tools or strategies based on this seasonality can significantly boost revenue. Here's a look at the typical nightly rates achieved:
- Best-in-class properties (Top 10%) command rates of $284+ per night, often due to premium features or locations.
- Strong performing properties (Top 25%) achieve nightly rates of $173 or more.
- Typical properties (Median) charge around $72 per night.
- Entry-level properties (Bottom 25%) earn around $29 per night.
Average Daily Rate (ADR) Trend by Month in Itaboraí
Get Live Itaboraí Market Intelligence 👇

Explore Real-time Analytics
Airbnb Seasonality Analysis & Trends in Itaboraí (2026)
Peak Season (March, February, December)
- Revenue averages $1,213 per month
- Occupancy rates average 35.0%
- Daily rates average $139
Shoulder Season
- Revenue averages $927 per month
- Occupancy maintains around 30.0%
- Daily rates hold near $121
Low Season (May, June, September)
- Revenue drops to average $819 per month
- Occupancy decreases to average 28.0%
- Daily rates adjust to average $127
Seasonality Insights for Itaboraí
- The Airbnb seasonality in Itaboraí shows moderate seasonality with distinct peak and low periods. While the sections above show seasonal averages, it's also insightful to look at the extremes:
- During the high season, the absolute peak month showcases Itaboraí's highest earning potential, with monthly revenues capable of climbing to $1,427, occupancy reaching a high of 37.0%, and ADRs peaking at $152.
- Conversely, the slowest single month of the year, typically falling within the low season, marks the market's lowest point. In this month, revenue might dip to $776, occupancy could drop to 26.8%, and ADRs may adjust down to $115.
- Understanding both the seasonal averages and these monthly peaks and troughs in revenue, occupancy, and ADR is crucial for maximizing your Airbnb profit potential in Itaboraí.
Seasonal Strategies for Maximizing Profit
- Peak Season: Maximize revenue through premium pricing and potentially longer minimum stays. Ensure high availability.
- Low Season: Offer competitive pricing, special promotions (e.g., extended stay discounts), and flexible cancellation policies. Target off-season travelers like remote workers or budget-conscious guests.
- Shoulder Seasons: Implement dynamic pricing that balances peak and low rates. Target weekend travelers or specific events. Offer slightly more flexible terms than peak season.
- Regularly analyze your own performance against these Itaboraí seasonality benchmarks and adjust your pricing and availability strategy accordingly.
Best Areas for Airbnb Investment in Itaboraí (2026)
Exploring the top neighborhoods for short-term rentals in Itaboraí? This section highlights key areas, outlining why they are attractive for hosts and guests, along with notable local attractions. Consider these locations based on your target guest profile and investment strategy.
| Neighborhood / Area | Why Host Here? (Target Guests & Appeal) | Key Attractions & Landmarks |
|---|---|---|
| Centro | The bustling heart of Itaboraí, characterized by its commercial activity, proximity to public transportation, and local attractions. Perfect for travelers seeking urban life and convenience. | Shopping Itaboraí, Teatro Municipal de Itaboraí, Praça Marechal Floriano Peixoto, Catedral de Nossa Senhora da Conceição, Museu Histórico de Itaboraí |
| Piaçaguera | A scenic area with a mix of nature and urban amenities, suitable for family vacations and nature lovers. Offers a quieter ambiance away from the city center. | Parque Natural Municipal do Morro do Castro, Trilhas e Ecoturismo, Caminho dos Antiquários, Praia de Ponta Negra |
| São Gonçalo | Close proximity to Itaboraí, larger neighborhood offering a variety of entertainment, shopping, and cultural experiences. Great for those looking to explore beyond Itaboraí itself. | Shopping São Gonçalo, Praça Zé Garoto, Cultural Center of São Gonçalo, Museu de Arte Religiosa de São Gonçalo |
| Itaipuaçu | A beach area in Itaboraí with beautiful coastal views and local restaurants, attracting beachgoers and families looking to relax by the sea. | Praia de Itaipuaçu, Restaurantes de frutos do mar, Caminho da Praia, Fazenda Itaipuaçu |
| Morada do Sol | An up-and-coming neighborhood with new developments and a friendly community vibe; ideal for those looking to invest in the growing Airbnb market. | Parque das Águas, Igreja Nossa Senhora da Paz, Praça das Flores, Caminhada no Bairro |
| Loteamento São José | A residential area that's becoming popular for its affordability and access to local amenities, attracting budget travelers and families. | Centros de compras, Praças e áreas de lazer, Igrejas locais, Eventos comunitários |
| Jardim Imperial | A family-friendly neighborhood known for its parks and green spaces, suitable for those who enjoy outdoor activities and a suburban atmosphere. | Parque Jardim Imperial, Praça da Criança, Igreja São Pedro, Feira de Artesanato |
| Reta | A mixed urban area that provides access to various local attractions and is known for its vibrant local culture, making it attractive for short stays. | Teatro de Reta, Escolas de samba locais, Eventos culturais, Praças públicas |
Understanding Airbnb License Requirements & STR Laws in Itaboraí (2026)
While Itaboraí, Rio de Janeiro, Brazil currently shows low STR regulations, specific Airbnb license requirements might still exist or change. Always verify the latest short term rental regulations and Airbnb license requirements directly with local government authorities for Itaboraí to ensure full compliance before hosting.
(Source: AirROI data, 2026, finding no licensed listings among those analyzed)
Top Performing Airbnb Properties in Itaboraí (2026)
Benchmark your potential! Explore examples of top-performing Airbnb properties in Itaboraíbased on Trailing Twelve Month (TTM) revenue. Analyze their characteristics, revenue, occupancy rate, and ADR to understand what drives success in this market.
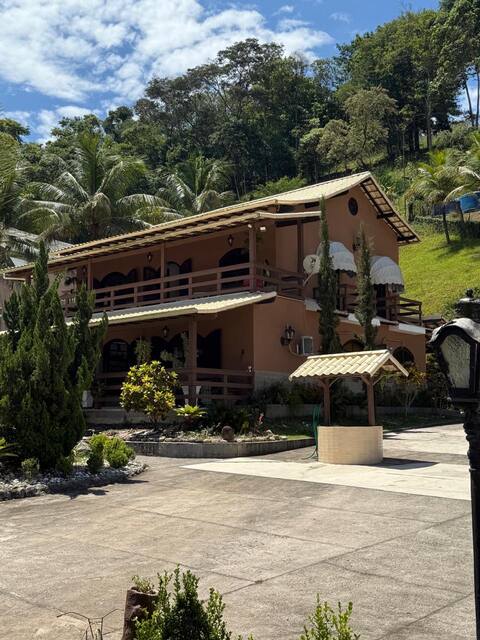
Cheerful townhouse with a swimming pool.
Entire Place • 7 bedrooms
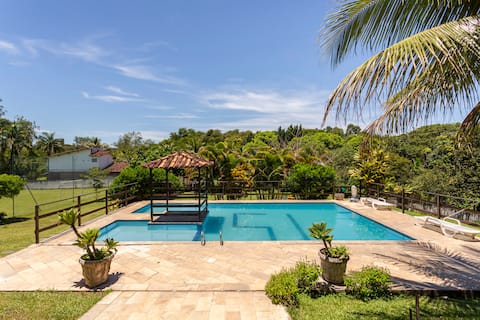
São Sebastião Farm in Itaboraí
Entire Place • 6 bedrooms
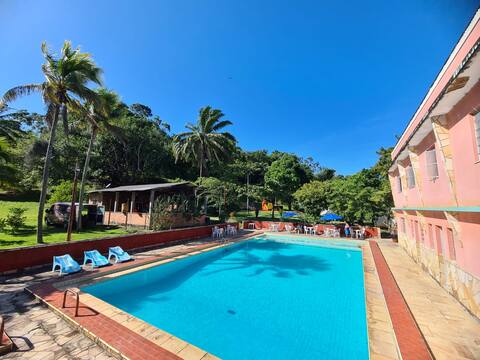
Seasonal site (mini-farm) in Itaboraí
Entire Place • 5 bedrooms

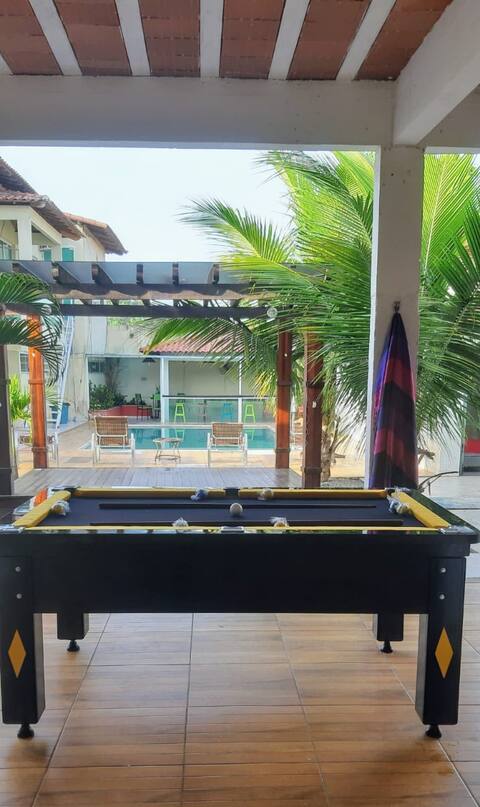
Ch. Alegria, Wi-Fi, pool, barbecue, field
Entire Place • 5 bedrooms
Rancho Romanichen
Entire Place • 4 bedrooms

Sítio Primavera - Leisure Retreat in Itaboraí
Entire Place • 7 bedrooms
Note: Performance varies based on location, size, amenities, seasonality, and management quality. Data reflects the past 12 months.
Top Performing Airbnb Hosts in Itaboraí (2026)
Learn from the best! This table showcases top-performing Airbnb hosts in Itaboraí based on the number of properties managed and estimated total revenue over the past year. Analyze their scale and performance metrics.
| Host Name | Properties | Grossing Revenue | Stay Reviews | Avg Rating |
|---|---|---|---|---|
| Dominique | 1 | $51,021 | 7 | 5.00/5.0 |
| Silvia | 1 | $42,507 | 35 | 4.94/5.0 |
| Charles | 2 | $40,164 | 141 | 4.95/5.0 |
| Fabiana | 1 | $23,918 | 44 | 5.00/5.0 |
| Luiz | 1 | $21,168 | 7 | 4.43/5.0 |
| Rafael | 1 | $15,994 | 118 | 4.88/5.0 |
| Bárbara | 1 | $15,341 | 41 | 4.80/5.0 |
| Paula | 1 | $12,945 | 1 | Not Rated |
| Gabriel | 2 | $10,434 | 149 | 4.87/5.0 |
| Julliana | 1 | $10,352 | 13 | 4.77/5.0 |
Analyzing the strategies of top hosts, such as their property selection, pricing, and guest communication, can offer valuable lessons for optimizing your own Airbnb operations in Itaboraí.
Dive Deeper: Advanced Itaboraí STR Market Data (2026)
Ready to unlock more insights? AirROI provides access to advanced metrics and comprehensive Airbnb data for Itaboraí. Explore detailed analytics beyond this report to refine your investment strategy, optimize pricing, and maximize your vacation rental profits.
Explore Advanced MetricsItaboraí Short-Term Rental Market Composition (2026): Property & Room Types
Room Type Distribution
Property Type Distribution
Market Composition Insights for Itaboraí
- The Itaboraí Airbnb market composition is heavily skewed towards Entire Home/Apt listings, which make up 83.3% of the 42 active rentals. This indicates strong guest preference for privacy and space.
- Looking at the property type distribution in Itaboraí, House properties are the most common (50%), reflecting the local real estate landscape.
- Houses represent a significant 50% portion, catering likely to families or larger groups.
- The presence of 11.9% Hotel/Boutique listings indicates integration with traditional hospitality.
- Smaller segments like others (combined 4.8%) offer potential for unique stay experiences.
Itaboraí Airbnb Room Capacity Analysis (2026): Bedroom Distribution
Distribution of Listings by Number of Bedrooms
Room Capacity Insights for Itaboraí
- The dominant room capacity in Itaboraí is 5+ bedrooms listings, making up 35.7% of the market. This suggests a strong demand for properties suitable for families or small groups.
- Together, 5+ bedrooms and 1 bedroom properties represent 54.7% of the active Airbnb listings in Itaboraí, indicating a high concentration in these sizes.
- A significant 57.1% of listings offer 3+ bedrooms, catering to larger groups and families seeking more space in Itaboraí.
Itaboraí Vacation Rental Guest Capacity Trends (2026)
Distribution of Listings by Guest Capacity
Guest Capacity Insights for Itaboraí
- The most common guest capacity trend in Itaboraí vacation rentals is listings accommodating 8+ guests (59.5%). This suggests the primary traveler segment is likely larger groups.
- Properties designed for 8+ guests and 2 guests dominate the Itaboraí STR market, accounting for 76.2% of listings.
- 64.3% of properties accommodate 6+ guests, serving the market segment for larger families or group travel in Itaboraí.
- On average, properties in Itaboraí are equipped to host 5.8 guests.
Itaboraí Airbnb Booking Patterns (2026): Available vs. Booked Days
Available Days Distribution
Booked Days Distribution
Booking Pattern Insights for Itaboraí
- The most common availability pattern in Itaboraí falls within the 271-366 days range, representing 59.5% of listings. This suggests many properties have significant open periods on their calendars.
- Approximately 90.5% of listings show high availability (181+ days open annually), indicating potential for increased bookings or specific owner usage patterns.
- For booked days, the 31-90 days range is most frequent in Itaboraí (33.3%), reflecting common guest stay durations or potential owner blocking patterns.
- A notable 9.5% of properties secure long booking periods (181+ days booked per year), highlighting successful long-term rental strategies or significant owner usage.
Itaboraí Airbnb Minimum Stay Requirements Analysis
Distribution of Listings by Minimum Night Requirement
1 Night
18 listings
42.9% of total
2 Nights
14 listings
33.3% of total
3 Nights
2 listings
4.8% of total
30+ Nights
8 listings
19% of total
Key Insights
- The most prevalent minimum stay requirement in Itaboraí is 1 Night, adopted by 42.9% of listings. This highlights the market's preference for shorter, flexible bookings.
- A strong majority (76.2%) of the Itaboraí Airbnb data shows acceptance of very short stays (1-2 nights), indicating a dynamic, high-turnover market.
- A significant segment (19%) caters to monthly stays (30+ nights) in Itaboraí, pointing to opportunities in the extended-stay market.
Recommendations
- Align with the market by considering a 1 Night minimum stay, as 42.9% of Itaboraí hosts use this setting.
- Explore offering discounts for stays of 30+ nights to attract the 19% of the market seeking extended stays.
- Adjust minimum nights based on seasonality – potentially shorter during low season and longer during peak demand periods in Itaboraí.
Itaboraí Airbnb Cancellation Policy Trends Analysis (2026)
Super Strict 60 Days
1 listings
2.4% of total
Flexible
16 listings
38.1% of total
Moderate
6 listings
14.3% of total
Firm
11 listings
26.2% of total
Strict
8 listings
19% of total
Cancellation Policy Insights for Itaboraí
- The prevailing Airbnb cancellation policy trend in Itaboraí is Flexible, used by 38.1% of listings.
- There's a relatively balanced mix between guest-friendly (52.4%) and stricter (45.2%) policies, offering choices for different guest needs.
Recommendations for Hosts
- Consider adopting a Flexible policy to align with the 38.1% market standard in Itaboraí.
- Regularly review your cancellation policy against competitors and market demand shifts in Itaboraí.
Itaboraí STR Booking Lead Time Analysis (2026)
Average Booking Lead Time by Month
Booking Lead Time Insights for Itaboraí
- The overall average booking lead time for vacation rentals in Itaboraí is 39 days.
- Guests book furthest in advance for stays during December (average 64 days), likely coinciding with peak travel demand or local events.
- The shortest booking windows occur for stays in May (average 20 days), indicating more last-minute travel plans during this time.
- Seasonally, Winter (42 days avg.) sees the longest lead times, while Spring (31 days avg.) has the shortest, reflecting typical travel planning cycles.
Recommendations for Hosts
- Use the overall average lead time (39 days) as a baseline for your pricing and availability strategy in Itaboraí.
- For December stays, consider implementing length-of-stay discounts or slightly higher rates for bookings made less than 64 days out to capitalize on advance planning.
- Target marketing efforts for the Winter season well in advance (at least 42 days) to capture early planners.
- Monitor your own booking lead times against these Itaboraí averages to identify opportunities for dynamic pricing adjustments.
Popular & Essential Airbnb Amenities in Itaboraí (2026)
Amenity Prevalence
Amenity Insights for Itaboraí
- Essential amenities in Itaboraí that guests expect include: TV, Free parking on premises. Lacking these (any) could significantly impact bookings.
- Popular amenities like Wifi, Pool, Kitchen are common but not universal. Offering these can provide a competitive edge.
- A pool is a highly desired but not standard amenity, making it a key feature for attracting guests seeking leisure in Itaboraí.
- Warning: Wifi is not universally provided but is considered essential globally. Ensure reliable Wifi is offered.
Recommendations for Hosts
- Ensure your listing includes all essential amenities for Itaboraí: TV, Free parking on premises.
- Prioritize adding missing essentials: TV, Free parking on premises.
- Consider adding popular differentiators like Wifi or Pool to increase appeal.
- Highlight unique or less common amenities you offer (e.g., hot tub, dedicated workspace, EV charger) in your listing description and photos.
- Regularly check competitor amenities in Itaboraí to stay competitive.
Itaboraí Airbnb Guest Demographics & Profile Analysis (2026)
Guest Profile Summary for Itaboraí
- The typical guest profile for Airbnb in Itaboraí consists of primarily domestic travelers (95%), often arriving from nearby Rio de Janeiro, typically belonging to the Post-2000s (Gen Z/Alpha) group (50%), primarily speaking Portuguese or English.
- Domestic travelers account for 95.4% of guests.
- Key international markets include Brazil (95.4%) and Spain (0.7%).
- Top languages spoken are Portuguese (62.4%) followed by English (22.6%).
- A significant demographic segment is the Post-2000s (Gen Z/Alpha) group, representing 50% of guests.
Recommendations for Hosts
- Target domestic marketing efforts towards travelers from Rio de Janeiro and Itaboraí.
- Tailor amenities and listing descriptions to appeal to the dominant Post-2000s (Gen Z/Alpha) demographic (e.g., highlight fast WiFi, smart home features, local guides).
- Highlight unique local experiences or amenities relevant to the primary guest profile.
- Consider seasonal promotions aligned with peak travel times for key origin markets.
Nearby Short-Term Rental Market Comparison
How does the Itaboraí Airbnb market stack up against its neighbors? Compare key performance metrics like average monthly revenue, ADR, and occupancy rates in surrounding areas to understand the broader regional STR landscape.
| Market | Active Properties | Monthly Revenue | Daily Rate | Avg. Occupancy |
|---|---|---|---|---|
| Areal | 82 | $1,532 | $198.25 | 30% |
| Armação dos Búzios | 4,351 | $1,216 | $171.43 | 34% |
| Rio de Janeiro | 27,660 | $1,085 | $106.45 | 43% |
| Petrópolis | 2,096 | $964 | $143.70 | 27% |
| Paraíba do Sul | 49 | $930 | $208.87 | 25% |
| Guapimirim | 142 | $778 | $123.54 | 27% |
| Teresópolis | 758 | $688 | $110.18 | 29% |
| Niterói | 986 | $687 | $85.16 | 37% |
| Magé | 31 | $680 | $140.31 | 22% |
| Arraial do Cabo | 3,149 | $635 | $82.15 | 33% |