Cabo Frio Airbnb Market Analysis 2026: Short Term Rental Data & Vacation Rental Statistics in Rio de Janeiro, Brazil
Is Airbnb profitable in Cabo Frio in 2026? Explore comprehensive Airbnb analytics for Cabo Frio, Rio de Janeiro, Brazil to uncover income potential. This 2026 STR market report for Cabo Frio, based on AirROI data from February 2025 to January 2026, reveals key trends in the bustling market of 5,512 active listings.
Whether you're considering an Airbnb investment in Cabo Frio, optimizing your existing vacation rental, or exploring rental arbitrage opportunities, understanding the Cabo Frio Airbnb data is crucial. Leveraging the low regulation environment is key to maximizing your short term rental income potential. Let's dive into the specifics.
Key Cabo Frio Airbnb Performance Metrics Overview
Monthly Airbnb Revenue Variations & Income Potential in Cabo Frio (2026)
Understanding the monthly revenue variations for Airbnb listings in Cabo Frio is key to maximizing your short term rental income potential. Seasonality significantly impacts earnings. Our analysis, based on data from the past 12 months, shows that the peak revenue month for STRs in Cabo Frio is typically January, while June often presents the lowest earnings, highlighting opportunities for strategic pricing adjustments during shoulder and low seasons. Explore the typical Airbnb income in Cabo Frio across different performance tiers:
- Best-in-class properties (Top 10%) achieve $1,775+ monthly, often utilizing dynamic pricing and superior guest experiences.
- Strong performing properties (Top 25%) earn $1,067 or more, indicating effective management and desirable locations/amenities.
- Typical properties (Median) generate around $526 per month, representing the average market performance.
- Entry-level properties (Bottom 25%) see earnings around $227, often with potential for optimization.
Average Monthly Airbnb Earnings Trend in Cabo Frio
Cabo Frio Airbnb Occupancy Rate Trends (2026)
Maximize your bookings by understanding the Cabo Frio STR occupancy trends. Seasonal demand shifts significantly influence how often properties are booked. Typically, Marchsees the highest demand (peak season occupancy), while June experiences the lowest (low season). Effective strategies, like adjusting minimum stays or offering promotions, can boost occupancy during slower periods. Here's how different property tiers perform in Cabo Frio:
- Best-in-class properties (Top 10%) achieve 74%+ occupancy, indicating high desirability and potentially optimized availability.
- Strong performing properties (Top 25%) maintain 51% or higher occupancy, suggesting good market fit and guest satisfaction.
- Typical properties (Median) have an occupancy rate around 26%.
- Entry-level properties (Bottom 25%) average 11% occupancy, potentially facing higher vacancy.
Average Monthly Occupancy Rate Trend in Cabo Frio
Average Daily Rate (ADR) Airbnb Trends in Cabo Frio (2026)
Effective short term rental pricing strategy in Cabo Frio involves understanding monthly ADR fluctuations. The Average Daily Rate (ADR) for Airbnb in Cabo Frio typically peaks in January and dips lowest during April. Leveraging Airbnb dynamic pricing tools or strategies based on this seasonality can significantly boost revenue. Here's a look at the typical nightly rates achieved:
- Best-in-class properties (Top 10%) command rates of $146+ per night, often due to premium features or locations.
- Strong performing properties (Top 25%) achieve nightly rates of $100 or more.
- Typical properties (Median) charge around $67 per night.
- Entry-level properties (Bottom 25%) earn around $45 per night.
Average Daily Rate (ADR) Trend by Month in Cabo Frio
Get Live Cabo Frio Market Intelligence 👇
Explore Real-time Analytics
Airbnb Seasonality Analysis & Trends in Cabo Frio (2026)
Peak Season (January, March, December)
- Revenue averages $1,152 per month
- Occupancy rates average 37.6%
- Daily rates average $97
Shoulder Season
- Revenue averages $757 per month
- Occupancy maintains around 34.2%
- Daily rates hold near $82
Low Season (June, August, September)
- Revenue drops to average $520 per month
- Occupancy decreases to average 25.9%
- Daily rates adjust to average $80
Seasonality Insights for Cabo Frio
- The Airbnb seasonality in Cabo Frio shows highly seasonal trends requiring careful strategy. While the sections above show seasonal averages, it's also insightful to look at the extremes:
- During the high season, the absolute peak month showcases Cabo Frio's highest earning potential, with monthly revenues capable of climbing to $1,301, occupancy reaching a high of 43.9%, and ADRs peaking at $106.
- Conversely, the slowest single month of the year, typically falling within the low season, marks the market's lowest point. In this month, revenue might dip to $477, occupancy could drop to 23.1%, and ADRs may adjust down to $77.
- Understanding both the seasonal averages and these monthly peaks and troughs in revenue, occupancy, and ADR is crucial for maximizing your Airbnb profit potential in Cabo Frio.
Seasonal Strategies for Maximizing Profit
- Peak Season: Maximize revenue through premium pricing and potentially longer minimum stays. Ensure high availability.
- Low Season: Offer competitive pricing, special promotions (e.g., extended stay discounts), and flexible cancellation policies. Target off-season travelers like remote workers or budget-conscious guests.
- Shoulder Seasons: Implement dynamic pricing that balances peak and low rates. Target weekend travelers or specific events. Offer slightly more flexible terms than peak season.
- Regularly analyze your own performance against these Cabo Frio seasonality benchmarks and adjust your pricing and availability strategy accordingly.
Best Areas for Airbnb Investment in Cabo Frio (2026)
Exploring the top neighborhoods for short-term rentals in Cabo Frio? This section highlights key areas, outlining why they are attractive for hosts and guests, along with notable local attractions. Consider these locations based on your target guest profile and investment strategy.
| Neighborhood / Area | Why Host Here? (Target Guests & Appeal) | Key Attractions & Landmarks |
|---|---|---|
| Praia do Forte | One of the most popular beaches in Cabo Frio, known for its clear waters and vibrant nightlife. Ideal for attracting tourists looking for sun and relaxation. | Fort of São Mateus, Praia do Forte, Cultural Center of Cabo Frio, Handicraft Market, Cabo Frio Lighthouse |
| Canal do Itajuru | A picturesque canal area that offers scenic views and a variety of restaurants and bars. Great for visitors who enjoy waterfront activities and dining. | Itajuru Canal, Food trucks at the canal, Boat tours, Shops and boutiques, Cultural events, Waterfront promenade |
| Peró Beach | Known for its tranquil atmosphere and beautiful scenery, Peró Beach attracts families and those looking to escape the busier tourist areas. | Praia do Peró, Walk to the island of Japones, Dunes of Peró, Restaurants and kiosks, Beach sports activities |
| Brava Beach | A more secluded and pristine beach, perfect for those looking for a peaceful getaway. Ideal for nature lovers and adventure tourists. | Brava Beach, Trekking trails, Nature walks, Snorkeling spots, Sunset views |
| Centro de Cabo Frio | The central area of Cabo Frio, close to shops, restaurants, and historical sites. Offers convenience for guests wanting to explore the city. | Rua dos Biquínis, Historic Churches, P Praça da Cidadania, Shopping and dining options, Local markets |
| Forte Beach | Another popular beach close to the city center, perfect for sunbathing and water sports. It's well-suited for tourists looking for beachside accommodations. | Lifeguard stations, Local surf schools, Bars and nightlife, Beach activities, Scenic viewpoints |
| Gardens of São Pedro | A quieter residential area with beautiful gardens, great for visitors seeking a more relaxed environment while still being close to the beaches. | Local parks, Walking trails, Cafes and small restaurants, Family-friendly atmosphere |
| Palmeiras Beach | Less crowded than other beaches, Palmeiras Beach is ideal for those desiring a low-key environment and natural beauty, perfect for relaxation and picnics. | Pristine nature, Beachfront cafes, Peaceful atmosphere, Local wildlife observing, Photography spots |
Understanding Airbnb License Requirements & STR Laws in Cabo Frio (2026)
While Cabo Frio, Rio de Janeiro, Brazil currently shows low STR regulations, specific Airbnb license requirements might still exist or change. Always verify the latest short term rental regulations and Airbnb license requirements directly with local government authorities for Cabo Frio to ensure full compliance before hosting.
(Source: AirROI data, 2026, based on 0% licensed listings)
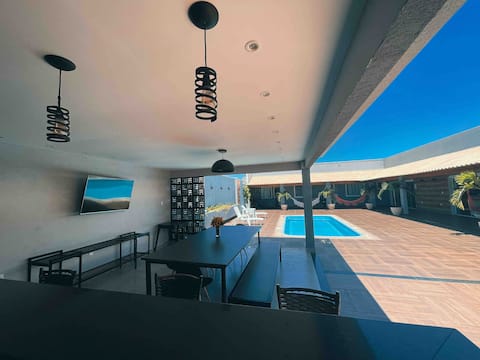
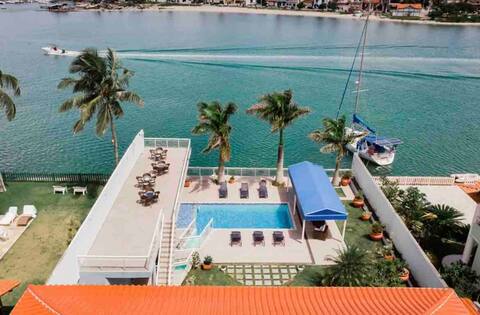
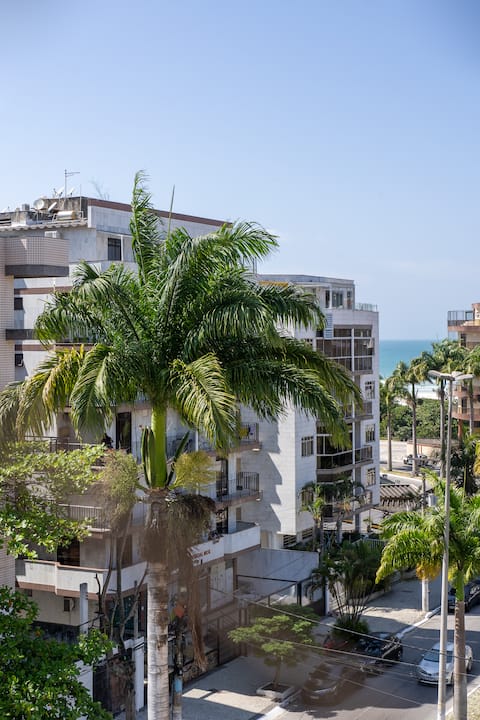
Top Performing Airbnb Properties in Cabo Frio (2026)
Benchmark your potential! Explore examples of top-performing Airbnb properties in Cabo Friobased on Trailing Twelve Month (TTM) revenue. Analyze their characteristics, revenue, occupancy rate, and ADR to understand what drives success in this market.

Casa do Beiral Azul 6 Qts Foot in the sand Pool
Entire Place • 6 bedrooms
Beautiful mansion House with 8 bedrooms 9 bathrooms
Entire Place • 8 bedrooms

Cf04 Praia do Forte!Seafront penthouse with pool
Entire Place • 4 bedrooms
Waterfront mansion with 10 complete en-suites
Entire Place • 10 bedrooms
3 bedrooms, 200 meters from PRAIA DO FORTE + Garage and Balconies
Entire Place • 3 bedrooms
200 meters from FORTE BEACH + View, Garage and Balconies
Entire Place • 4 bedrooms
Note: Performance varies based on location, size, amenities, seasonality, and management quality. Data reflects the past 12 months.
Top Performing Airbnb Hosts in Cabo Frio (2026)
Learn from the best! This table showcases top-performing Airbnb hosts in Cabo Frio based on the number of properties managed and estimated total revenue over the past year. Analyze their scale and performance metrics.
| Host Name | Properties | Grossing Revenue | Stay Reviews | Avg Rating |
|---|---|---|---|---|
| Heitor | 40 | $812,120 | 2509 | 4.76/5.0 |
| Paulo Henrique | 35 | $701,576 | 1689 | 4.80/5.0 |
| Carlos Eduardo | 95 | $459,190 | 1508 | 4.45/5.0 |
| Kelly & Dom | 10 | $284,612 | 1157 | 4.91/5.0 |
| Allan | 20 | $276,634 | 407 | 4.78/5.0 |
| Mariane | 14 | $275,349 | 698 | 4.94/5.0 |
| Gabi Airbnb | 24 | $269,368 | 2884 | 4.79/5.0 |
| Marcio | 11 | $219,857 | 291 | 4.84/5.0 |
| Catia | 15 | $217,581 | 359 | 4.85/5.0 |
| Ana Carolina | 23 | $161,753 | 253 | 4.75/5.0 |
Analyzing the strategies of top hosts, such as their property selection, pricing, and guest communication, can offer valuable lessons for optimizing your own Airbnb operations in Cabo Frio.
Dive Deeper: Advanced Cabo Frio STR Market Data (2026)
Ready to unlock more insights? AirROI provides access to advanced metrics and comprehensive Airbnb data for Cabo Frio. Explore detailed analytics beyond this report to refine your investment strategy, optimize pricing, and maximize your vacation rental profits.
Explore Advanced MetricsCabo Frio Short-Term Rental Market Composition (2026): Property & Room Types
Room Type Distribution
Property Type Distribution
Market Composition Insights for Cabo Frio
- The Cabo Frio Airbnb market composition is heavily skewed towards Entire Home/Apt listings, which make up 92.9% of the 5,512 active rentals. This indicates strong guest preference for privacy and space.
- Looking at the property type distribution in Cabo Frio, Apartment/Condo properties are the most common (54.5%), reflecting the local real estate landscape.
- Houses represent a significant 40.9% portion, catering likely to families or larger groups.
- Smaller segments like hotel/boutique, others, outdoor/unique, unique stays (combined 4.6%) offer potential for unique stay experiences.
Cabo Frio Airbnb Room Capacity Analysis (2026): Bedroom Distribution
Distribution of Listings by Number of Bedrooms
Room Capacity Insights for Cabo Frio
- The dominant room capacity in Cabo Frio is 2 bedrooms listings, making up 33.4% of the market. This suggests a strong demand for properties suitable for couples or solo travelers.
- Together, 2 bedrooms and 1 bedroom properties represent 59.0% of the active Airbnb listings in Cabo Frio, indicating a high concentration in these sizes.
- A significant 34.8% of listings offer 3+ bedrooms, catering to larger groups and families seeking more space in Cabo Frio.
Cabo Frio Vacation Rental Guest Capacity Trends (2026)
Distribution of Listings by Guest Capacity
Guest Capacity Insights for Cabo Frio
- The most common guest capacity trend in Cabo Frio vacation rentals is listings accommodating 8+ guests (39.1%). This suggests the primary traveler segment is likely larger groups.
- Properties designed for 8+ guests and 6 guests dominate the Cabo Frio STR market, accounting for 60.5% of listings.
- 65.0% of properties accommodate 6+ guests, serving the market segment for larger families or group travel in Cabo Frio.
- On average, properties in Cabo Frio are equipped to host 5.9 guests.
Cabo Frio Airbnb Booking Patterns (2026): Available vs. Booked Days
Available Days Distribution
Booked Days Distribution
Booking Pattern Insights for Cabo Frio
- The most common availability pattern in Cabo Frio falls within the 271-366 days range, representing 71.2% of listings. This suggests many properties have significant open periods on their calendars.
- Approximately 90.4% of listings show high availability (181+ days open annually), indicating potential for increased bookings or specific owner usage patterns.
- For booked days, the 1-30 days range is most frequent in Cabo Frio (36.7%), reflecting common guest stay durations or potential owner blocking patterns.
- A notable 10.0% of properties secure long booking periods (181+ days booked per year), highlighting successful long-term rental strategies or significant owner usage.
Cabo Frio Airbnb Minimum Stay Requirements Analysis
Distribution of Listings by Minimum Night Requirement
1 Night
777 listings
14.1% of total
2 Nights
1845 listings
33.5% of total
3 Nights
621 listings
11.3% of total
4-6 Nights
317 listings
5.8% of total
7-29 Nights
23 listings
0.4% of total
30+ Nights
1929 listings
35% of total
Key Insights
- The most prevalent minimum stay requirement in Cabo Frio is 30+ Nights, adopted by 35% of listings. This highlights the market's preference for longer commitments.
- A significant segment (35%) caters to monthly stays (30+ nights) in Cabo Frio, pointing to opportunities in the extended-stay market.
Recommendations
- Align with the market by considering a 30+ Nights minimum stay, as 35% of Cabo Frio hosts use this setting.
- If feasible, allowing 1-night stays, especially midweek or during low season, could capture last-minute bookings, as only 14.1% currently do.
- A 2-night minimum appears standard (33.5%). Consider this for weekends or peak periods.
- Explore offering discounts for stays of 30+ nights to attract the 35% of the market seeking extended stays.
- Adjust minimum nights based on seasonality – potentially shorter during low season and longer during peak demand periods in Cabo Frio.
Cabo Frio Airbnb Cancellation Policy Trends Analysis (2026)
Limited
110 listings
2% of total
Super Strict 60 Days
111 listings
2% of total
Super Strict 30 Days
18 listings
0.3% of total
Flexible
1211 listings
22.1% of total
Moderate
1102 listings
20.1% of total
Firm
2177 listings
39.7% of total
Strict
758 listings
13.8% of total
Cancellation Policy Insights for Cabo Frio
- The prevailing Airbnb cancellation policy trend in Cabo Frio is Firm, used by 39.7% of listings.
- A majority (53.5%) of hosts in Cabo Frio utilize Firm or Strict policies, indicating a market where hosts prioritize booking security.
Recommendations for Hosts
- Consider adopting a Firm policy to align with the 39.7% market standard in Cabo Frio.
- Using a Strict policy might deter some guests, as only 13.8% of listings use it. Evaluate if potential revenue protection outweighs possible lower booking rates.
- Regularly review your cancellation policy against competitors and market demand shifts in Cabo Frio.
Cabo Frio STR Booking Lead Time Analysis (2026)
Average Booking Lead Time by Month
Booking Lead Time Insights for Cabo Frio
- The overall average booking lead time for vacation rentals in Cabo Frio is 43 days.
- Guests book furthest in advance for stays during December (average 65 days), likely coinciding with peak travel demand or local events.
- The shortest booking windows occur for stays in June (average 20 days), indicating more last-minute travel plans during this time.
- Seasonally, Winter (52 days avg.) sees the longest lead times, while Summer (24 days avg.) has the shortest, reflecting typical travel planning cycles.
Recommendations for Hosts
- Use the overall average lead time (43 days) as a baseline for your pricing and availability strategy in Cabo Frio.
- For December stays, consider implementing length-of-stay discounts or slightly higher rates for bookings made less than 65 days out to capitalize on advance planning.
- Target marketing efforts for the Winter season well in advance (at least 52 days) to capture early planners.
- Monitor your own booking lead times against these Cabo Frio averages to identify opportunities for dynamic pricing adjustments.
Popular & Essential Airbnb Amenities in Cabo Frio (2026)
Amenity Prevalence
Amenity Insights for Cabo Frio
- Essential amenities in Cabo Frio that guests expect include: TV. Lacking these (this) could significantly impact bookings.
- Popular amenities like Kitchen, Wifi, Free parking on premises are common but not universal. Offering these can provide a competitive edge.
- Warning: Wifi is not universally provided but is considered essential globally. Ensure reliable Wifi is offered.
Recommendations for Hosts
- Ensure your listing includes all essential amenities for Cabo Frio: TV.
- Prioritize adding missing essentials: TV.
- Consider adding popular differentiators like Kitchen or Wifi to increase appeal.
- Highlight unique or less common amenities you offer (e.g., hot tub, dedicated workspace, EV charger) in your listing description and photos.
- Regularly check competitor amenities in Cabo Frio to stay competitive.
Cabo Frio Airbnb Guest Demographics & Profile Analysis (2026)
Guest Profile Summary for Cabo Frio
- The typical guest profile for Airbnb in Cabo Frio consists of primarily domestic travelers (86%), often arriving from nearby Rio de Janeiro, typically belonging to the Post-2000s (Gen Z/Alpha) group (50%), primarily speaking Portuguese or English.
- Domestic travelers account for 86.2% of guests.
- Key international markets include Brazil (86.2%) and Argentina (7.1%).
- Top languages spoken are Portuguese (49.5%) followed by English (25.7%).
- A significant demographic segment is the Post-2000s (Gen Z/Alpha) group, representing 50% of guests.
Recommendations for Hosts
- Target domestic marketing efforts towards travelers from Rio de Janeiro and Belo Horizonte.
- Tailor amenities and listing descriptions to appeal to the dominant Post-2000s (Gen Z/Alpha) demographic (e.g., highlight fast WiFi, smart home features, local guides).
- Highlight unique local experiences or amenities relevant to the primary guest profile.
- Consider seasonal promotions aligned with peak travel times for key origin markets.
Nearby Short-Term Rental Market Comparison
How does the Cabo Frio Airbnb market stack up against its neighbors? Compare key performance metrics like average monthly revenue, ADR, and occupancy rates in surrounding areas to understand the broader regional STR landscape.
| Market | Active Properties | Monthly Revenue | Daily Rate | Avg. Occupancy |
|---|---|---|---|---|
| Armação dos Búzios | 4,351 | $1,216 | $171.43 | 34% |
| Guapimirim | 142 | $778 | $123.54 | 27% |
| Itaboraí | 42 | $734 | $138.13 | 28% |
| Teresópolis | 758 | $688 | $110.18 | 29% |
| Arraial do Cabo | 3,149 | $635 | $82.15 | 33% |
| Maricá | 527 | $517 | $94.87 | 26% |
| Rio Bonito | 15 | $492 | $119.15 | 20% |
| New Fribourg | 947 | $490 | $75.99 | 28% |
| Silva Jardim | 44 | $477 | $95.08 | 21% |
| Casimiro de Abreu | 97 | $475 | $86.62 | 22% |