Araruama Airbnb Market Analysis 2026: Short Term Rental Data & Vacation Rental Statistics in Rio de Janeiro, Brazil
Is Airbnb profitable in Araruama in 2026? Explore comprehensive Airbnb analytics for Araruama, Rio de Janeiro, Brazil to uncover income potential. This 2026 STR market report for Araruama, based on AirROI data from February 2025 to January 2026, reveals key trends in the market of 434 active listings.
Whether you're considering an Airbnb investment in Araruama, optimizing your existing vacation rental, or exploring rental arbitrage opportunities, understanding the Araruama Airbnb data is crucial. Leveraging the low regulation environment is key to maximizing your short term rental income potential. Let's dive into the specifics.
Key Araruama Airbnb Performance Metrics Overview
Monthly Airbnb Revenue Variations & Income Potential in Araruama (2026)
Understanding the monthly revenue variations for Airbnb listings in Araruama is key to maximizing your short term rental income potential. Seasonality significantly impacts earnings. Our analysis, based on data from the past 12 months, shows that the peak revenue month for STRs in Araruama is typically March, while August often presents the lowest earnings, highlighting opportunities for strategic pricing adjustments during shoulder and low seasons. Explore the typical Airbnb income in Araruama across different performance tiers:
- Best-in-class properties (Top 10%) achieve $1,632+ monthly, often utilizing dynamic pricing and superior guest experiences.
- Strong performing properties (Top 25%) earn $941 or more, indicating effective management and desirable locations/amenities.
- Typical properties (Median) generate around $451 per month, representing the average market performance.
- Entry-level properties (Bottom 25%) see earnings around $203, often with potential for optimization.
Average Monthly Airbnb Earnings Trend in Araruama
Araruama Airbnb Occupancy Rate Trends (2026)
Maximize your bookings by understanding the Araruama STR occupancy trends. Seasonal demand shifts significantly influence how often properties are booked. Typically, Marchsees the highest demand (peak season occupancy), while August experiences the lowest (low season). Effective strategies, like adjusting minimum stays or offering promotions, can boost occupancy during slower periods. Here's how different property tiers perform in Araruama:
- Best-in-class properties (Top 10%) achieve 61%+ occupancy, indicating high desirability and potentially optimized availability.
- Strong performing properties (Top 25%) maintain 39% or higher occupancy, suggesting good market fit and guest satisfaction.
- Typical properties (Median) have an occupancy rate around 20%.
- Entry-level properties (Bottom 25%) average 9% occupancy, potentially facing higher vacancy.
Average Monthly Occupancy Rate Trend in Araruama
Average Daily Rate (ADR) Airbnb Trends in Araruama (2026)
Effective short term rental pricing strategy in Araruama involves understanding monthly ADR fluctuations. The Average Daily Rate (ADR) for Airbnb in Araruama typically peaks in December and dips lowest during April. Leveraging Airbnb dynamic pricing tools or strategies based on this seasonality can significantly boost revenue. Here's a look at the typical nightly rates achieved:
- Best-in-class properties (Top 10%) command rates of $168+ per night, often due to premium features or locations.
- Strong performing properties (Top 25%) achieve nightly rates of $113 or more.
- Typical properties (Median) charge around $75 per night.
- Entry-level properties (Bottom 25%) earn around $47 per night.
Average Daily Rate (ADR) Trend by Month in Araruama
Get Live Araruama Market Intelligence 👇

Explore Real-time Analytics
Airbnb Seasonality Analysis & Trends in Araruama (2026)
Peak Season (March, January, December)
- Revenue averages $1,023 per month
- Occupancy rates average 33.2%
- Daily rates average $96
Shoulder Season
- Revenue averages $683 per month
- Occupancy maintains around 27.9%
- Daily rates hold near $89
Low Season (June, August, September)
- Revenue drops to average $447 per month
- Occupancy decreases to average 19.6%
- Daily rates adjust to average $89
Seasonality Insights for Araruama
- The Airbnb seasonality in Araruama shows highly seasonal trends requiring careful strategy. While the sections above show seasonal averages, it's also insightful to look at the extremes:
- During the high season, the absolute peak month showcases Araruama's highest earning potential, with monthly revenues capable of climbing to $1,060, occupancy reaching a high of 37.4%, and ADRs peaking at $100.
- Conversely, the slowest single month of the year, typically falling within the low season, marks the market's lowest point. In this month, revenue might dip to $407, occupancy could drop to 18.2%, and ADRs may adjust down to $85.
- Understanding both the seasonal averages and these monthly peaks and troughs in revenue, occupancy, and ADR is crucial for maximizing your Airbnb profit potential in Araruama.
Seasonal Strategies for Maximizing Profit
- Peak Season: Maximize revenue through premium pricing and potentially longer minimum stays. Ensure high availability.
- Low Season: Offer competitive pricing, special promotions (e.g., extended stay discounts), and flexible cancellation policies. Target off-season travelers like remote workers or budget-conscious guests.
- Shoulder Seasons: Implement dynamic pricing that balances peak and low rates. Target weekend travelers or specific events. Offer slightly more flexible terms than peak season.
- Regularly analyze your own performance against these Araruama seasonality benchmarks and adjust your pricing and availability strategy accordingly.
Best Areas for Airbnb Investment in Araruama (2026)
Exploring the top neighborhoods for short-term rentals in Araruama? This section highlights key areas, outlining why they are attractive for hosts and guests, along with notable local attractions. Consider these locations based on your target guest profile and investment strategy.
| Neighborhood / Area | Why Host Here? (Target Guests & Appeal) | Key Attractions & Landmarks |
|---|---|---|
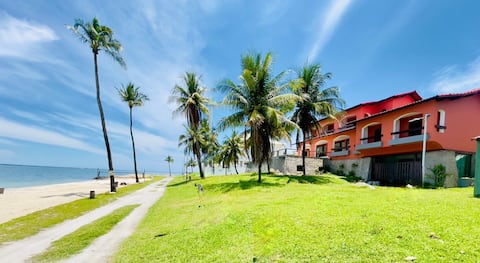
| Praia de Araruama | One of the most beautiful beaches in the region, appropriate for relaxation and water sports. Popular among families and tourists looking for sun and sea. | Praia do Vargas, Igreja Matriz de São Sebastião, Parque Municipal de Araruama, Shopping Araruama, Dunas do Pontal, Ponte do Lacerda |
| Centro | The central area of Araruama, known for its local shops and markets, making it a convenient location for visitors wanting to experience local culture. | Cultural Center, Mercado Municipal, Praça Menino João Hélio, Teatro Municipal, Igreja de São Sebastião |
| Praia do Pontinho | A serene beach with calm waters ideal for fishing and relaxing. Attracts nature lovers and those looking for a peaceful getaway. | Praia da Pontinha, Pólo de Atrações Naturais, Caminho das Praias, Villa Araruama, Restaurante Aconchego |
| Balneário | A neighborhood that offers a mix of leisure and local lifestyle. It's a family-friendly spot with easy access to outdoor activities. | Balneário de Araruama, Praia do Areal, Parque Ecológico do Barro Branco, Ponta do Quebraçu, Mirante do Morro do Açu |
| Búzios | Although not in Araruama itself, it's close and a well-known tourist destination. Offers a wide range of luxury and leisure activities for visitors. | Rua das Pedras, Praia de Geribá, Praia da Tartaruga, Orla Bardot, Azeda Beach |
| Iguaba Grande | Another neighboring town with beautiful beaches and a more laid-back atmosphere compared to Araruama. It's becoming popular for short stays. | Praia do Centro, Igreja Nossa Senhora da Luz, Lagoa de Araruama, Praia do Sapê, Parque Natural Municipal |
| Saquarema | Well-known for its surfing spots, Saquarema is just a short drive and attracts a younger crowd looking for beach sports and nightlife. | Praia de Saquarema, Igreja de Nossa Senhora de Nazareth, Lagoa de Saquarema, Festa do Surf, Praia da Vila |
| Bandeirantes | A residential area that has become a hub for short-term rentals, attracting local tourists looking for a quiet stay while being close to main attractions. | Praia das Conchas, Casa da Música, Morro da Cruz, Parque Natural Municipal das Conchas, Praia Brava |
Understanding Airbnb License Requirements & STR Laws in Araruama (2026)
While Araruama, Rio de Janeiro, Brazil currently shows low STR regulations, specific Airbnb license requirements might still exist or change. Always verify the latest short term rental regulations and Airbnb license requirements directly with local government authorities for Araruama to ensure full compliance before hosting.
(Source: AirROI data, 2026, finding no licensed listings among those analyzed)
Top Performing Airbnb Properties in Araruama (2026)
Benchmark your potential! Explore examples of top-performing Airbnb properties in Araruamabased on Trailing Twelve Month (TTM) revenue. Analyze their characteristics, revenue, occupancy rate, and ADR to understand what drives success in this market.
Beach house - Swimming pool and barbecue area.
Entire Place • 5 bedrooms

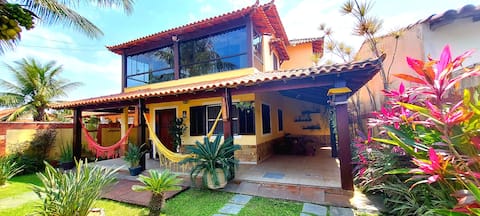
Dream retreat, Beachfront 2 suites on the beach
Entire Place • 2 bedrooms
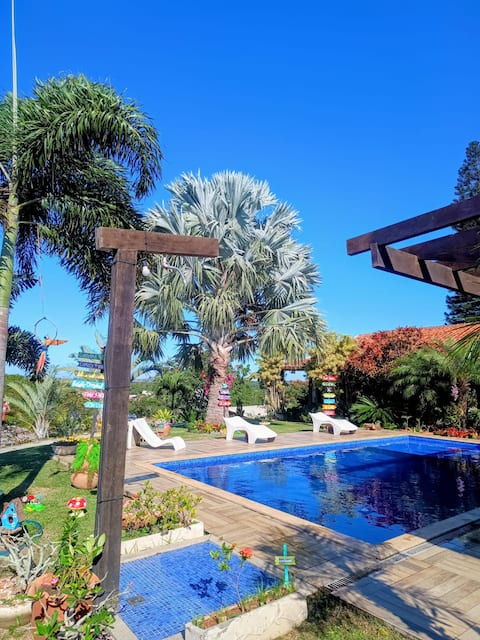
Entire House with Pool to Enjoy on Vacation
Entire Place • 4 bedrooms

House with Pool (20 people) - Araruama, RJ
Entire Place • 5 bedrooms

Large house facing the lagoon in Praia Seca - RJ
Entire Place • 5 bedrooms
House with pool and barbecue area in Araruama/RJ
Entire Place • 3 bedrooms
Note: Performance varies based on location, size, amenities, seasonality, and management quality. Data reflects the past 12 months.
Top Performing Airbnb Hosts in Araruama (2026)
Learn from the best! This table showcases top-performing Airbnb hosts in Araruama based on the number of properties managed and estimated total revenue over the past year. Analyze their scale and performance metrics.
| Host Name | Properties | Grossing Revenue | Stay Reviews | Avg Rating |
|---|---|---|---|---|
| Nelson | 1 | $57,400 | 26 | 5.00/5.0 |
| Gilberto | 1 | $32,390 | 51 | 5.00/5.0 |
| Marlon | 1 | $29,194 | 133 | 5.00/5.0 |
| Manoel | 1 | $28,953 | 55 | 4.89/5.0 |
| Milton | 1 | $28,735 | 53 | 5.00/5.0 |
| Claudia | 1 | $27,801 | 53 | 4.98/5.0 |
| Daniele | 3 | $27,590 | 24 | 5.00/5.0 |
| Edinaldo Alves | 1 | $26,807 | 7 | 5.00/5.0 |
| Alain | 1 | $26,194 | 10 | 4.90/5.0 |
| Lucia | 1 | $25,771 | 122 | 4.70/5.0 |
Analyzing the strategies of top hosts, such as their property selection, pricing, and guest communication, can offer valuable lessons for optimizing your own Airbnb operations in Araruama.
Dive Deeper: Advanced Araruama STR Market Data (2026)
Ready to unlock more insights? AirROI provides access to advanced metrics and comprehensive Airbnb data for Araruama. Explore detailed analytics beyond this report to refine your investment strategy, optimize pricing, and maximize your vacation rental profits.
Explore Advanced MetricsAraruama Short-Term Rental Market Composition (2026): Property & Room Types
Room Type Distribution
Property Type Distribution
Market Composition Insights for Araruama
- The Araruama Airbnb market composition is heavily skewed towards Entire Home/Apt listings, which make up 92.4% of the 434 active rentals. This indicates strong guest preference for privacy and space.
- Looking at the property type distribution in Araruama, House properties are the most common (86.2%), reflecting the local real estate landscape.
- Houses represent a significant 86.2% portion, catering likely to families or larger groups.
- The presence of 6.5% Hotel/Boutique listings indicates integration with traditional hospitality.
- Smaller segments like outdoor/unique, others (combined 1.4%) offer potential for unique stay experiences.
Araruama Airbnb Room Capacity Analysis (2026): Bedroom Distribution
Distribution of Listings by Number of Bedrooms
Room Capacity Insights for Araruama
- The dominant room capacity in Araruama is 3 bedrooms listings, making up 31.1% of the market. This suggests a strong demand for properties suitable for families or small groups.
- Together, 3 bedrooms and 2 bedrooms properties represent 59.7% of the active Airbnb listings in Araruama, indicating a high concentration in these sizes.
- A significant 52.3% of listings offer 3+ bedrooms, catering to larger groups and families seeking more space in Araruama.
Araruama Vacation Rental Guest Capacity Trends (2026)
Distribution of Listings by Guest Capacity
Guest Capacity Insights for Araruama
- The most common guest capacity trend in Araruama vacation rentals is listings accommodating 8+ guests (59.7%). This suggests the primary traveler segment is likely larger groups.
- Properties designed for 8+ guests and 6 guests dominate the Araruama STR market, accounting for 73.1% of listings.
- 78.2% of properties accommodate 6+ guests, serving the market segment for larger families or group travel in Araruama.
- On average, properties in Araruama are equipped to host 6.5 guests.
Araruama Airbnb Booking Patterns (2026): Available vs. Booked Days
Available Days Distribution
Booked Days Distribution
Booking Pattern Insights for Araruama
- The most common availability pattern in Araruama falls within the 271-366 days range, representing 75.1% of listings. This suggests many properties have significant open periods on their calendars.
- Approximately 95.4% of listings show high availability (181+ days open annually), indicating potential for increased bookings or specific owner usage patterns.
- For booked days, the 1-30 days range is most frequent in Araruama (42.6%), reflecting common guest stay durations or potential owner blocking patterns.
- A notable 5.3% of properties secure long booking periods (181+ days booked per year), highlighting successful long-term rental strategies or significant owner usage.
Araruama Airbnb Minimum Stay Requirements Analysis
Distribution of Listings by Minimum Night Requirement
1 Night
83 listings
19.1% of total
2 Nights
192 listings
44.2% of total
3 Nights
28 listings
6.5% of total
4-6 Nights
12 listings
2.8% of total
30+ Nights
119 listings
27.4% of total
Key Insights
- The most prevalent minimum stay requirement in Araruama is 2 Nights, adopted by 44.2% of listings. This highlights the market's preference for shorter, flexible bookings.
- A strong majority (63.3%) of the Araruama Airbnb data shows acceptance of very short stays (1-2 nights), indicating a dynamic, high-turnover market.
- A significant segment (27.4%) caters to monthly stays (30+ nights) in Araruama, pointing to opportunities in the extended-stay market.
Recommendations
- Align with the market by considering a 2 Nights minimum stay, as 44.2% of Araruama hosts use this setting.
- If feasible, allowing 1-night stays, especially midweek or during low season, could capture last-minute bookings, as only 19.1% currently do.
- A 2-night minimum appears standard (44.2%). Consider this for weekends or peak periods.
- Explore offering discounts for stays of 30+ nights to attract the 27.4% of the market seeking extended stays.
- Adjust minimum nights based on seasonality – potentially shorter during low season and longer during peak demand periods in Araruama.
Araruama Airbnb Cancellation Policy Trends Analysis (2026)
Super Strict 30 Days
1 listings
0.2% of total
Limited
5 listings
1.2% of total
Flexible
139 listings
32.3% of total
Moderate
111 listings
25.8% of total
Firm
118 listings
27.4% of total
Strict
56 listings
13% of total
Cancellation Policy Insights for Araruama
- The prevailing Airbnb cancellation policy trend in Araruama is Flexible, used by 32.3% of listings.
- There's a relatively balanced mix between guest-friendly (58.1%) and stricter (40.4%) policies, offering choices for different guest needs.
Recommendations for Hosts
- Consider adopting a Flexible policy to align with the 32.3% market standard in Araruama.
- Using a Strict policy might deter some guests, as only 13% of listings use it. Evaluate if potential revenue protection outweighs possible lower booking rates.
- Regularly review your cancellation policy against competitors and market demand shifts in Araruama.
Araruama STR Booking Lead Time Analysis (2026)
Average Booking Lead Time by Month
Booking Lead Time Insights for Araruama
- The overall average booking lead time for vacation rentals in Araruama is 35 days.
- Guests book furthest in advance for stays during December (average 60 days), likely coinciding with peak travel demand or local events.
- The shortest booking windows occur for stays in June (average 16 days), indicating more last-minute travel plans during this time.
- Seasonally, Winter (47 days avg.) sees the longest lead times, while Summer (17 days avg.) has the shortest, reflecting typical travel planning cycles.
Recommendations for Hosts
- Use the overall average lead time (35 days) as a baseline for your pricing and availability strategy in Araruama.
- For December stays, consider implementing length-of-stay discounts or slightly higher rates for bookings made less than 60 days out to capitalize on advance planning.
- Target marketing efforts for the Winter season well in advance (at least 47 days) to capture early planners.
- Monitor your own booking lead times against these Araruama averages to identify opportunities for dynamic pricing adjustments.
Popular & Essential Airbnb Amenities in Araruama (2026)
Amenity Prevalence
Amenity Insights for Araruama
- Essential amenities in Araruama that guests expect include: TV, Free parking on premises, Kitchen, Wifi. Lacking these (any) could significantly impact bookings.
- Popular amenities like BBQ grill, Dishes and silverware, Outdoor shower are common but not universal. Offering these can provide a competitive edge.
Recommendations for Hosts
- Ensure your listing includes all essential amenities for Araruama: TV, Free parking on premises, Kitchen, Wifi.
- Prioritize adding missing essentials: TV, Free parking on premises, Kitchen, Wifi.
- Consider adding popular differentiators like BBQ grill or Dishes and silverware to increase appeal.
- Highlight unique or less common amenities you offer (e.g., hot tub, dedicated workspace, EV charger) in your listing description and photos.
- Regularly check competitor amenities in Araruama to stay competitive.
Araruama Airbnb Guest Demographics & Profile Analysis (2026)
Guest Profile Summary for Araruama
- The typical guest profile for Airbnb in Araruama consists of primarily domestic travelers (97%), often arriving from nearby Rio de Janeiro, typically belonging to the Post-2000s (Gen Z/Alpha) group (50%), primarily speaking Portuguese or English.
- Domestic travelers account for 96.5% of guests.
- Key international markets include Brazil (96.5%) and United States (0.9%).
- Top languages spoken are Portuguese (55.2%) followed by English (23.3%).
- A significant demographic segment is the Post-2000s (Gen Z/Alpha) group, representing 50% of guests.
Recommendations for Hosts
- Target domestic marketing efforts towards travelers from Rio de Janeiro and Niterói.
- Tailor amenities and listing descriptions to appeal to the dominant Post-2000s (Gen Z/Alpha) demographic (e.g., highlight fast WiFi, smart home features, local guides).
- Highlight unique local experiences or amenities relevant to the primary guest profile.
- Consider seasonal promotions aligned with peak travel times for key origin markets.
Nearby Short-Term Rental Market Comparison
How does the Araruama Airbnb market stack up against its neighbors? Compare key performance metrics like average monthly revenue, ADR, and occupancy rates in surrounding areas to understand the broader regional STR landscape.
| Market | Active Properties | Monthly Revenue | Daily Rate | Avg. Occupancy |
|---|---|---|---|---|
| Areal | 82 | $1,532 | $198.25 | 30% |
| Armação dos Búzios | 4,351 | $1,216 | $171.43 | 34% |
| Rio de Janeiro | 27,660 | $1,085 | $106.45 | 43% |
| Petrópolis | 2,096 | $964 | $143.70 | 27% |
| Paraíba do Sul | 49 | $930 | $208.87 | 25% |
| Guapimirim | 142 | $778 | $123.54 | 27% |
| Itaboraí | 42 | $734 | $138.13 | 28% |
| Teresópolis | 758 | $688 | $110.18 | 29% |
| Niterói | 986 | $687 | $85.16 | 37% |
| Magé | 31 | $680 | $140.31 | 22% |