João Pessoa Airbnb Market Analysis 2026: Short Term Rental Data & Vacation Rental Statistics in Paraíba, Brazil
Is Airbnb profitable in João Pessoa in 2026? Explore comprehensive Airbnb analytics for João Pessoa, Paraíba, Brazil to uncover income potential. This 2026 STR market report for João Pessoa, based on AirROI data from February 2025 to January 2026, reveals key trends in the bustling market of 4,825 active listings.
Whether you're considering an Airbnb investment in João Pessoa, optimizing your existing vacation rental, or exploring rental arbitrage opportunities, understanding the João Pessoa Airbnb data is crucial. Leveraging the low regulation environment is key to maximizing your short term rental income potential. Let's dive into the specifics.
Key João Pessoa Airbnb Performance Metrics Overview
Monthly Airbnb Revenue Variations & Income Potential in João Pessoa (2026)
Understanding the monthly revenue variations for Airbnb listings in João Pessoa is key to maximizing your short term rental income potential. Seasonality significantly impacts earnings. Our analysis, based on data from the past 12 months, shows that the peak revenue month for STRs in João Pessoa is typically January, while May often presents the lowest earnings, highlighting opportunities for strategic pricing adjustments during shoulder and low seasons. Explore the typical Airbnb income in João Pessoa across different performance tiers:
- Best-in-class properties (Top 10%) achieve $1,529+ monthly, often utilizing dynamic pricing and superior guest experiences.
- Strong performing properties (Top 25%) earn $1,016 or more, indicating effective management and desirable locations/amenities.
- Typical properties (Median) generate around $583 per month, representing the average market performance.
- Entry-level properties (Bottom 25%) see earnings around $268, often with potential for optimization.
Average Monthly Airbnb Earnings Trend in João Pessoa
João Pessoa Airbnb Occupancy Rate Trends (2026)
Maximize your bookings by understanding the João Pessoa STR occupancy trends. Seasonal demand shifts significantly influence how often properties are booked. Typically, Octobersees the highest demand (peak season occupancy), while May experiences the lowest (low season). Effective strategies, like adjusting minimum stays or offering promotions, can boost occupancy during slower periods. Here's how different property tiers perform in João Pessoa:
- Best-in-class properties (Top 10%) achieve 82%+ occupancy, indicating high desirability and potentially optimized availability.
- Strong performing properties (Top 25%) maintain 64% or higher occupancy, suggesting good market fit and guest satisfaction.
- Typical properties (Median) have an occupancy rate around 37%.
- Entry-level properties (Bottom 25%) average 18% occupancy, potentially facing higher vacancy.
Average Monthly Occupancy Rate Trend in João Pessoa
Average Daily Rate (ADR) Airbnb Trends in João Pessoa (2026)
Effective short term rental pricing strategy in João Pessoa involves understanding monthly ADR fluctuations. The Average Daily Rate (ADR) for Airbnb in João Pessoa typically peaks in January and dips lowest during May. Leveraging Airbnb dynamic pricing tools or strategies based on this seasonality can significantly boost revenue. Here's a look at the typical nightly rates achieved:
- Best-in-class properties (Top 10%) command rates of $96+ per night, often due to premium features or locations.
- Strong performing properties (Top 25%) achieve nightly rates of $69 or more.
- Typical properties (Median) charge around $50 per night.
- Entry-level properties (Bottom 25%) earn around $37 per night.
Average Daily Rate (ADR) Trend by Month in João Pessoa
Get Live João Pessoa Market Intelligence 👇

Explore Real-time Analytics
Airbnb Seasonality Analysis & Trends in João Pessoa (2026)
Peak Season (January, December, March)
- Revenue averages $994 per month
- Occupancy rates average 43.0%
- Daily rates average $73
Shoulder Season
- Revenue averages $734 per month
- Occupancy maintains around 43.5%
- Daily rates hold near $60
Low Season (April, May, June)
- Revenue drops to average $569 per month
- Occupancy decreases to average 36.6%
- Daily rates adjust to average $55
Seasonality Insights for João Pessoa
- The Airbnb seasonality in João Pessoa shows highly seasonal trends requiring careful strategy. While the sections above show seasonal averages, it's also insightful to look at the extremes:
- During the high season, the absolute peak month showcases João Pessoa's highest earning potential, with monthly revenues capable of climbing to $1,138, occupancy reaching a high of 47.0%, and ADRs peaking at $84.
- Conversely, the slowest single month of the year, typically falling within the low season, marks the market's lowest point. In this month, revenue might dip to $524, occupancy could drop to 33.8%, and ADRs may adjust down to $54.
- Understanding both the seasonal averages and these monthly peaks and troughs in revenue, occupancy, and ADR is crucial for maximizing your Airbnb profit potential in João Pessoa.
Seasonal Strategies for Maximizing Profit
- Peak Season: Maximize revenue through premium pricing and potentially longer minimum stays. Ensure high availability.
- Low Season: Offer competitive pricing, special promotions (e.g., extended stay discounts), and flexible cancellation policies. Target off-season travelers like remote workers or budget-conscious guests.
- Shoulder Seasons: Implement dynamic pricing that balances peak and low rates. Target weekend travelers or specific events. Offer slightly more flexible terms than peak season.
- Regularly analyze your own performance against these João Pessoa seasonality benchmarks and adjust your pricing and availability strategy accordingly.
Best Areas for Airbnb Investment in João Pessoa (2026)
Exploring the top neighborhoods for short-term rentals in João Pessoa? This section highlights key areas, outlining why they are attractive for hosts and guests, along with notable local attractions. Consider these locations based on your target guest profile and investment strategy.
| Neighborhood / Area | Why Host Here? (Target Guests & Appeal) | Key Attractions & Landmarks |
|---|---|---|
| Tambaú | Vibrant beach area known for its beautiful boardwalk, local markets, and a variety of restaurants and bars. Tambaú attracts both tourists and locals due to its lively atmosphere and beautiful sunsets. | Praia de Tambaú, Mercado de Artesanato Paraibano, Handicraft Market, Estação Cabo Branco, Local restaurants and bars |
| Cabo Branco | Famous for its stunning beaches and the iconic Cabo Branco Lighthouse. This area is popular among tourists seeking a relaxed beach vibe alongside local attractions and restaurants. | Praia do Cabo Branco, Cabo Branco Lighthouse, Ponta do Seixas, Cabo Branco Science and Culture Station |
| Bessa | A quieter beach neighborhood that offers a more local experience. Bessa is great for families and those looking to enjoy the beach without the hustle and bustle of more crowded areas. | Praia do Bessa, Bessa Shopping, Local restaurants and bars, Parque Arruda Câmara |
| Manaíra | A lively neighborhood known for its shopping and dining options. It's close to the beach and has a mix of entertainment and leisure facilities, making it attractive for both tourists and business travelers. | Manaíra Shopping, Praia de Manaíra, Teatro Paulo Pontes, Cultural Center José Lins do Rego |
| Coqueirinho | A picturesque beach known for its natural beauty. It's a bit more remote and offers a tranquil escape, attracting visitors who want to relax in a more serene environment. | Praia de Coqueirinho, Praia do Amor, Natural Pools |
| Tambauzinho | A residential area that is quickly becoming popular for its proximity to the beach and urban conveniences. It's a great spot for those wanting a mix of urban living and beach life. | Parque da Lagoa, Local cafes and eateries, Close access to Tambaú beach |
| Centro | The historic downtown area is rich in culture and local history. It's ideal for visitors who want to explore the city's heritage, with plenty of museums and local markets to discover. | Centro Cultural São Francisco, Praça João Pessoa, Cultural and Historical Museums, Local markets and handicrafts |
| João Pessoa Historic District | This area is known for its colonial architecture and historical significance. It appeals to tourists interested in culture and history, with many historical attractions nearby. | San Francisco Church, Civic Center, Historical Museums, Local art galleries |
Understanding Airbnb License Requirements & STR Laws in João Pessoa (2026)
While João Pessoa, Paraíba, Brazil currently shows low STR regulations, specific Airbnb license requirements might still exist or change. Always verify the latest short term rental regulations and Airbnb license requirements directly with local government authorities for João Pessoa to ensure full compliance before hosting.
(Source: AirROI data, 2026, based on 1% licensed listings)
Top Performing Airbnb Properties in João Pessoa (2026)
Benchmark your potential! Explore examples of top-performing Airbnb properties in João Pessoabased on Trailing Twelve Month (TTM) revenue. Analyze their characteristics, revenue, occupancy rate, and ADR to understand what drives success in this market.
Flat in Bessa Beach with ocean views
Entire Place • 1 bedroom
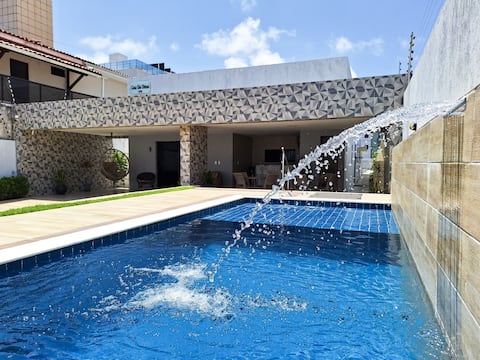
Seaside house, 7 suites, Air, Pool (Bessa/JP)
Entire Place • 7 bedrooms
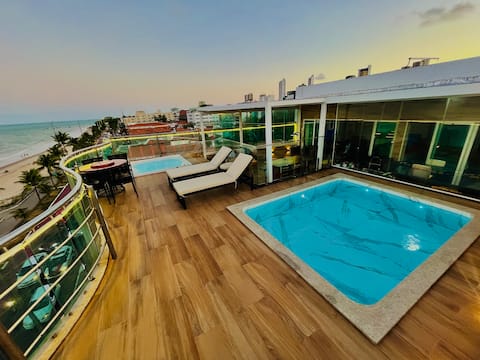
Luxury Penthouse Waterfront Pool and Private Spa
Entire Place • 4 bedrooms
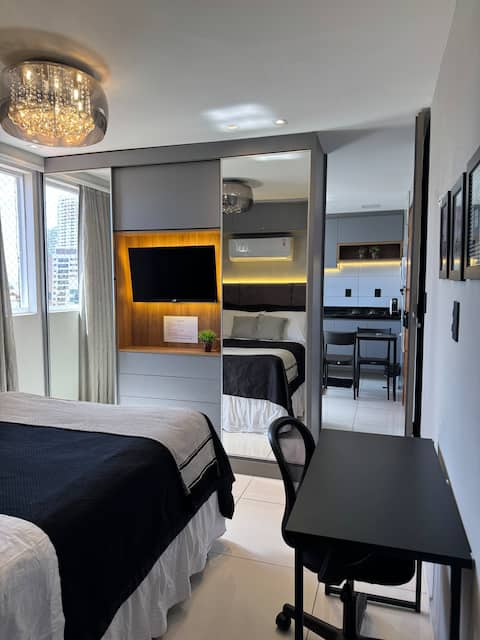
Oceanfront + balcony seaview 1 room at cozy beach
Entire Place • 1 bedroom

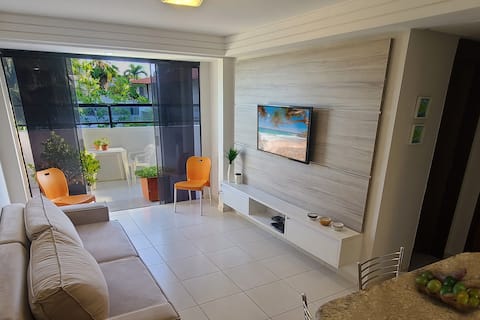
Beautiful High Standard Flat with Balcony
Entire Place • 1 bedroom
Apart with balcony at Cabo Branco
Entire Place • 2 bedrooms
Note: Performance varies based on location, size, amenities, seasonality, and management quality. Data reflects the past 12 months.
Top Performing Airbnb Hosts in João Pessoa (2026)
Learn from the best! This table showcases top-performing Airbnb hosts in João Pessoa based on the number of properties managed and estimated total revenue over the past year. Analyze their scale and performance metrics.
| Host Name | Properties | Grossing Revenue | Stay Reviews | Avg Rating |
|---|---|---|---|---|
| Miramar | 289 | $1,898,827 | 4069 | 4.35/5.0 |
| Carpediem Homes | 196 | $1,294,273 | 1192 | 4.54/5.0 |
| Julio | 132 | $1,241,065 | 9252 | 4.80/5.0 |
| Hosppedar | 74 | $732,792 | 1962 | 4.65/5.0 |
| Jess Hospedagens | 61 | $694,714 | 1805 | 4.67/5.0 |
| LikeHome Hospedagens | 135 | $613,739 | 1131 | 4.60/5.0 |
| Jess Hospedagens | 64 | $518,464 | 1138 | 4.70/5.0 |
| Joaquim Vasconcelos | 63 | $511,010 | 2490 | 4.56/5.0 |
| Genius Flats | 35 | $425,228 | 651 | 4.69/5.0 |
| Pedro Pereira | 39 | $388,938 | 985 | 4.62/5.0 |
Analyzing the strategies of top hosts, such as their property selection, pricing, and guest communication, can offer valuable lessons for optimizing your own Airbnb operations in João Pessoa.
Dive Deeper: Advanced João Pessoa STR Market Data (2026)
Ready to unlock more insights? AirROI provides access to advanced metrics and comprehensive Airbnb data for João Pessoa. Explore detailed analytics beyond this report to refine your investment strategy, optimize pricing, and maximize your vacation rental profits.
Explore Advanced MetricsJoão Pessoa Short-Term Rental Market Composition (2026): Property & Room Types
Room Type Distribution
Property Type Distribution
Market Composition Insights for João Pessoa
- The João Pessoa Airbnb market composition is heavily skewed towards Entire Home/Apt listings, which make up 93% of the 4,825 active rentals. This indicates strong guest preference for privacy and space.
- Looking at the property type distribution in João Pessoa, Apartment/Condo properties are the most common (95.7%), reflecting the local real estate landscape.
- Smaller segments like house, hotel/boutique, others (combined 4.2%) offer potential for unique stay experiences.
João Pessoa Airbnb Room Capacity Analysis (2026): Bedroom Distribution
Distribution of Listings by Number of Bedrooms
Room Capacity Insights for João Pessoa
- The dominant room capacity in João Pessoa is 1 bedroom listings, making up 59.4% of the market. This suggests a strong demand for properties suitable for couples or solo travelers.
- Together, 1 bedroom and 2 bedrooms properties represent 88.2% of the active Airbnb listings in João Pessoa, indicating a high concentration in these sizes.
- With over half the market (59.4%) consisting of studios or 1-bedroom units, João Pessoa is particularly well-suited for individuals or couples.
- Listings with 3+ bedrooms (5.4%) represent a smaller niche, potentially indicating an underserved market for larger group accommodations in João Pessoa.
João Pessoa Vacation Rental Guest Capacity Trends (2026)
Distribution of Listings by Guest Capacity
Guest Capacity Insights for João Pessoa
- The most common guest capacity trend in João Pessoa vacation rentals is listings accommodating 4 guests (32.9%). This suggests the primary traveler segment is likely small families or groups.
- Properties designed for 4 guests and 3 guests dominate the João Pessoa STR market, accounting for 51.4% of listings.
- 14.2% of properties accommodate 6+ guests, serving the market segment for larger families or group travel in João Pessoa.
- On average, properties in João Pessoa are equipped to host 3.7 guests.
João Pessoa Airbnb Booking Patterns (2026): Available vs. Booked Days
Available Days Distribution
Booked Days Distribution
Booking Pattern Insights for João Pessoa
- The most common availability pattern in João Pessoa falls within the 271-366 days range, representing 53.1% of listings. This suggests many properties have significant open periods on their calendars.
- Approximately 79.7% of listings show high availability (181+ days open annually), indicating potential for increased bookings or specific owner usage patterns.
- For booked days, the 31-90 days range is most frequent in João Pessoa (33.6%), reflecting common guest stay durations or potential owner blocking patterns.
- A notable 21.2% of properties secure long booking periods (181+ days booked per year), highlighting successful long-term rental strategies or significant owner usage.
João Pessoa Airbnb Minimum Stay Requirements Analysis
Distribution of Listings by Minimum Night Requirement
1 Night
1011 listings
21% of total
2 Nights
1548 listings
32.1% of total
3 Nights
223 listings
4.6% of total
4-6 Nights
126 listings
2.6% of total
7-29 Nights
43 listings
0.9% of total
30+ Nights
1874 listings
38.8% of total
Key Insights
- The most prevalent minimum stay requirement in João Pessoa is 30+ Nights, adopted by 38.8% of listings. This highlights the market's preference for longer commitments.
- A significant segment (38.8%) caters to monthly stays (30+ nights) in João Pessoa, pointing to opportunities in the extended-stay market.
Recommendations
- Align with the market by considering a 30+ Nights minimum stay, as 38.8% of João Pessoa hosts use this setting.
- If feasible, allowing 1-night stays, especially midweek or during low season, could capture last-minute bookings, as only 21% currently do.
- Explore offering discounts for stays of 30+ nights to attract the 38.8% of the market seeking extended stays.
- Adjust minimum nights based on seasonality – potentially shorter during low season and longer during peak demand periods in João Pessoa.
João Pessoa Airbnb Cancellation Policy Trends Analysis (2026)
Limited
62 listings
1.3% of total
Super Strict 30 Days
198 listings
4.1% of total
Super Strict 60 Days
7 listings
0.1% of total
Flexible
1212 listings
25.2% of total
Moderate
1569 listings
32.6% of total
Firm
1213 listings
25.2% of total
Strict
553 listings
11.5% of total
Cancellation Policy Insights for João Pessoa
- The prevailing Airbnb cancellation policy trend in João Pessoa is Moderate, used by 32.6% of listings.
- There's a relatively balanced mix between guest-friendly (57.8%) and stricter (36.7%) policies, offering choices for different guest needs.
Recommendations for Hosts
- Consider adopting a Moderate policy to align with the 32.6% market standard in João Pessoa.
- Using a Strict policy might deter some guests, as only 11.5% of listings use it. Evaluate if potential revenue protection outweighs possible lower booking rates.
- Regularly review your cancellation policy against competitors and market demand shifts in João Pessoa.
João Pessoa STR Booking Lead Time Analysis (2026)
Average Booking Lead Time by Month
Booking Lead Time Insights for João Pessoa
- The overall average booking lead time for vacation rentals in João Pessoa is 35 days.
- Guests book furthest in advance for stays during December (average 50 days), likely coinciding with peak travel demand or local events.
- The shortest booking windows occur for stays in May (average 21 days), indicating more last-minute travel plans during this time.
- Seasonally, Winter (42 days avg.) sees the longest lead times, while Summer (28 days avg.) has the shortest, reflecting typical travel planning cycles.
Recommendations for Hosts
- Use the overall average lead time (35 days) as a baseline for your pricing and availability strategy in João Pessoa.
- For December stays, consider implementing length-of-stay discounts or slightly higher rates for bookings made less than 50 days out to capitalize on advance planning.
- Target marketing efforts for the Winter season well in advance (at least 42 days) to capture early planners.
- Monitor your own booking lead times against these João Pessoa averages to identify opportunities for dynamic pricing adjustments.
Popular & Essential Airbnb Amenities in João Pessoa (2026)
Amenity Prevalence
Amenity Insights for João Pessoa
- Essential amenities in João Pessoa that guests expect include: TV, Air conditioning, Wifi. Lacking these (any) could significantly impact bookings.
- Popular amenities like Kitchen, Free parking on premises, Pool are common but not universal. Offering these can provide a competitive edge.
- A pool is a highly desired but not standard amenity, making it a key feature for attracting guests seeking leisure in João Pessoa.
Recommendations for Hosts
- Ensure your listing includes all essential amenities for João Pessoa: TV, Air conditioning, Wifi.
- Prioritize adding missing essentials: TV, Air conditioning, Wifi.
- Consider adding popular differentiators like Kitchen or Free parking on premises to increase appeal.
- Highlight unique or less common amenities you offer (e.g., hot tub, dedicated workspace, EV charger) in your listing description and photos.
- Regularly check competitor amenities in João Pessoa to stay competitive.
João Pessoa Airbnb Guest Demographics & Profile Analysis (2026)
Guest Profile Summary for João Pessoa
- The typical guest profile for Airbnb in João Pessoa consists of primarily domestic travelers (95%), often arriving from nearby São Paulo, typically belonging to the Post-2000s (Gen Z/Alpha) group (50%), primarily speaking Portuguese or English.
- Domestic travelers account for 94.7% of guests.
- Key international markets include Brazil (94.7%) and United States (1.3%).
- Top languages spoken are Portuguese (50.9%) followed by English (26.8%).
- A significant demographic segment is the Post-2000s (Gen Z/Alpha) group, representing 50% of guests.
Recommendations for Hosts
- Target domestic marketing efforts towards travelers from São Paulo and Pernambuco.
- Tailor amenities and listing descriptions to appeal to the dominant Post-2000s (Gen Z/Alpha) demographic (e.g., highlight fast WiFi, smart home features, local guides).
- Highlight unique local experiences or amenities relevant to the primary guest profile.
- Consider seasonal promotions aligned with peak travel times for key origin markets.
Nearby Short-Term Rental Market Comparison
How does the João Pessoa Airbnb market stack up against its neighbors? Compare key performance metrics like average monthly revenue, ADR, and occupancy rates in surrounding areas to understand the broader regional STR landscape.
| Market | Active Properties | Monthly Revenue | Daily Rate | Avg. Occupancy |
|---|---|---|---|---|
| Sirinhaém | 44 | $1,343 | $225.63 | 25% |
| Ipojuca | 4,298 | $847 | $118.24 | 35% |
| Tamandaré | 1,255 | $830 | $141.81 | 28% |
| Maragogi | 768 | $792 | $120.80 | 29% |
| Bananeiras | 228 | $720 | $130.54 | 24% |
| Tibau do Sul | 1,407 | $717 | $90.98 | 33% |
| Camaragibe | 28 | $680 | $118.56 | 27% |
| Cabo de Santo Agostinho | 126 | $623 | $122.43 | 26% |
| São José da Coroa Grande | 186 | $609 | $85.73 | 32% |
| Areia | 25 | $576 | $80.31 | 27% |