
Shoulder Season
Key Takeaways
- Shoulder season sits between peak and off-season, generating mid-range RevPAR that few hosts actively optimize
- AirROI data for Nashville-Davidson shows shoulder RevPAR ranging from $135 (February) to $198 (October peak) across a 12-month cycle
- Dynamic pricing delivers the highest marginal return during shoulder months, when demand is most volatile day-to-day
- Weekend nights during shoulder season often command near-peak rates while weekdays lag — differentiated pricing is essential
- Lowering minimum-stay requirements to 2 nights during shoulder weeks reduces orphan days and is the single highest-ROI tactic in moderate-demand periods
Shoulder Season by Market Type
| Market Type | Spring Shoulder | Fall Shoulder | Peak Anchor |
|---|---|---|---|
| Beach/coastal | April–May | September–October | June–August |
| Ski/mountain | October–November | April | December–March |
| Urban/metro | March–April | October–November | May + event weeks |
| Tropical | May, November | May, November | December–April |
| Lake/rural | May | September–October | July–August |
The RevPAR Seasonal Cycle: Nashville-Davidson
AirROI's trailing-12-month data across approximately 7,000 active listings in Nashville-Davidson makes the shoulder pattern concrete. Two clear peak spikes — May at $182.8 and October at $198.0 — bookend distinct shoulder zones in spring (February–April) and fall (September–November), with a pronounced off-season trough in January at $103.5.
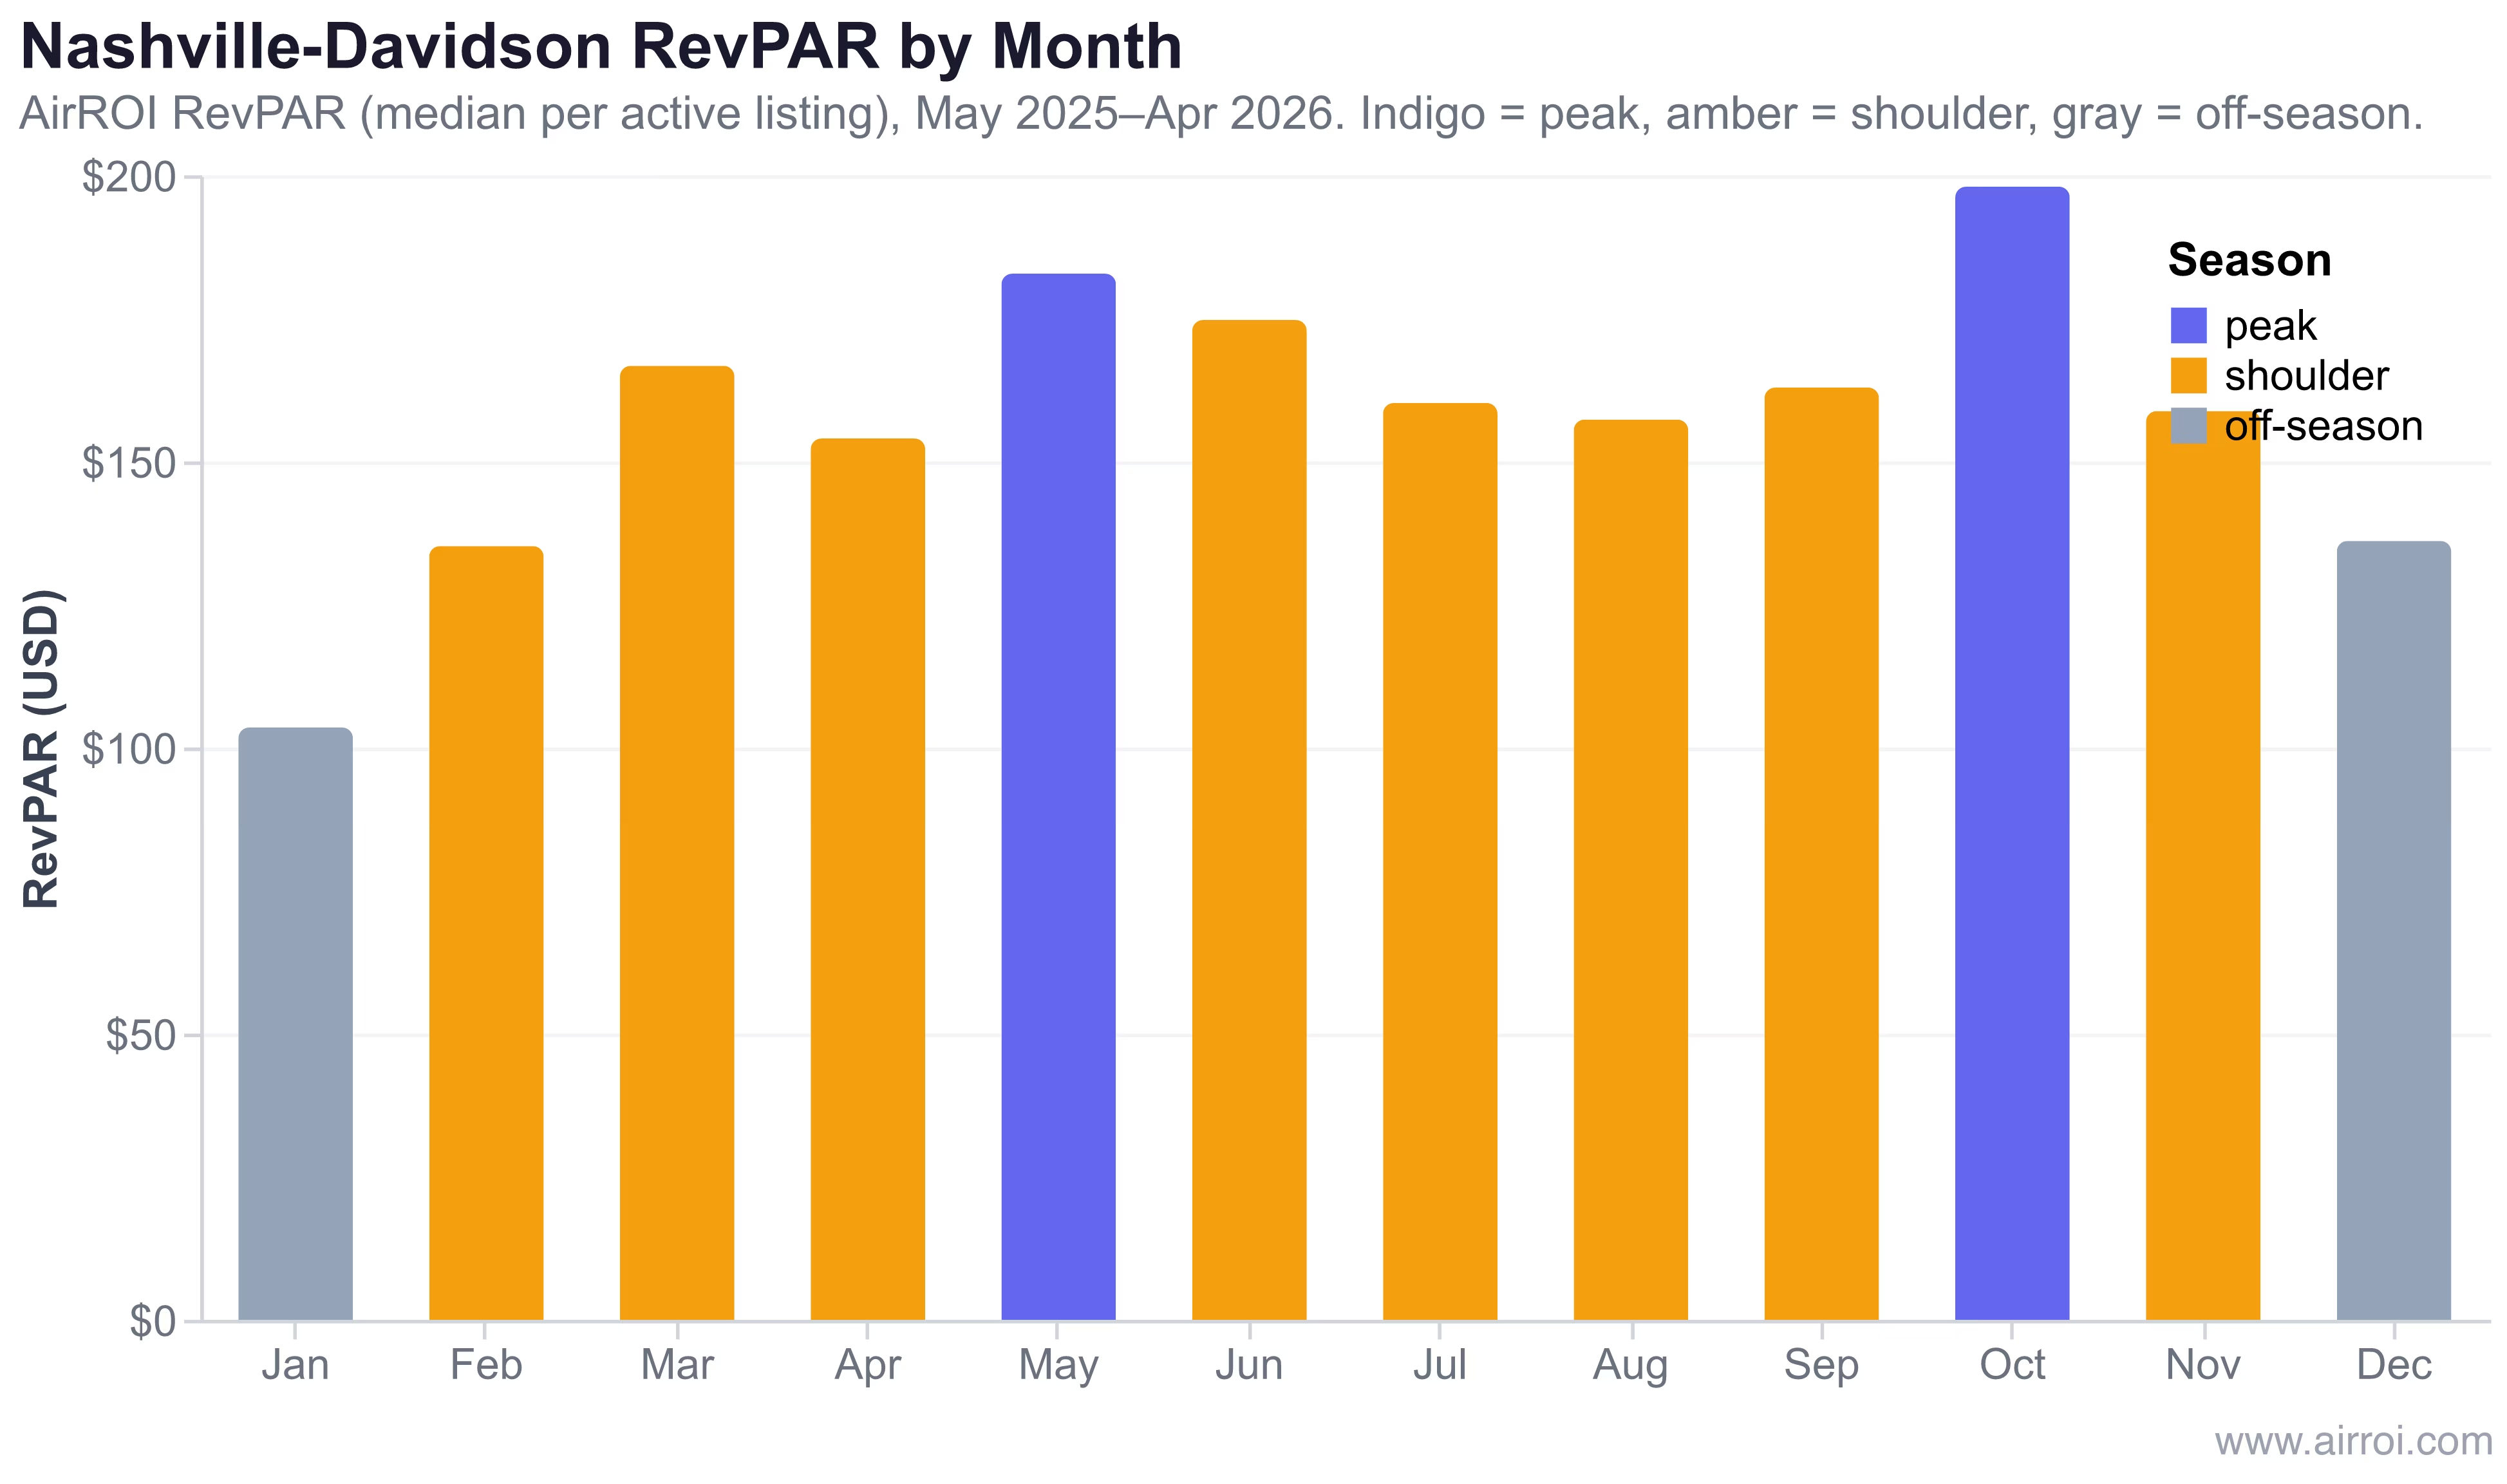
In AirROI's analysis of approximately 7,000 active listings in Nashville-Davidson over the trailing 12 months, shoulder months averaged $158–$167 in RevPAR — roughly 20% below the October peak of $198 but more than 50% above the January trough of $103. October outperforms May because Nashville's fall festival and CMA Awards calendar creates a demand spike that rivals summer in beach markets. Hosts who treat all shoulder months identically leave revenue on the table.
The shoulder season is not a single band — it is a set of individual weeks with wildly different demand profiles. The host who prices October 1 the same as November 15 is writing off thousands of dollars.
Rate Positioning Through the Seasonal Cycle
| Period | RevPAR vs. Peak | Typical Occupancy | Pricing Priority |
|---|---|---|---|
| Peak season | 100% (baseline) | 75–90% | Maximize ADR, enforce minimums |
| Shoulder (weekends) | 75–90% | 65–78% | Hold near-peak, flex minimums |
| Shoulder (weekdays) | 50–65% | 35–52% | Discount aggressively, 2-night min |
| Off-season | 40–60% | 30–45% | Prioritize occupancy over ADR |
Why Shoulder Season Is the Hardest to Price
Strategies for Shoulder Season Revenue
1. Differentiate weekday and weekend rates. Weekends during shoulder season often behave like compressed peak periods. Set weekend rates at 80–90% of your peak baseline. Weekdays in the same weeks may warrant 55–65% of peak — a 25-point spread within a single week is normal and appropriate.
3. Update listing content for the season. Guests booking shoulder weeks are often motivated by the season itself — fall foliage, spring wildflowers, mild hiking weather. Listings with photos and descriptions that directly reference shoulder-season appeal convert at higher rates than year-round generic content.
4. Use lead-time data to set pricing windows. AirROI's Nashville-Davidson data shows average booking lead time of 68 days in May and October (peak), dropping to 35–41 days in January–February (off-season). Shoulder months cluster at 48–60 days. Set rate locks that allow dynamic adjustment in the final 3 weeks before arrival — shoulder demand frequently arrives late and at premium rates if inventory is scarce.
Frequently Asked Questions
Shoulder season is the transition period between peak season and off-season, characterized by moderate demand, mid-range ADR, and variable occupancy. AirROI data for Nashville-Davidson shows shoulder-month RevPAR averaging $158–$167 — about 20% below the October peak of $198 but 35–45% above the January trough of $103.
Price 15–30% below your peak-season rate but well above off-season levels. Use dynamic pricing to capture weekend demand at near-peak rates while discounting weekdays. Lowering minimum-night requirements to 2 nights during shoulder weeks fills gaps that longer stays cannot, recovering revenue from orphan days.
Shoulder season typically lasts 4–8 weeks on each side of peak season, though urban markets with event-driven demand cycles can have shorter, sharper transitions. In Nashville-Davidson, AirROI data shows a clear spring shoulder running February through April and a fall shoulder from September through November.
Yes. Guests benefit from lower nightly rates (typically 15–30% below peak), reduced competition for desirable listings, and more host flexibility on minimum stays and check-in dates. Shoulder season is the optimal booking window for travelers who prioritize value without the full sacrifice of off-season availability.
Event-driven urban markets like Nashville and New Orleans have sharp, well-defined shoulder transitions tied to festival and conference calendars. Beach markets like San Diego show a longer summer peak with a brief fall shoulder. Mountain markets like Gatlinburg have two clear shoulder windows — spring snowmelt and late-autumn pre-ski.