Super Bowl 2026 Airbnb Data: Bay Area STR Demand, Pricing, and What Hosts Need to Know
A Sunnyvale host just set their four-bedroom home at $1,645 per night for Super Bowl Thursday -- and their Friday through Sunday is already booked. That single listing, which we will examine in detail below, encapsulates the opportunity and complexity facing every Super Bowl 2026 Airbnb host in the Bay Area right now. Super Bowl LX arrives at Levi's Stadium in Santa Clara on February 8, 2026, and the Super Bowl 2026 short-term rental market is already rewriting the rules of local pricing, pacing, and inventory.
We know this because we measured it. AirROI analyzed 17,835 active Bay Area listings across six cities to build the most comprehensive picture of how this event is reshaping the regional STR market. What follows is not speculation. It is data -- booking pacing, rate premiums, fill rates, and historical comparisons drawn from our proprietary Athena engine and validated against leading industry sources.
Whether you are a first-time host wondering if it is too late to list, an experienced operator fine-tuning your dynamic pricing strategy, or an investor evaluating the Bay Area's event-driven rental potential, this analysis gives you the numbers you need.
Eight Super Bowls of Data: What History Tells Hosts
Before diving into Bay Area-specific data, it is worth understanding what eight years of Super Bowl STR performance actually look like. Not every host city experiences the same windfall. Market size, existing STR supply, regulatory environment, and local infrastructure all shape the outcome.
| Year | Super Bowl | Host City | STR Demand YoY | ADR Change | Supply Change | Key Takeaway |
|---|---|---|---|---|---|---|
| 2018 | LII | Minneapolis | +587% | +376.8% | +420.2% | Small market = massive spikes |
| 2019 | LIII | Atlanta | +263% | +207.4% | +162.8% | Large city, strong growth |
| 2020 | LIV | Miami | +~50% | +74.3% | +28.7% | High baseline dampens impact |
| 2021 | LV | Tampa | +35% | +111% | +14.7% | COVID-era lowest since 2014 |
| 2022 | LVI | Los Angeles | Modest | ~46% | -- | Large market, mainly ADR effect |
| 2023 | LVII | Phoenix | Strong | +42.6% | +62% listings | "Airbnbust" oversupply |
| 2024 | LVIII | Las Vegas | +87% | +51%; $526 ADR | +15% | Revenue +180% YoY |
| 2025 | LIX | New Orleans | ~16K nights sold | $670-690 ADR | Regulated | $11.1M total STR revenue |
Source: AirDNA, CAIA, PriceLabs, AirROI analysis
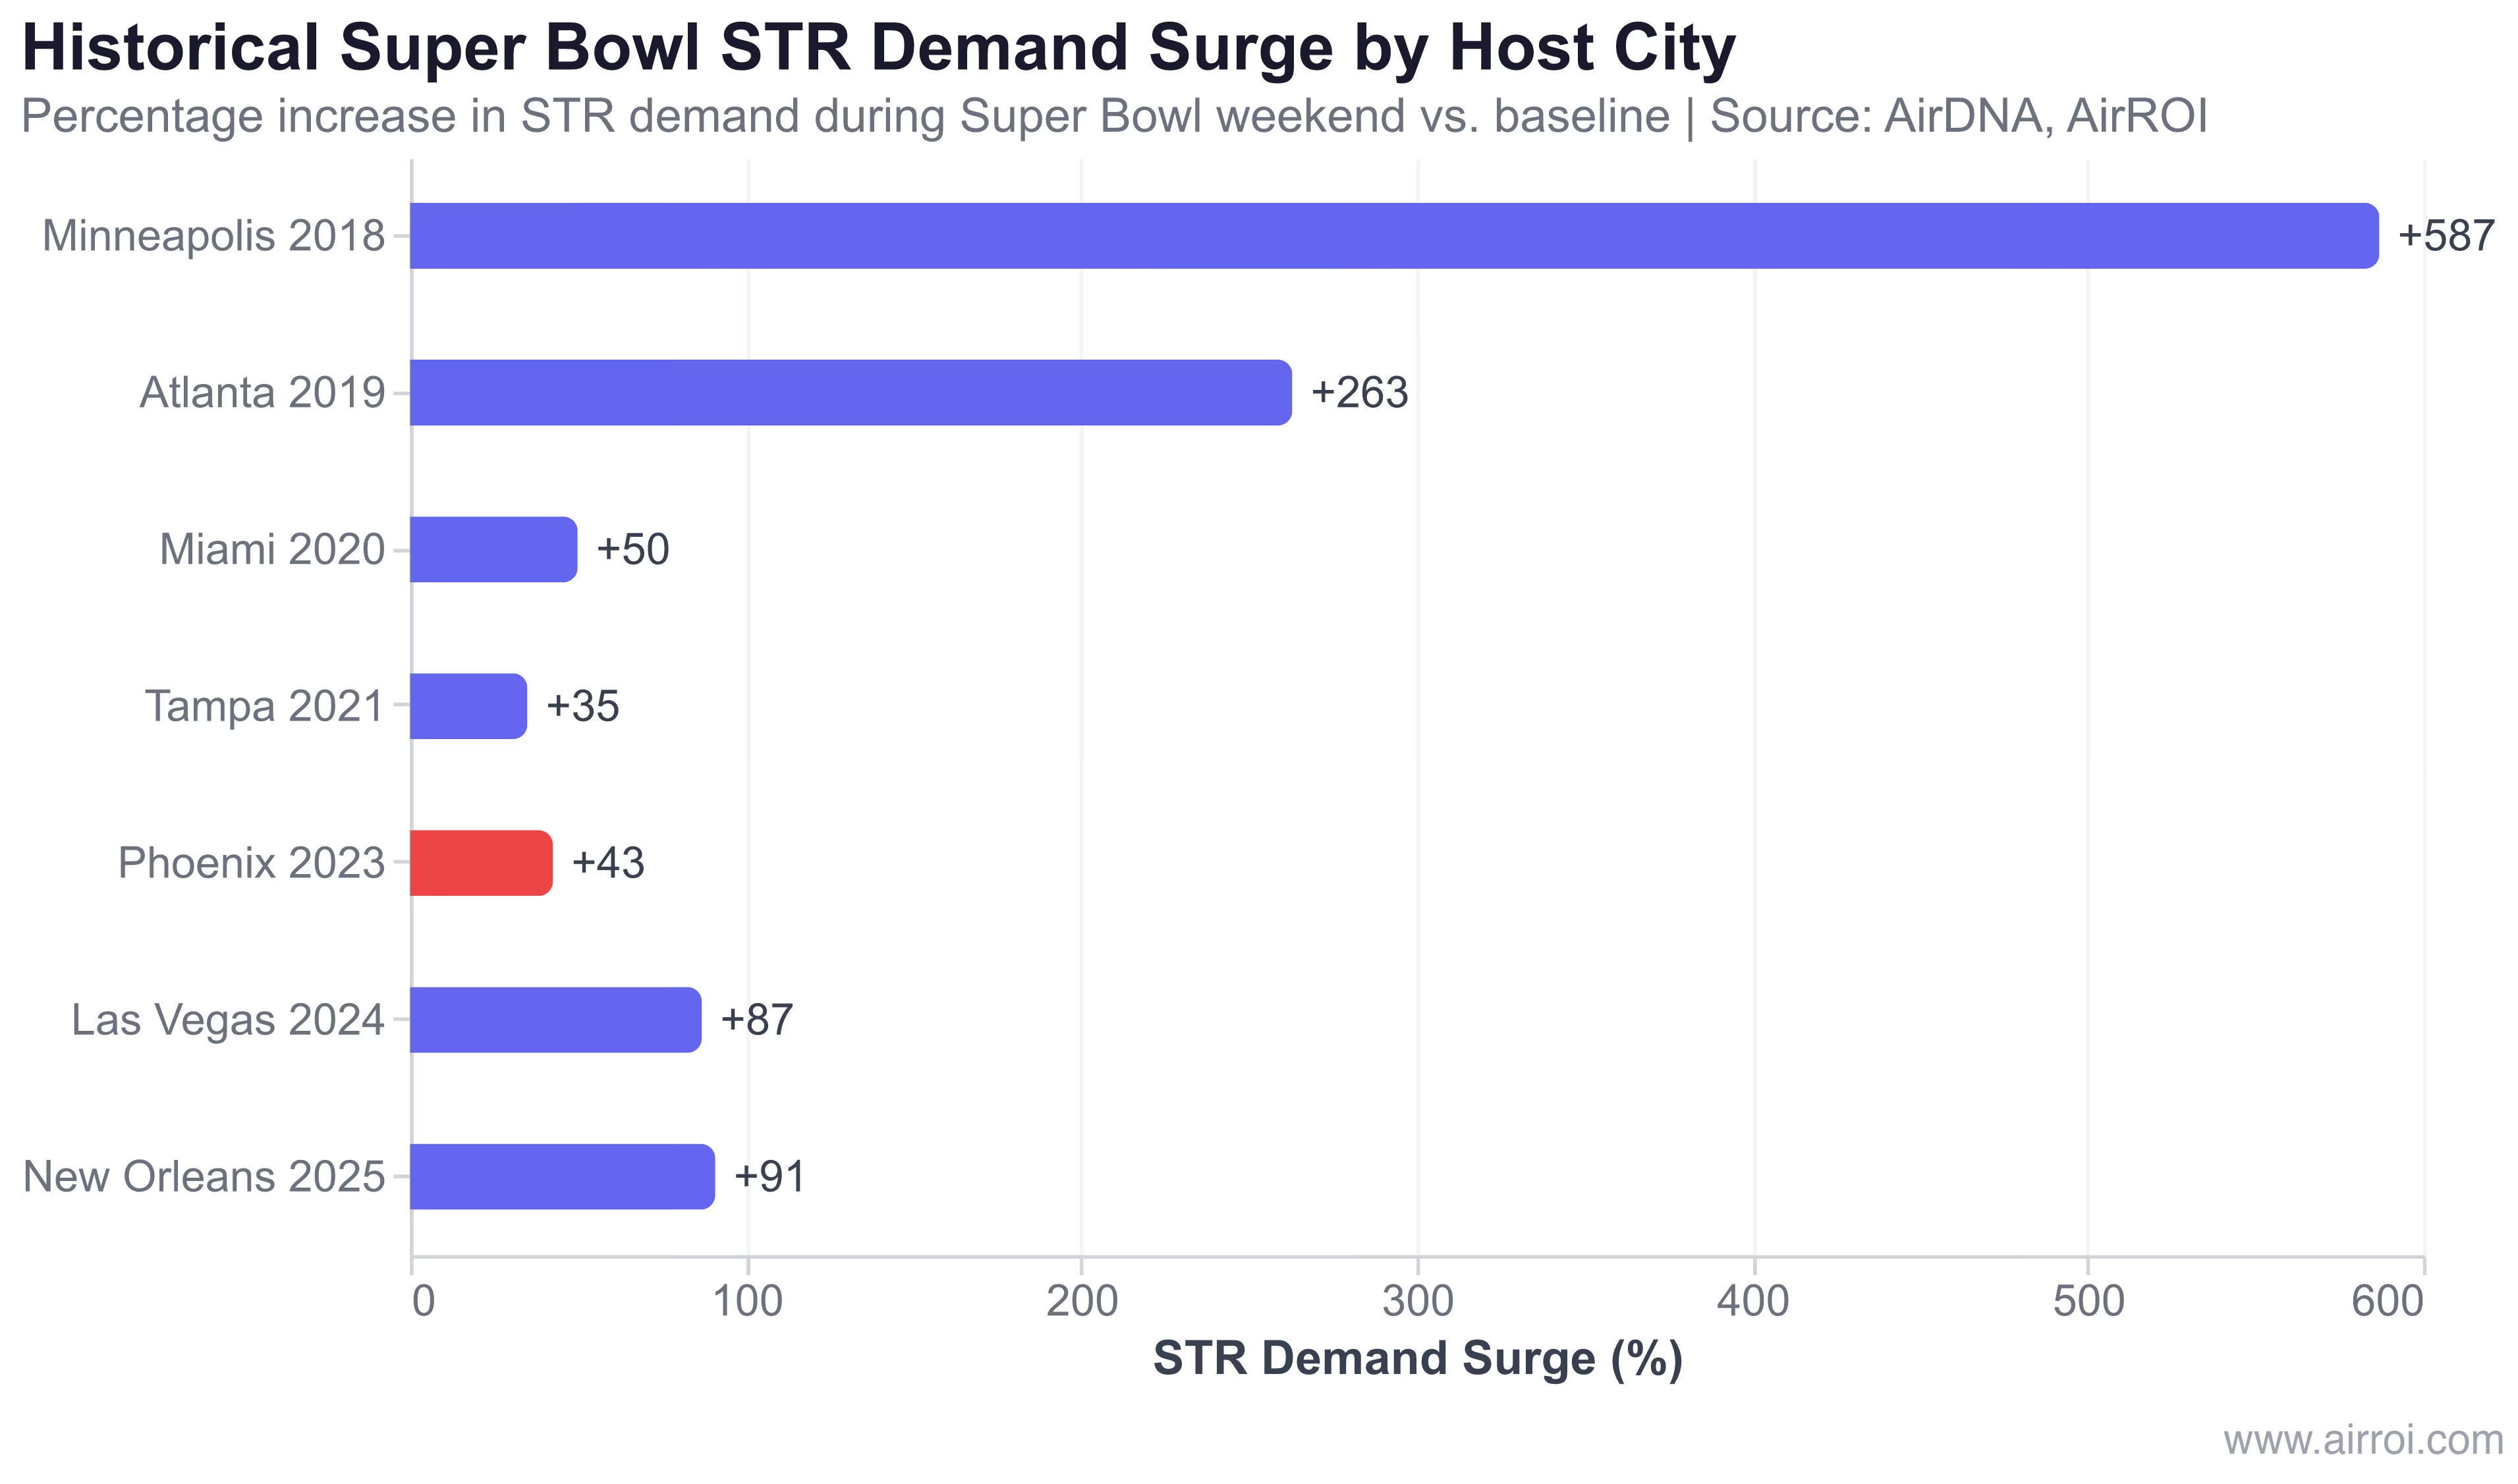
The Pattern: Market Size Determines the Spike
The data reveals a clear inverse relationship between market size and demand surge magnitude. Minneapolis in 2018, with its relatively small STR footprint, saw demand explode by 587%. Atlanta in 2019 -- a larger market with established tourism infrastructure -- registered a 263% increase. By the time you reach Miami in 2020, with its large existing tourism base and high STR baseline, the bump was only about 50%.
The implication for the Bay Area -- a large, mature market with 17,835 active listings -- is that hosts should expect meaningful but not astronomical demand surges. The Super Bowl will not transform the entire market overnight, but it will create concentrated pricing power for well-positioned listings.
The Phoenix Cautionary Tale
Phoenix in 2023 stands as the most instructive cautionary case. Listings surged from roughly 5,000 to 21,000 as hosts flooded the market in anticipation of Super Bowl LVII, driving STR occupancy down to just 52%. The "Airbnbust" label stuck. ADR still rose 42.6%, but the supply flood meant that many hosts ended up with empty calendars despite the biggest sporting event in the country happening in their backyard. The lesson is clear: when supply grows faster than demand, even a Super Bowl cannot save pricing.
The New Orleans Success Model
Contrast that with New Orleans in 2025, where regulated supply, a compact urban core, and approximately 6,000 listings produced $11.1 million in total STR revenue. ADR reached $670-690, and STR occupancy hit 91% -- roughly 16,000 nights sold across the event window. Regulation acted as a natural supply constraint, concentrating demand among existing hosts and driving rates higher. The Bay Area's regulatory landscape looks much more like New Orleans than Phoenix.
Bay Area Market Snapshot: 17,835 Listings, One Stadium
To understand the Super Bowl's impact, you first need a clear picture of the market it is landing in. The Bay Area Airbnb demand landscape spans six primary cities, each with distinct supply characteristics, pricing norms, and regulatory frameworks.
| City | Total Listings | Entire Homes (TTM) | Avg ADR | Avg Occupancy | Avg Annual Revenue |
|---|---|---|---|---|---|
| San Francisco | 9,278 | 3,958 | $294.56 | 30.2% | $34,191 |
| San Jose | 4,829 | 1,564 | $242.79 | 31.2% | $27,653 |
| Palo Alto | 998 | 465 | $307.19 | 29.8% | $31,989 |
| Santa Clara | 992 | 286 | $263.77 | 29.5% | $30,850 |
| Sunnyvale | 877 | 210 | $202.87 | 31.6% | $24,440 |
| Mountain View | 861 | 327 | $242.44 | 26.0% | $24,256 |
| Total | 17,835 | 6,810 | -- | -- | -- |
Source: AirROI Athena engine, prod_2025_12_31 dataset
The Supply Constraint That Changes Everything
The single most important number in this table is 992 -- Santa Clara's total listing count. The city that hosts Levi's Stadium has fewer STR listings than Palo Alto. Of those 992, only 286 are entire homes available on a trailing-twelve-month basis. This is a profound supply constraint that fundamentally shapes how the Super Bowl plays out in this market.
For comparison, New Orleans had roughly 6,000 listings for Super Bowl LIX. Las Vegas had thousands more. Santa Clara's inventory is barely a sixth of what recent Super Bowl host cities have offered, which means demand gets concentrated, booking pacing accelerates faster, and rate premiums persist longer than they would in a deeper market.
The Regulation Divide
Revenue Distribution: The Skew Tells the Story
In Santa Clara, the median annual STR revenue is $7,266 while the average is $18,296. That gap reveals a heavily right-skewed distribution where a small number of well-optimized, entire-home listings earn multiples of the typical listing. The 90th percentile (P90) sits at $57,642 per year. In San Francisco, P90 revenue reaches $71,564. The hosts who capture Super Bowl revenue premiums are overwhelmingly in this upper tier -- entire homes, professionally managed, with dynamic pricing strategies already in place.
The Proximity Premium: Distance from Levi's Changes Everything
Our analysis of February 2026 forward rates versus March 2026 baselines reveals a clear proximity premium -- the closer a listing is to Levi's Stadium, the larger its Super Bowl rate increase. This is the most actionable data point for hosts setting their Super Bowl 2026 Bay Area rental prices.
| City | Feb Avg Rate | Mar Baseline | Premium ($) | Premium (%) | Distance to Stadium |
|---|---|---|---|---|---|
| Santa Clara | $264.40 | $192.68 | +$71.72 | +37.2% | <5 miles |
| San Jose | $237.09 | $180.32 | +$56.77 | +31.5% | ~10 miles |
| Sunnyvale | $202.59 | $155.55 | +$47.04 | +30.2% | ~8 miles |
| Mountain View | $231.17 | $194.52 | +$36.65 | +18.8% | ~12 miles |
| Palo Alto | $307.62 | $272.00 | +$35.62 | +13.1% | ~15 miles |
| San Francisco | $272.81 | $258.36 | +$14.45 | +5.6% | ~45 miles |
Source: AirROI API future-rates data, January 2026
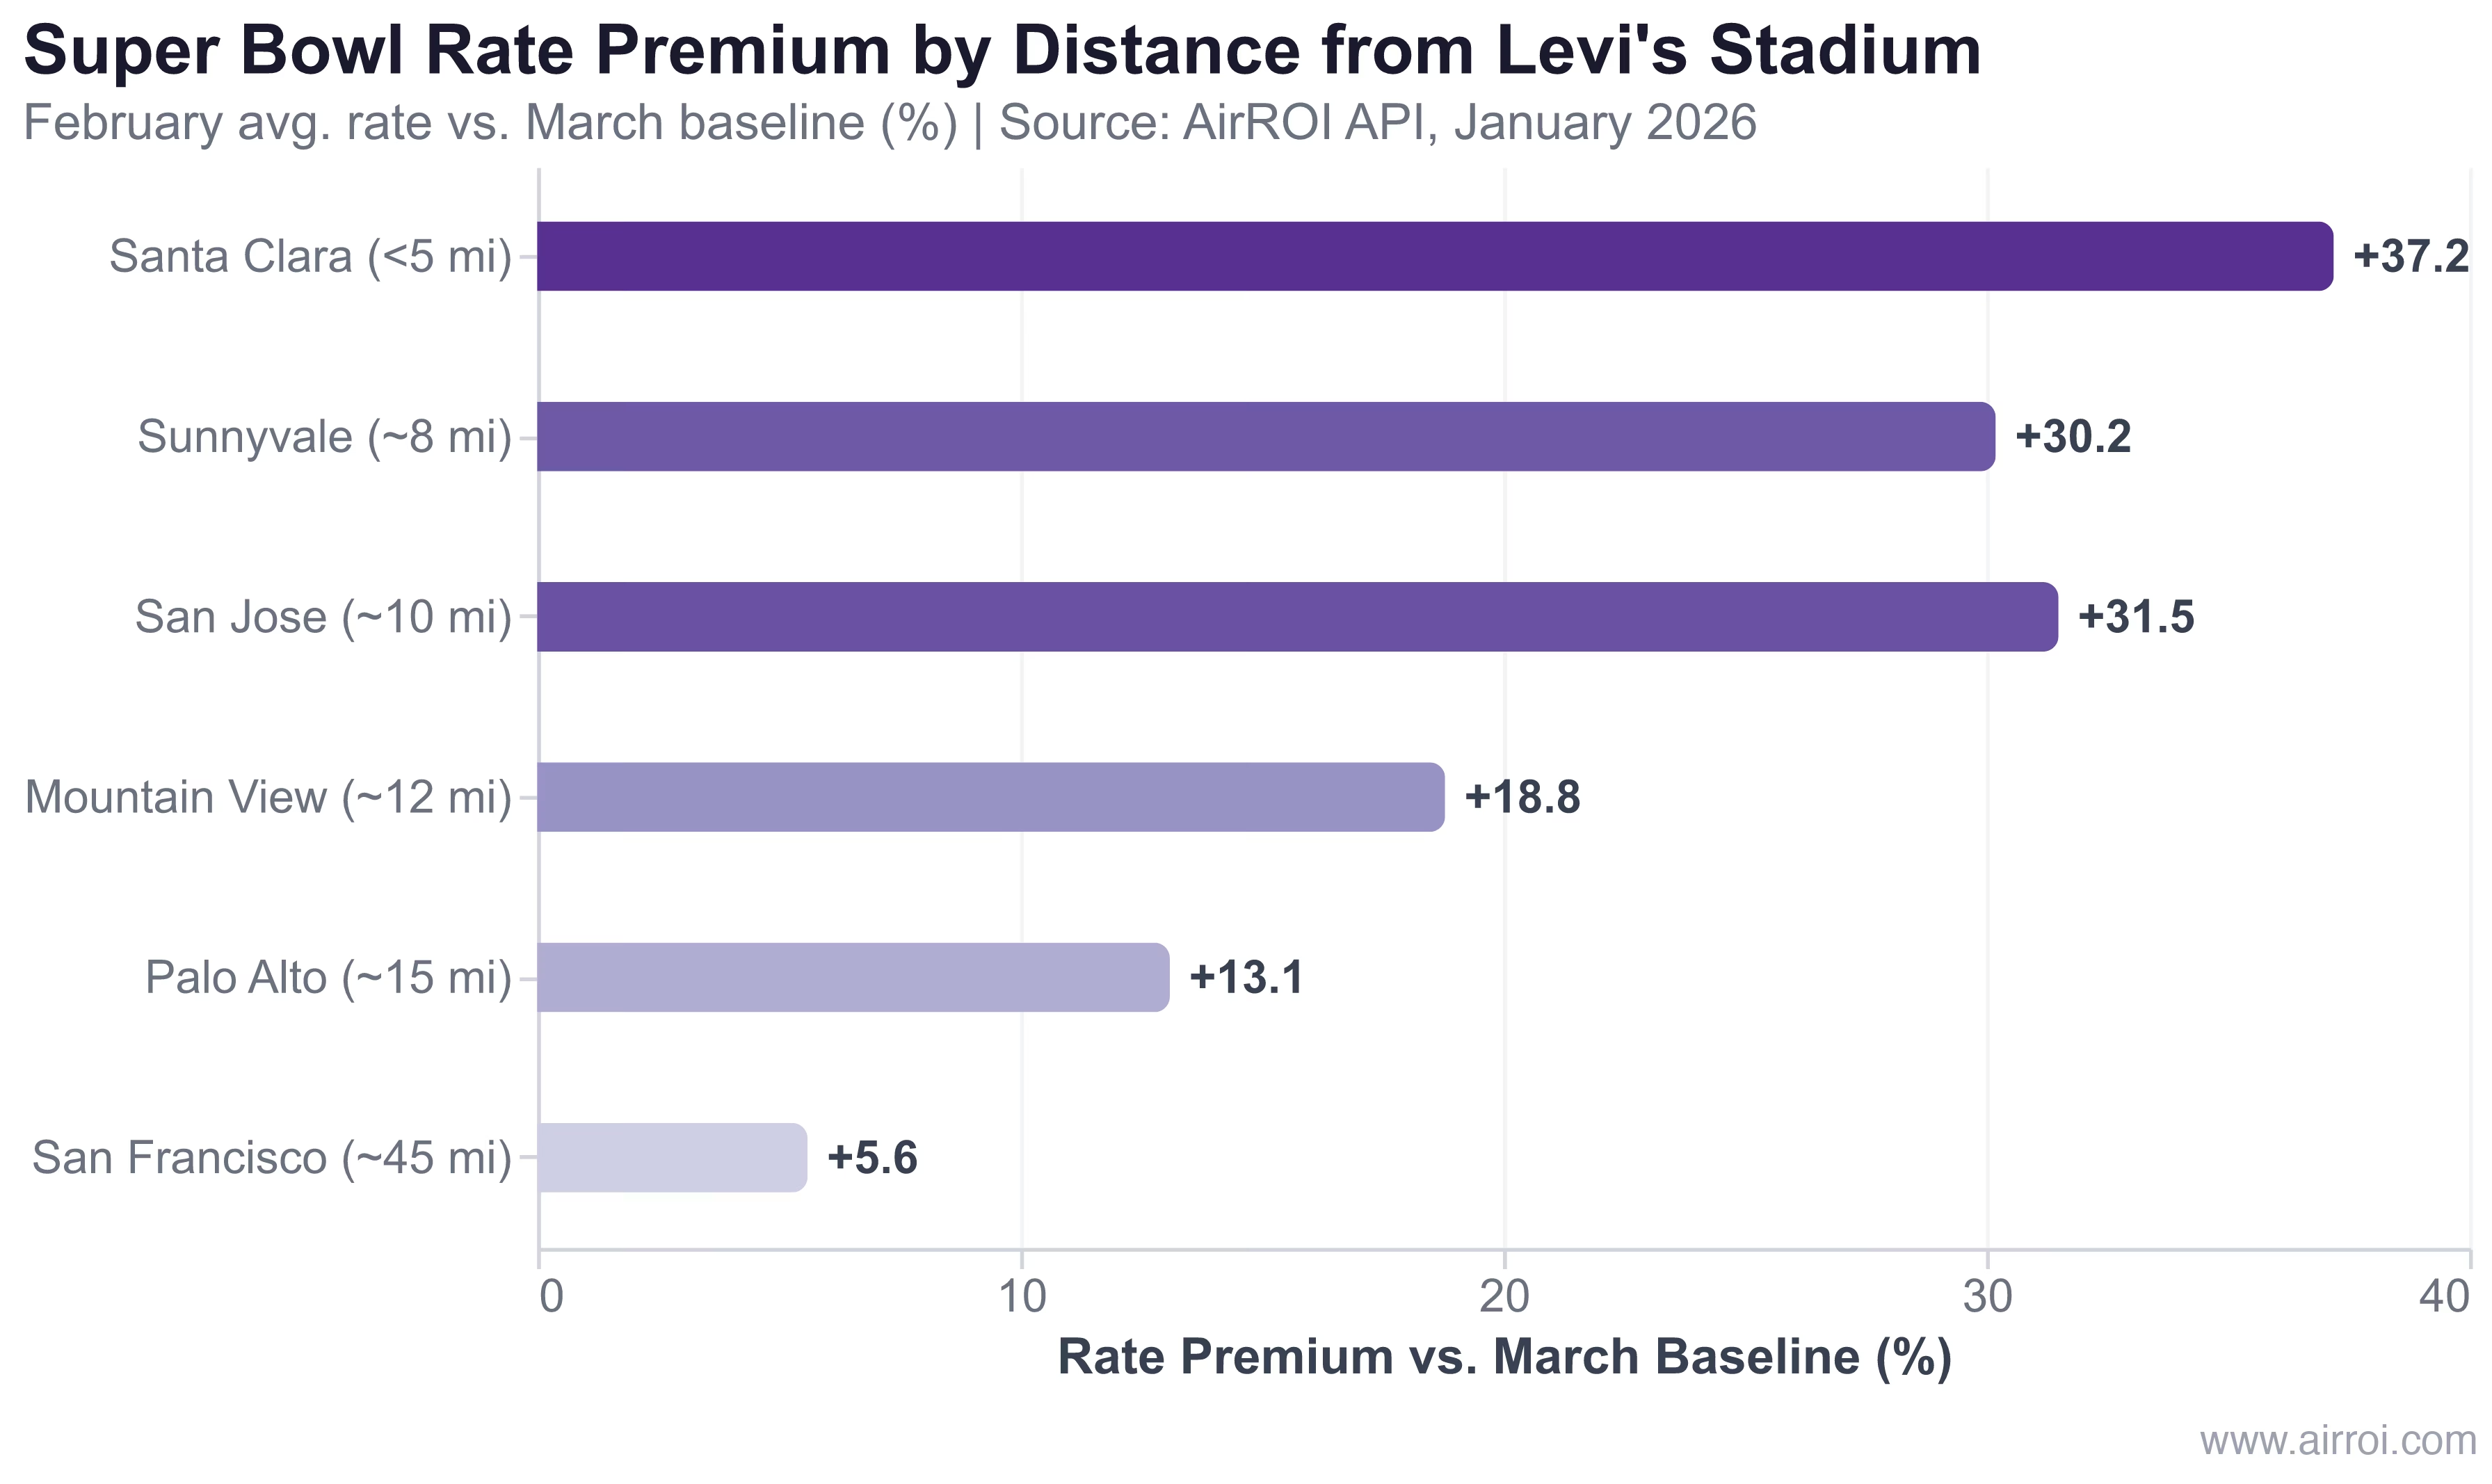
The Gradient Is Clear
Santa Clara vacation rental listings command a 37.2% premium over their March baseline -- the highest in the Bay Area. The premium declines with distance, dropping to 30.2% in Sunnyvale (8 miles), 18.8% in Mountain View (12 miles), and just 5.6% in San Francisco (45 miles). This gradient matches patterns observed in previous Super Bowls, where the five-mile radius around the stadium captures the lion's share of event-driven rental demand.
What makes this particularly notable is the seasonal context. February is historically Santa Clara's lowest ADR month, averaging just $176 per night outside of event periods. The Super Bowl is transforming what would otherwise be the market's annual trough into its pricing peak -- a reversal that underscores the sheer magnitude of event-driven demand.
What Top Listings Are Doing
The aggregate data tells part of the story. Individual listings reveal the rest.
"Marbella Lane" -- Sunnyvale, 4BR entire home. This listing generated $144,945 in trailing-twelve-month revenue at an average nightly rate of $595 and 66% occupancy -- already placing it well above the market's P90 threshold. For Super Bowl week, the host has set February 5 (Thursday) at $1,645 per night -- a 155% premium over their baseline of approximately $644. Friday through Sunday? Already booked. This host understood booking pacing and priced the remaining inventory aggressively.
"MeiCasa | 5min Levi" -- Santa Clara, 3BR entire home. Positioned just five minutes from Levi's Stadium, this listing has February 6 set at $1,521 per night -- a 128% premium over its roughly $666 baseline. February 4-5 are already booked, suggesting corporate travel demand is locking in Thursday arrivals well ahead of the general fan base.
These are not outliers. Our data identifies 212 entire homes with two or more bedrooms within three miles of Levi's Stadium -- the core inventory that corporate event planners and high-budget travelers target first. The Levi's Stadium Airbnb supply in this radius is a fraction of what a typical Super Bowl host city offers.
Key takeaway: The proximity premium is real and steep. Hosts within 10 miles of Levi's Stadium are capturing 30-37% rate premiums, while listings 45 miles away in San Francisco see only 5.6% above baseline.
Booking Pacing: The Demand Curve in Real Time
Booking pacing -- the percentage of available listings already booked for a given date -- is the most forward-looking indicator of Super Bowl host revenue potential. AirROI's API tracks pacing in real time across the Bay Area, and the picture for Super Bowl week reveals sharp demand differentiation by date and city.
| Date | Santa Clara Fill | San Jose Fill | SF Fill |
|---|---|---|---|
| Feb 1 (Sun) | 25% | 25% | 36% |
| Feb 5 (Thu) | 44% | 34% | 44% |
| Feb 6 (Fri) | 62% | 53% | 50% |
| Feb 7 (Sat) | 76% | 58% | 50% |
| Feb 8 (Game Day) | 74% | 55% | 44% |
| Feb 9 (Mon) | 33% | 31% | 34% |
Source: AirROI API booking pacing data, January 2026
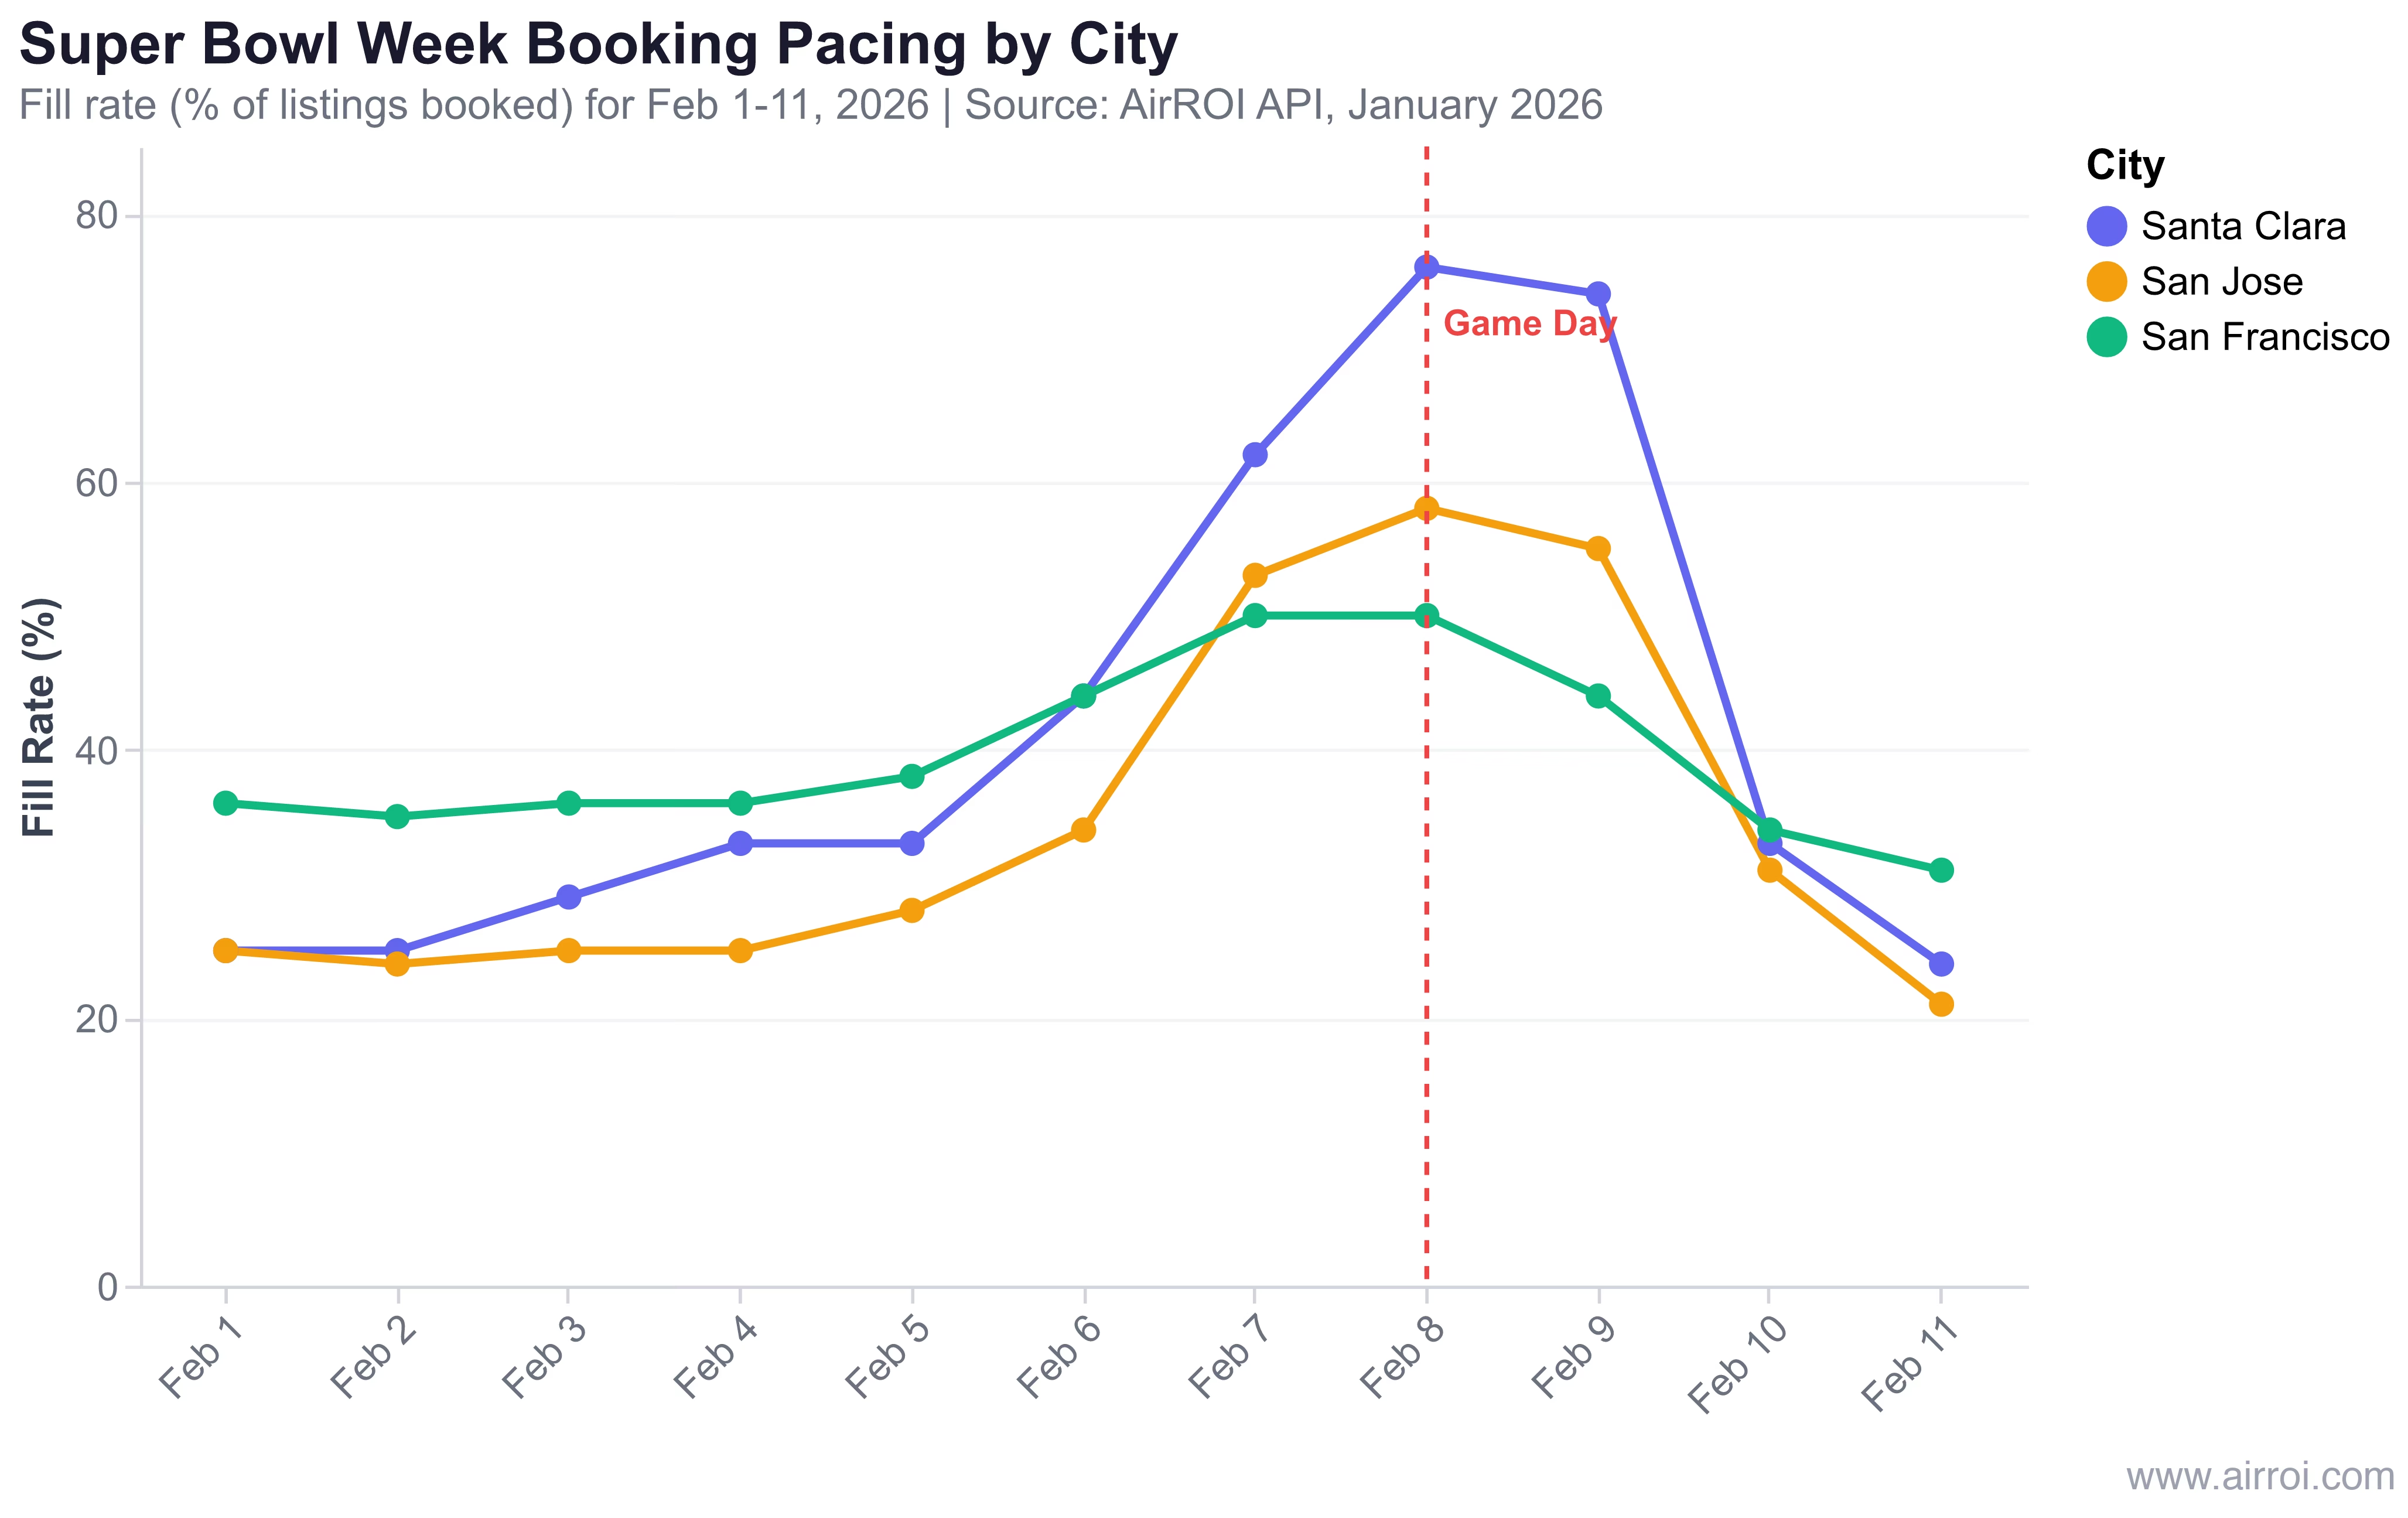
Day-by-Day Demand Narrative
The pacing data tells a clear story of event-driven rental demand layered on top of baseline travel patterns.
Sunday through Wednesday (Feb 1-4): Demand sits near baseline levels. Santa Clara and San Jose both hover around 25-33% fill rate. San Francisco, with its higher baseline tourism demand, sits at 36%. The Super Bowl has not yet pulled in visitors.
Thursday (Feb 5): The inflection point. Santa Clara jumps to 44% as early arrivals -- media, corporate sponsors, NFL staff -- begin checking in. This is when the demand surge becomes visible in the data. San Jose lags at 34%, but San Francisco matches Santa Clara at 44%, driven by its broader appeal as a destination city where early visitors combine event attendance with tourism.
Saturday (Feb 7): Peak demand. Santa Clara reaches 76% fill rate -- 257 listings booked, roughly 336 still available. At $292 average booked rate, the market is clearing but not sold out, meaning late-booking travelers will pay premium rates for remaining inventory. San Jose hits 58% with 1,118 booked listings. San Francisco plateaus at 50%, reflecting its distance from the venue.
Game Day (Feb 8): A slight dip from Saturday -- Santa Clara at 74%, with 253 booked and 340 available at a $280 average booked rate. The Sunday-night checkout dynamic means some Saturday guests depart without staying Sunday, creating a brief gap. This pattern is consistent across Super Bowl history, where the game-night pacing dips 2-5 points below the preceding Saturday.
Monday (Feb 9): The cliff. All three markets crash back toward baseline as the event clears. Santa Clara drops to 33%, San Jose to 31%, San Francisco to 34%. The demand surge window is roughly four days -- Thursday through Sunday. Hosts who extend their minimum stay past Monday risk sitting on empty calendar nights.
What the Numbers Mean for Remaining Inventory
Approximately 340 Santa Clara listings remain available for the peak Saturday night. In San Jose, the number is significantly larger -- roughly 1,917 available listings. San Francisco has over 4,046. For hosts who have not yet optimized their pricing, the window is narrowing but far from closed, especially outside the immediate five-mile radius.
Key takeaway: The four-day demand window from Thursday through Sunday concentrates virtually all Super Bowl revenue potential. Hosts should structure minimum stays and pricing around this window, not the full week.
Super Bowl 50 Deja Vu: Why 2026 Will Be Different
Levi's Stadium last hosted the Super Bowl in February 2016 -- Super Bowl 50. That event produced a widely discussed "bump that wasn't," where Airbnb host expectations outpaced actual demand. A decade later, the market is fundamentally different.
| Factor | 2016 (Super Bowl 50) | 2026 (Super Bowl LX) |
|---|---|---|
| Venue | Levi's Stadium | Levi's Stadium |
| Airbnb maturity | Early growth phase | Mature platform |
| Listings booked | ~4,000 | 17,835 available |
| Avg nightly rate | $225 | $264-$308 (already set) |
| Dynamic pricing adoption | Rudimentary | Sophisticated tools |
| Regulation | Minimal | SF 90-day cap, registration |
| Host pricing expectations | Overhyped | Data-informed |
| Key outcome | "Bump that wasn't" | TBD -- data suggests controlled growth |
Source: AirROI analysis, media reports, Airbnb 2016 disclosures
Why the Oversupply Will Not Repeat
In 2016, approximately 85% of Bay Area Super Bowl listings were priced under $300 per night, and Airbnb reported roughly 15,000 guests using the platform for the event. The projected economic impact was $21 million, but host expectations ran far ahead of reality because the STR market lacked the data infrastructure to set accurate prices.
Today, three structural changes prevent a repeat.
Second, regulation constrains supply. San Francisco's 90-day cap and registration requirements prevent the kind of supply flood that hit Phoenix in 2023. The Bay Area's regulatory framework acts as a natural brake on opportunistic listing activation, ensuring that the hosts who do participate are committed operators, not one-time speculators.
Third, booking pacing data creates transparency. In 2016, hosts set prices in the dark. In 2026, any host with access to AirROI or a comparable analytics platform can see that Santa Clara STR occupancy Super Bowl weekend is already at 76% for Saturday and calibrate their rate accordingly. Information asymmetry has collapsed, and that benefits both hosts (who price correctly) and guests (who face more rational pricing).
The Smart Host Playbook
Our analysis of eight Super Bowls and 17,835 Bay Area listings distills into a set of actionable strategies for maximizing Super Bowl host revenue while avoiding the pitfalls that have undermined hosts in previous years.
| Strategy | Do This | Not This |
|---|---|---|
| Minimum stay | 3-night min at $500/night = $1,500 | 1 night at $1,000 |
| Pricing timing | Set rates 4-6 months out | Wait until January |
| Rate anchoring | Match market pacing data | Guess based on hype |
| Listing copy | Highlight Levi's proximity, transit | Generic description |
| Cancellation | Honor existing bookings | Cancel and relist higher |
Price With Data, Not Hype
The most common host error across Super Bowl history is anchoring to headline ADR numbers without understanding their own market's pacing curve. Santa Clara's February average booked rate is $292 -- not $1,500. The $1,500+ listings are outliers at the top of the distribution, typically 3-4 bedroom entire homes within walking distance of the stadium. If your listing is a one-bedroom shared space 15 miles from Levi's, your rate premium is closer to 13-18%, not 150%.
Optimize Your Booking Window
Santa Clara's typical booking lead time averages 33 days. For Super Bowl weekend, PriceLabs data shows the booking window has stretched to 132 days -- four times the norm. The hosts capturing the highest-value reservations (corporate planners, NFL sponsors, media organizations) set their event pricing four to six months in advance.
If you are reading this in late January 2026, you are not too late, but the highest-paying corporate bookings have likely already been placed. The remaining demand will come from individual travelers, fan groups, and last-minute corporate overflow. Price accordingly -- the final wave of bookings tends to be more price-sensitive than the early corporate wave, but the supply constraint in Santa Clara means you still hold leverage.
The Three-Night Minimum Strategy
A three-night minimum stay at $500 per night generates $1,500 in gross revenue -- 50% more than a single night at $1,000. It also reduces turnover costs, cleaning coordination, and the risk of a one-night guest causing damage during a high-energy event weekend. Most experienced Super Bowl hosts in our dataset use three- or four-night minimums for Thursday through Sunday.
Update Your Listing Copy
Guests searching for Levi's Stadium Airbnb listings during Super Bowl week are filtering by proximity, bedrooms, and amenities. Mention your distance to the stadium in your title or first line of description. Highlight transit access -- the VTA light rail stops directly at Levi's Station. Note parking availability, which becomes a premium amenity when stadium lots fill. If you have a large screen for viewing parties, extra sleeping capacity, or a dedicated workspace for media professionals, call those out explicitly.
Do Not Cancel Existing Bookings
This bears repeating because it happens every Super Bowl cycle: some hosts cancel pre-existing reservations to relist at higher event rates. Beyond violating platform policies and risking account penalties, this practice damages your review history and long-term earning potential. The short-term gain of an extra $200-400 per night rarely compensates for the long-term cost of a cancellation penalty and degraded search ranking.
Beyond the Big Game: The World Cup Double-Header
The Super Bowl is not the only mega-event hitting Levi's Stadium in 2026. The FIFA World Cup 2026 brings multiple group-stage matches to the same venue in June and July, creating a rare double-header opportunity for Bay Area hosts.
The strategic implication is significant. Two mega-events at the same venue within five months means Bay Area hosts can amortize any upfront investment (furniture upgrades, professional photography, smart lock installation) across both events. A $2,000 investment in listing improvements that generates $4,000 in Super Bowl revenue and $3,000 in World Cup revenue pays for itself nearly four times over.
Conclusion
The data is clear. Super Bowl LX is already reshaping Bay Area STR demand in predictable, measurable ways that informed hosts can act on. Santa Clara's 76% Saturday fill rate confirms genuine demand. The 37.2% proximity premium validates location-based pricing strategies. And the historical pattern -- where regulated markets outperform unregulated ones -- suggests the Bay Area is structurally positioned for a strong, controlled revenue event rather than a boom-and-bust cycle.
The 340 Santa Clara listings still available for Saturday represent a narrowing but real opportunity. The 1,917 available San Jose listings and 4,046 in San Francisco offer alternative positions for hosts willing to compete on value rather than pure proximity. Whatever your market position, the tools exist to price it correctly.
Frequently Asked Questions
Based on AirROI data, entire-home hosts in Santa Clara are pricing at $264-$500+ for Super Bowl weekend, with top listings reaching $1,500+/night. A well-positioned 3-4BR near Levi's Stadium could earn $3,000-$5,000 for the Thu-Sun weekend -- potentially 15-25% of typical annual revenue. The "Marbella Lane" listing in Sunnyvale, for instance, has set Thursday at $1,645/night, with Friday through Sunday already booked. Revenue potential depends heavily on property type, bedroom count, and distance from Levi's Stadium, with entire homes within five miles commanding the steepest premiums.
No. Despite Santa Clara hitting 76% fill rate for Saturday, roughly 340 listings remain available. San Jose has 1,917 available listings and SF has 4,046. However, the highest-paying corporate bookings typically come 3-4 months out, so act soon. The remaining booking window will be dominated by individual travelers and last-minute corporate overflow, which still represents meaningful revenue -- just not at the peak rates early bookers secured.
PriceLabs data shows the booking window for Super Bowl weekend is already at 132 days -- four times the typical 33-day Santa Clara average. Top-performing hosts set event pricing 4-6 months in advance and adjust as demand signals clarify. Waiting until late January means missing the highest-value corporate reservations. If you are setting prices now, use real-time pacing data from AirROI Atlas to benchmark against current fill rates rather than guessing.
Unlikely. Phoenix saw listings surge from 5,000 to 21,000 due to minimal regulation, driving STR occupancy down to just 52% during the event. The Bay Area's regulatory environment -- particularly SF's 90-day cap and registration requirements -- constrains supply growth. Santa Clara has just 992 total listings, making a Phoenix-style supply flood structurally implausible. The more relevant comparison is New Orleans 2025, where regulation-constrained supply produced $11.1 million in STR revenue at $670-690 ADR.
AirROI's Atlas tool provides free market-level analytics including booking pacing, ADR trends, and occupancy data for Santa Clara, San Jose, San Francisco, and other Bay Area markets. Use it to benchmark your pricing against real-time competitor data. You can view fill rates, rate distributions, and supply metrics updated regularly -- the same data infrastructure that powers the analysis in this article. Visit AirROI Atlas to start exploring your market.