Airbnb Title That Converts: Top SEO Keywords Revealed
Standing out on Airbnb is challenging. While great photos and smart pricing are crucial, your Airbnb listing title is often the first impression. Does it grab attention and drive bookings?
This analysis uses real-world Airbnb performance data to provide actionable insights. It's grounded in Expertise from Airbnb data analytics and Experience refining strategies with data. While a title isn't magic, optimizing it offers a competitive edge.
Based on the free AirROI published dataset, the average Trailing Twelve Month (TTM) Occupancy across analyzed listings was approximately 41.1%, with average TTM Revenue around $35,733. Use this as a benchmark as we explore keywords that outperform the average.
1. Spotlight High-Value Amenities: Keywords That Drive Revenue
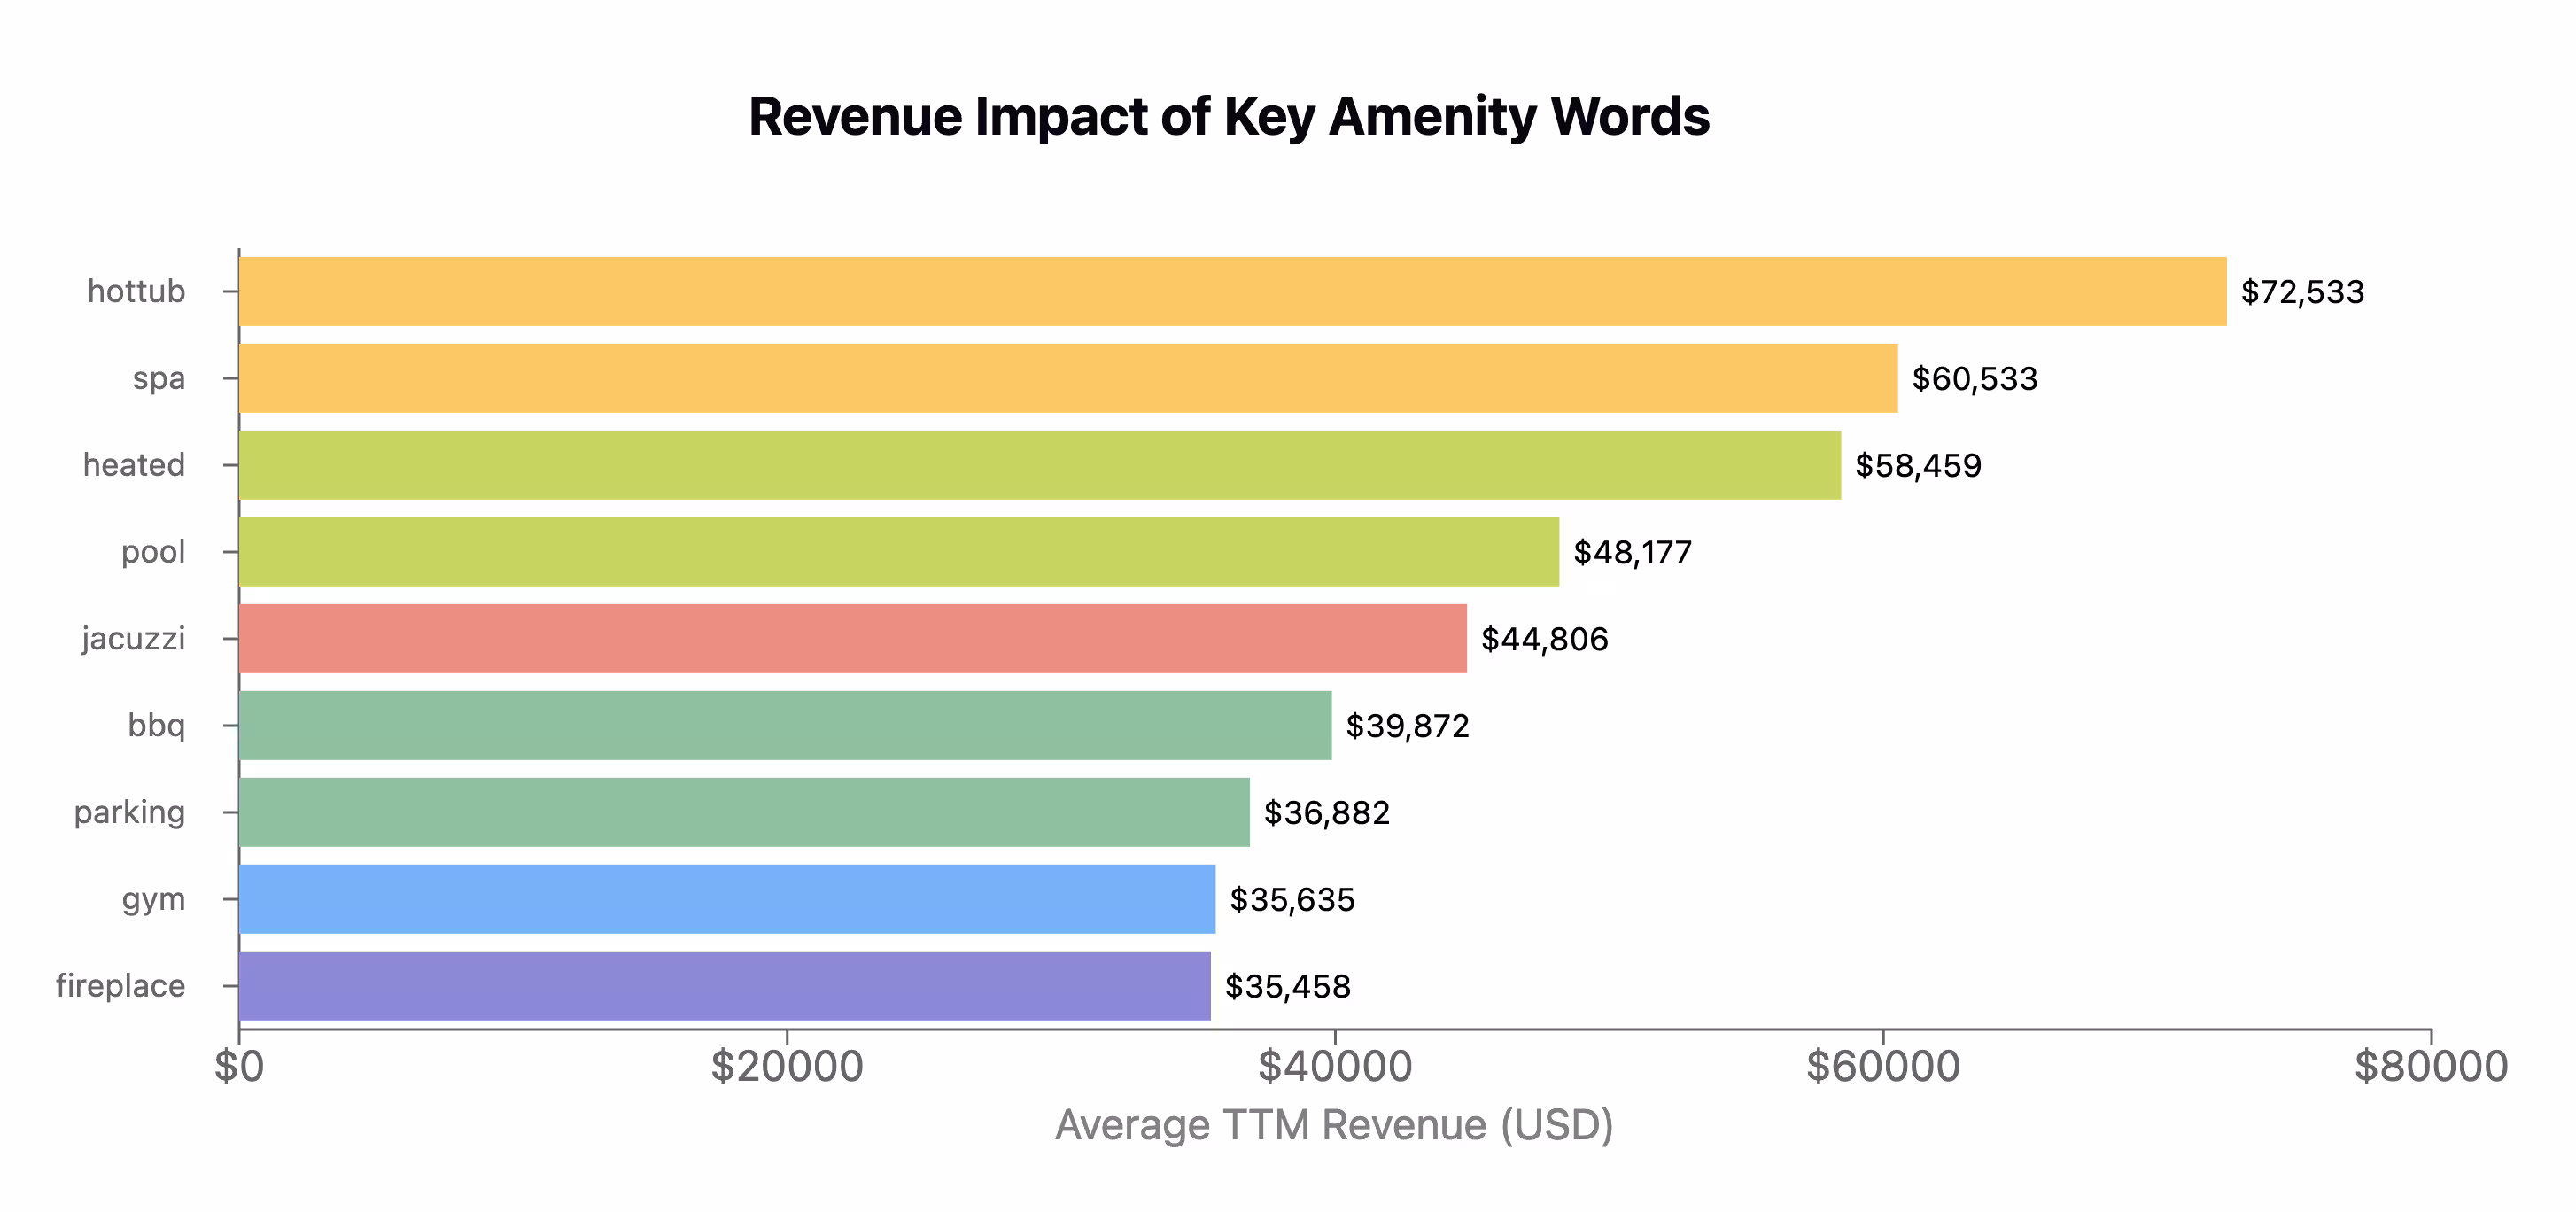
Water & Heat are Revenue Magnets:
- hottub: $72,533
- spa: $60,533
- heated (likely pools): $58,459
- pool: $48,177
- jacuzzi: $44,806
The Power of Scenery:
- oceanview: $60,943
- views: $50,907
- view: $40,179
Appealing Outdoor Spaces:
- deck: $41,249
- bbq: $39,872
- balcony: $38,005
- terrace: $36,245
- patio: $32,517
- garden: $28,247
Cozy & Entertaining Features:
- fire: $67,257 (likely 'fire pit')
- game (game room): $55,844
- fireplace: $35,458
Actionable Insight: Have a hot tub, pool, stunning view, or fireplace? Feature it in your title! Example: "Oceanview Villa with Private Pool & Hot Tub" is far more compelling than "Nice Villa Near the Beach." This is prime Airbnb SEO.
2. Location, Location, Location: Keywords for Higher Occupancy
Convenience drives bookings. Airbnb analytics show terms highlighting accessibility and desirable locations often boost occupancy.
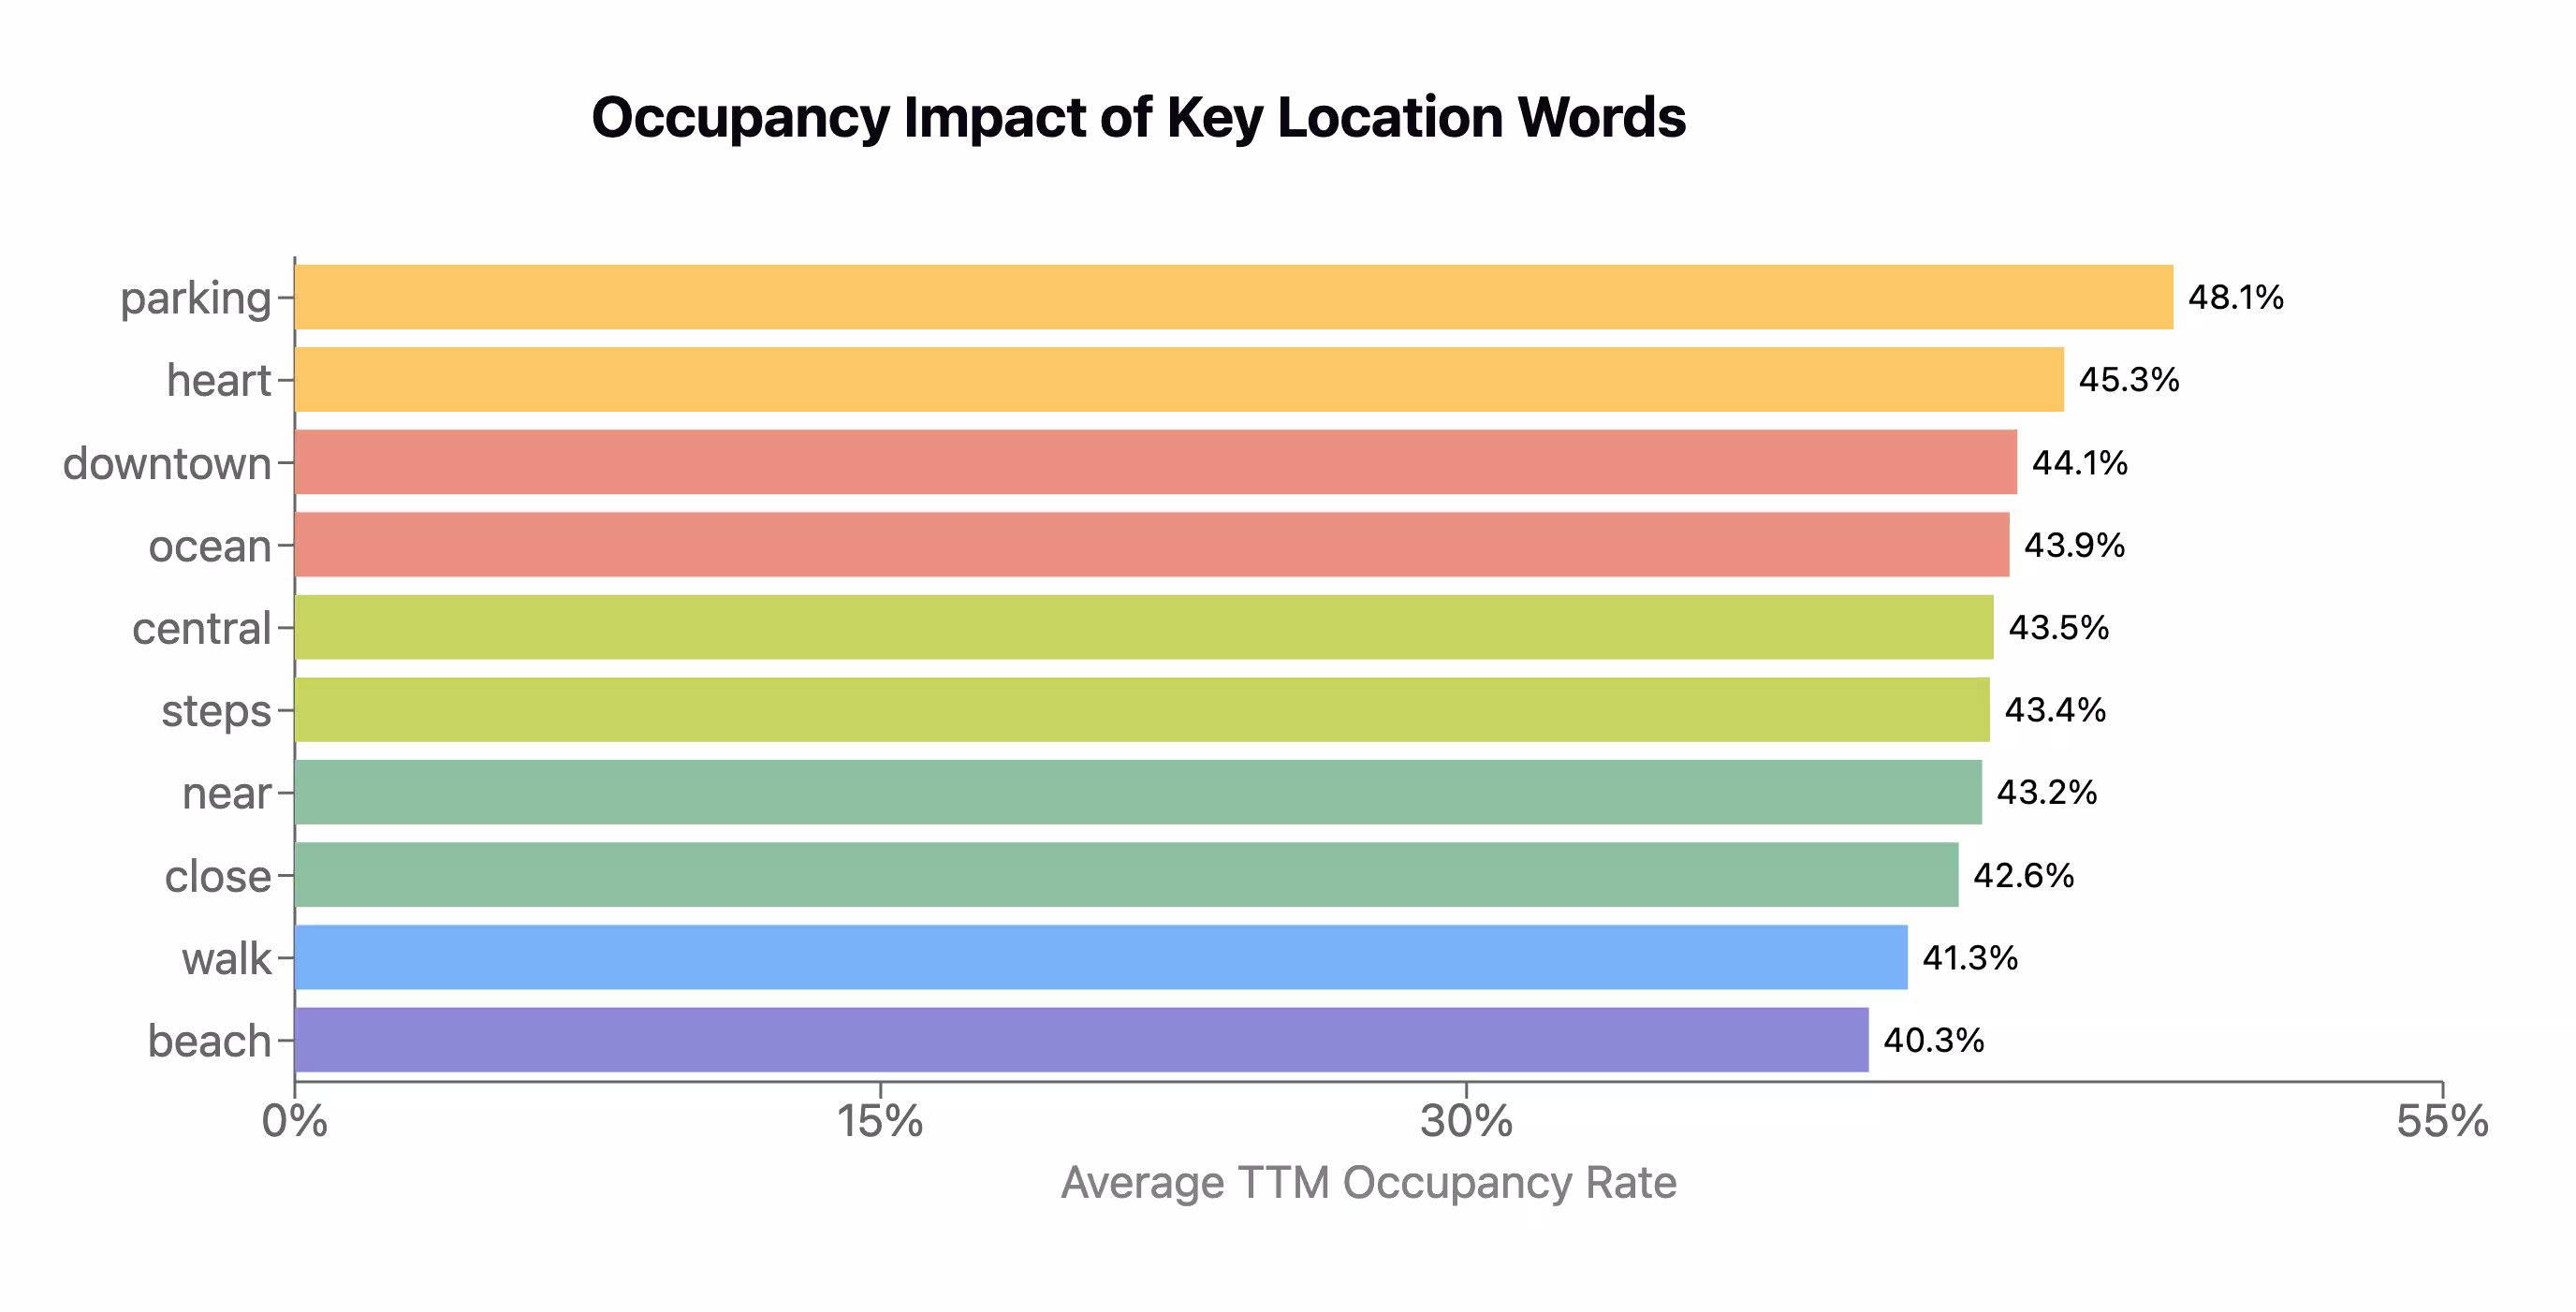
Convenience Boosts Bookings (Occupancy):
- parking: 48.1% (Often crucial)
- heart (of downtown, etc.): 45.3%
- downtown: 44.1%
- central: 43.5%
- walk (to attractions/beach): 41.3%
Desirable Settings Attract Guests:
- ocean: 43.9% Occupancy | $42,248 Revenue
- beach: 40.3% Occupancy | $39,752 Revenue
- waterfront: 38.3% Occupancy | $48,525 Revenue
- lake: 39.3% Occupancy | $34,863 Revenue
Actionable Insight: Clearly communicate location advantages. Use phrases like "Walk to Beach," "Heart of Downtown Studio," or "Condo with Free Parking." Specificity reduces uncertainty. Mentioning Free parking is a significant draw.
3. Set the Mood: Evocative Adjectives That Sell the Experience
Descriptive words shape perception. Choose adjectives that fit your property's vibe and target guest.
Signal Quality & Higher Price Points:
- luxury: $50,310
- stunning: $49,939
- prime (location): $38,968
Highlight Comfort & Charm (Often Boosting Occupancy):
- romantic: 50.0% Occupancy
- charming: 48.5%
- cozy: 44.8%
- quiet: 42.4%
Suggest Unique Escapes (Strong Occupancy):
- hideaway: 45.5% Occupancy
- gem: 45.9%
- oasis: 43.5%
- retreat: 42.1%
- nest: 36.6%
Define the Style:
- chic: 47.8% Occupancy
- stylish: 46.1%
- historic: 45.4%
- modern: 45.5%
Actionable Insight: Select adjectives that resonate with your ideal guest. "Luxury Downtown Penthouse" targets differently than a "Cozy Cabin Retreat."
4. Specificity Sells: Ditch Generic Terms for Higher Value
Generic words like apartment (Avg TTM Revenue: $25,415 | Avg TTM Occupancy: 48.3%) or house (Avg TTM Revenue: $37,441 | Avg TTM Occupancy: 43.2%) are functional but don't stand out. Our Airbnb data analysis shows specificity often correlates with better performance, especially revenue:
- Penthouse: Avg TTM Revenue: $55,918 | Avg TTM Occupancy: 47.0%
- Villa: Avg TTM Revenue: $39,915 | Avg TTM Occupancy: 36.1%
- Other strong contenders: Studio, Cottage, Cabin, Townhouse.
Actionable Insight: If your property fits a distinct category (like Penthouse, Villa), feature it prominently. Be accurate, but leverage specificity to attract guests seeking unique stays. This demonstrates Authoritativeness.
5. Emphasize the Unique: Stand Out from the Crowd
What makes your property different? Highlighting unique features can capture niche interest and boost occupancy.
Unique Property Types (High Occupancy):
- treehouse: 47.7%
- tiny (house): 45.6%
- historic: 45.4%
- cabin: 43.6%
- Activity-Focused: Mentioning nearby golf or ski access targets specific travelers.
Actionable Insight: If you have a unique offering, highlight it! "Historic Riad in Medina," "Ski-in/Ski-out Chalet," or "Unique Treehouse Escape w/ Hot Tub" grabs attention.
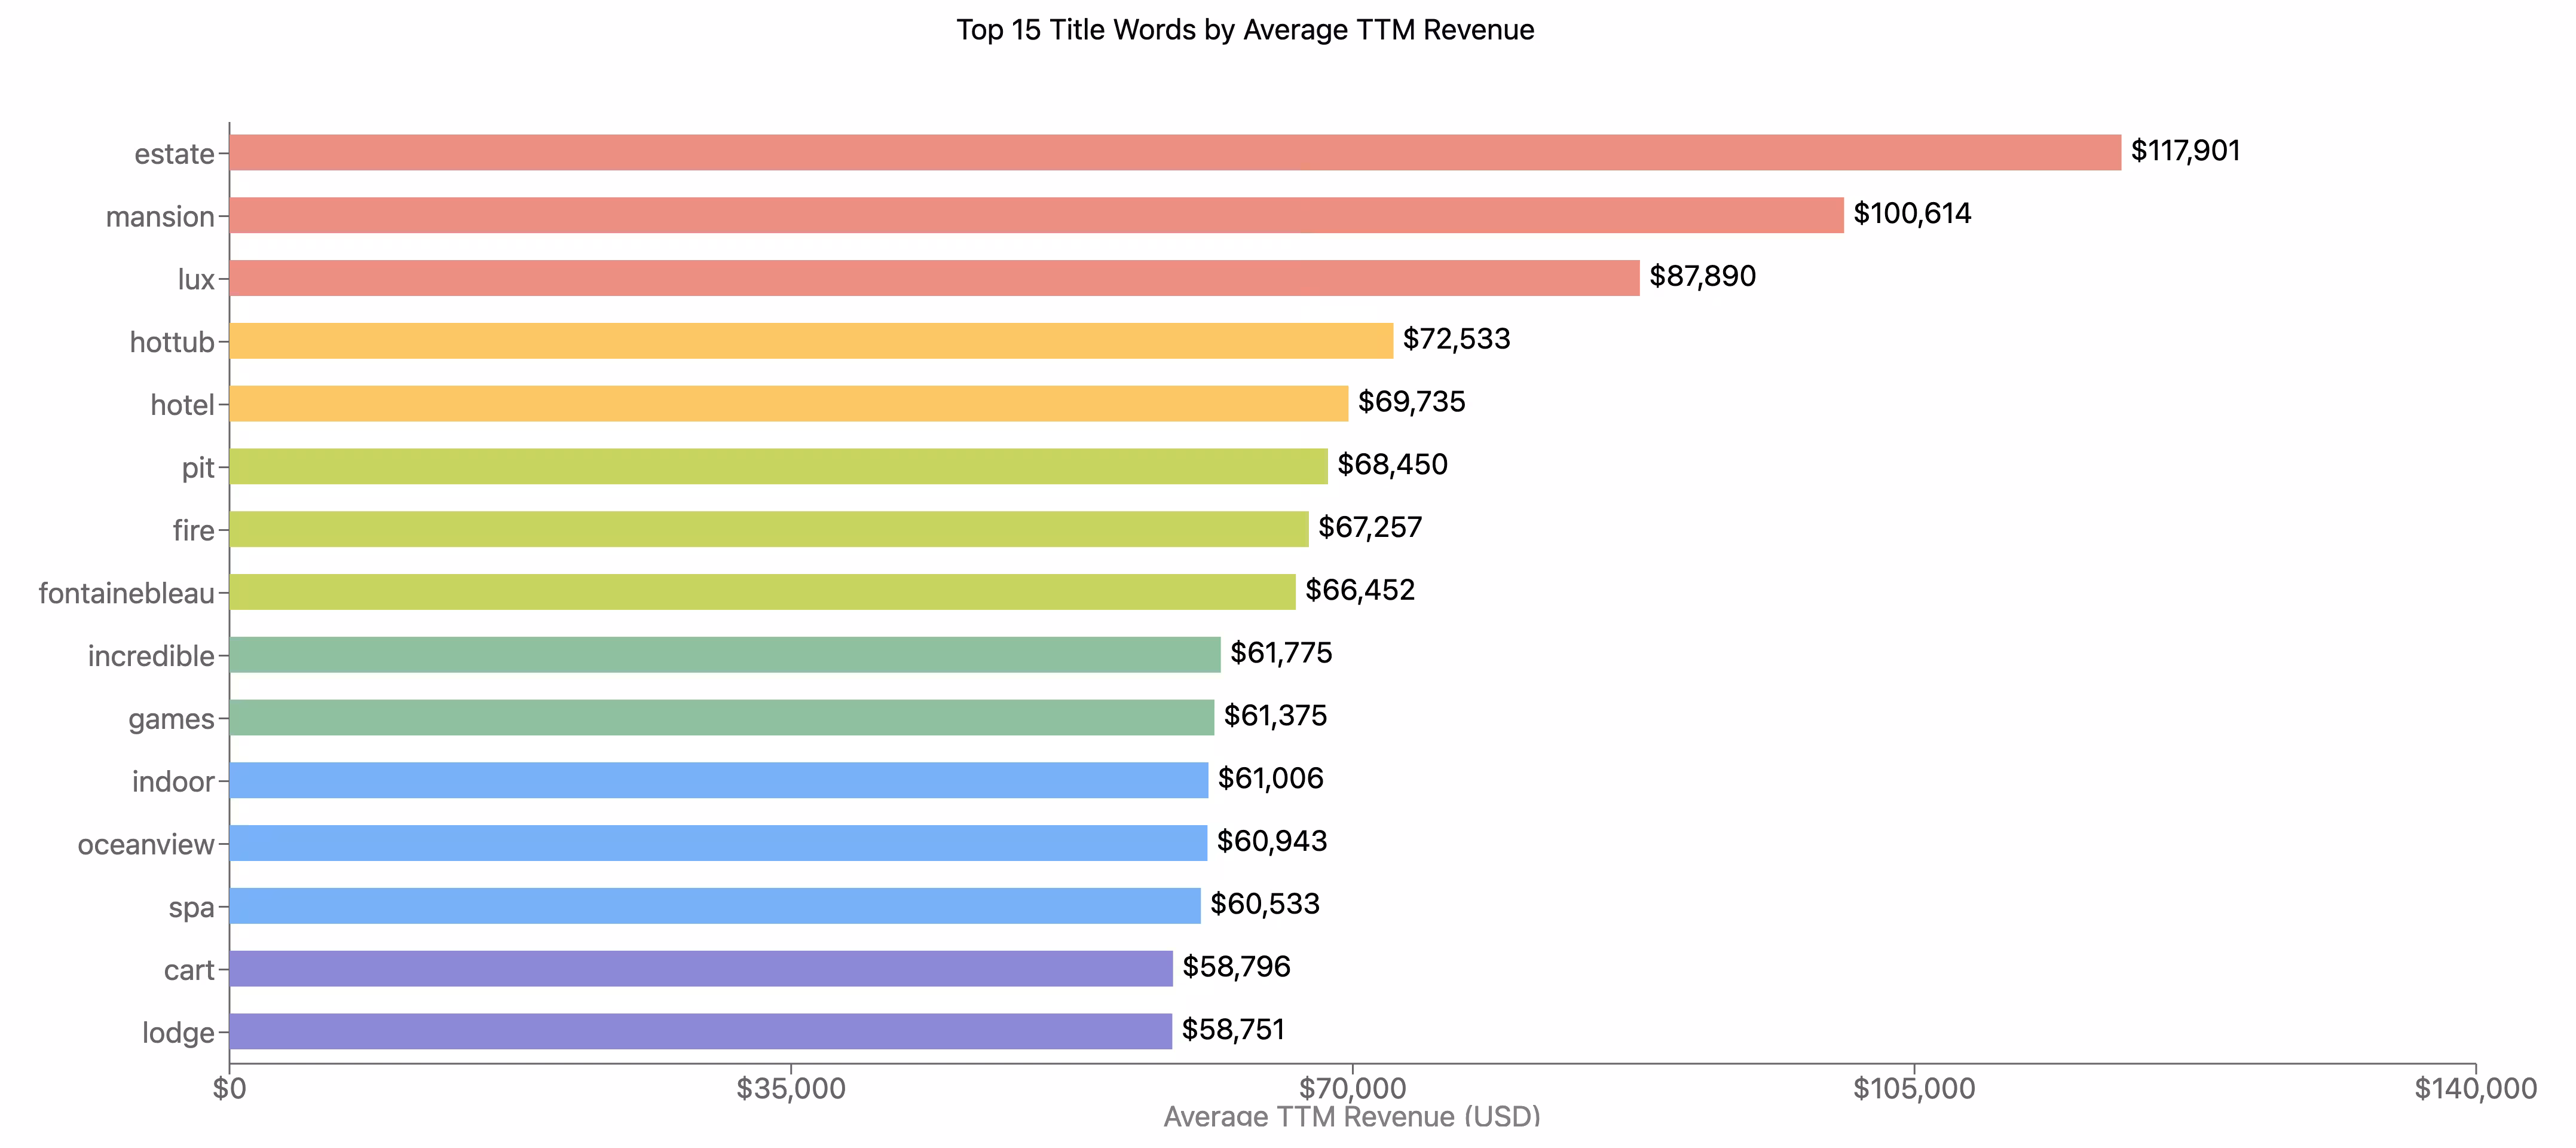
Top Performing Airbnb Title Keywords By Revenue Overall
The data reveals a clear dominance of terms signaling luxury and significant space among the top Airbnb keywords by revenue: estate ($117,901), mansion ($100,614), and lux ($87,890). This strongly suggests that positioning your property towards the high-end market, if applicable, can yield substantial Airbnb revenue premiums.
Beyond sheer scale, premium amenities are undeniable revenue drivers. Keywords like hottub ($72,533), spa ($60,533), and fire/pit (often indicating a desirable fire pit, averaging $67k-$68k) clearly attract guests willing to pay significantly more for enhanced comfort and experiences. This data highlights a key path for Airbnb revenue optimization: accurately featuring these high-impact keywords doesn't just describe; it sells a higher-value stay, directly tapping into searches for high-revenue Airbnb features. While luxury and key amenities lead, the presence of terms like fontainebleau or cart also hints that unique location branding or specific activity-related features can carve out lucrative niches.
The Bottom Line: Optimize Your Title, Optimize Your Success
Report based on analysis of AirROI's extensive dataset of Airbnb listings. All metrics represent averages for listings containing the specified word in their title within this dataset during the TTM period analyzed. As emphasized, correlation does not imply causation. Market conditions, property specifics, and host factors significantly influence individual listing performance. Data distributions vary; analysis relies on large sample sizes.