Poljica Brig, Zadar County Airbnb Market Data 2025: STR Report & Statistics
How much can you earn on Airbnb in Poljica Brig, Zadar County? Based on AirROI's 2025 dataset (May 2024 – April 2025), the short answer is $39,766 per year — at a $482 nightly rate, 50.8% occupancy, and a N/A RevPAR.
With just 17 active listings, Poljica Brig is a micro-market where solid booking activity throughout the year. Supply grew 54.5% over the past year, yet revenue and nightly rates both trended upward — a signal that traveler demand is outpacing new inventory rather than being diluted by it. For hosts, pricing power remains intact even as competition increases.
Regulation is low with minimal registration requirements, pointing to an operator-friendly environment. In a market this size, differentiated listings with strong reviews can capture outsized returns relative to the competition.

Table of Contents [hide] [show]
What Are the Key Airbnb Metrics in Poljica Brig?
In Poljica Brig, the headline Airbnb metrics are $39,766 in average annual revenue,50.8% occupancy, $482 ADR, and $0 in RevPAR, and guests book about 77 days in advance.
How Much Do Airbnb Hosts Earn Monthly in Poljica Brig?
Understanding the monthly revenue variations for Airbnb listings in Poljica Brig is key to maximizing your short term rental income potential. Seasonality significantly impacts earnings. Our analysis, based on data from the past 12 months, shows that the peak revenue month for STRs in Poljica Brig is typically August, while March often presents the lowest earnings, highlighting opportunities for strategic pricing adjustments during shoulder and low seasons. Explore the typical Airbnb income in Poljica Brig across different performance tiers:
- Best-in-class properties (Top 10%) achieve $13,017+ monthly, often utilizing dynamic pricing and superior guest experiences.
- Strong performing properties (Top 25%) earn $7,061 or more, indicating effective management and desirable locations/amenities.
- Typical properties (Median) generate around $3,648 per month, representing the average market performance.
- Entry-level properties (Bottom 25%) see earnings around $2,070, often with potential for optimization.
Average Monthly Airbnb Earnings Trend in Poljica Brig
What Is the Monthly Airbnb Occupancy Rate in Poljica Brig?
Maximize your bookings by understanding the Poljica Brig STR occupancy trends. Seasonal demand shifts significantly influence how often properties are booked. Typically, Augustsees the highest demand (peak season occupancy), while February experiences the lowest (low season). Effective strategies, like adjusting minimum stays or offering promotions, can boost occupancy during slower periods. Here's how different property tiers perform in Poljica Brig:
- Best-in-class properties (Top 10%) achieve 63%+ occupancy, indicating high desirability and potentially optimized availability.
- Strong performing properties (Top 25%) maintain 47% or higher occupancy, suggesting good market fit and guest satisfaction.
- Typical properties (Median) have an occupancy rate around 34%.
- Entry-level properties (Bottom 25%) average 25% occupancy, potentially facing higher vacancy.
Average Monthly Occupancy Rate Trend in Poljica Brig
What Is the Average Airbnb Nightly Rate in Poljica Brig?
Effective short term rental pricing strategy in Poljica Brig involves understanding monthly ADR fluctuations. The Average Daily Rate (ADR) for Airbnb in Poljica Brig typically peaks in July and dips lowest during November. Leveraging Airbnb dynamic pricing tools or strategies based on this seasonality can significantly boost revenue. Here's a look at the typical nightly rates achieved:
- Best-in-class properties (Top 10%) command rates of $978+ per night, often due to premium features or locations.
- Strong performing properties (Top 25%) achieve nightly rates of $639 or more.
- Typical properties (Median) charge around $376 per night.
- Entry-level properties (Bottom 25%) earn around $244 per night.
Average Daily Rate (ADR) Trend by Month in Poljica Brig
What Is the RevPAR for Airbnb in Poljica Brig?
RevPAR in Poljica Brig is currently N/A. Because RevPAR combines nightly rates with realized occupancy, it is one of the cleanest ways to compare how efficiently listings turn demand into revenue across the market.
- Entry-level properties (Bottom 25%) see N/A RevPAR.
- Typical properties (Median) generate N/A RevPAR.
- Strong performers (Top 25%) earn N/A RevPAR.
- Best-in-class (Top 10%) achieve N/A RevPAR.
Average Monthly RevPAR Trend in Poljica Brig
RevPAR Insights for Poljica Brig
- RevPAR peaks in Jan and bottoms out in Jan, mirroring the broader seasonal demand pattern and suggesting opportunities for dynamic pricing.
Recommendations for Hosts
- Track your own RevPAR monthly against these Poljica Brig benchmarks. If your RevPAR falls below the median of N/A, examine whether low occupancy or low ADR is the primary drag.
- Use RevPAR rather than revenue alone when comparing properties of different sizes — it normalizes for available nights and gives a more accurate picture of performance.
Get Live Poljica Brig Market Intelligence 👇
Explore Real-time Analytics
When Is the Peak Season for Airbnb in Poljica Brig?
Poljica Brig's peak Airbnb season falls in August, January, July, while the softest stretch is February, March, December. Overall, the market shows highly seasonal trends requiring careful strategy, which should guide pricing, minimum stays, and cash-flow planning.
Peak Season (August, January, July)
- Revenue averages $9,646 per month
- Occupancy rates average 49.8%
- Daily rates average $516
Shoulder Season
- Revenue averages $5,257 per month
- Occupancy maintains around 42.7%
- Daily rates hold near $451
Low Season (February, March, December)
- Revenue drops to average $1,499 per month
- Occupancy decreases to average 15.8%
- Daily rates adjust to average $480
Seasonality Insights for Poljica Brig
- Airbnb seasonality in Poljica Brig is pronounced. Revenue swings sharply between peak and low months, which means pricing strategy, minimum-stay settings, and cash reserves all need to account for extended slower periods.
- During the high season, the absolute peak month showcases Poljica Brig's highest earning potential, with monthly revenues climbing to $12,060, occupancy reaching 73.9%, and ADRs peaking at $523.
- Conversely, the slowest single month marks the market's lowest point — revenue may dip to $998, occupancy could drop to 10.8%, and ADRs may adjust to $432.
- Understanding both the seasonal averages and these monthly peaks and troughs in revenue, occupancy, and ADR is crucial for maximizing your Airbnb profit potential in Poljica Brig.
Seasonal Strategies for Maximizing Profit
- Peak Season: Maximize revenue through premium pricing and potentially longer minimum stays. Ensure high availability and consider tightening cancellation policies to reduce last-minute gaps.
- Low Season: Offer competitive pricing, extended-stay discounts, and flexible cancellation policies. Target off-season travelers like remote workers, budget-conscious guests, and travelers with flexible schedules.
- Shoulder Seasons: Implement dynamic pricing that bridges peak and low rates. Target weekend travelers, local events, and business visitors. Slightly more flexible terms than peak season can help maintain occupancy without deep discounting.
- In a highly seasonal market like Poljica Brig, building a cash reserve during the top months is essential for covering fixed costs during the slow period. Automated pricing tools can help capture demand shifts in real time.
Do You Need a License for Airbnb in Poljica Brig?
Low regulation and minimal registration activity in Poljica Brig, Zadar County, Croatia point to an operator-friendly environment. That said, even low-regulation markets may have tax collection requirements, safety standards, or HOA rules that affect short-term rental operations. Always verify the latest short-term rental regulations and Airbnb license requirements directly with local government authorities for Poljica Brig to ensure full compliance before hosting.
(Source: AirROI data, 2026, finding no licensed listings among those analyzed)
What Are the Best Neighborhoods for Airbnb in Poljica Brig?
With a compact short-term rental market, Poljica Brig gives early-mover hosts an advantage in the right neighborhoods. The areas listed below are where guest demand and local attractions converge — a useful lens for investors evaluating whether to enter this market and where to position their listing.
| Neighborhood / Area | Why Host Here? (Target Guests & Appeal) | Key Attractions & Landmarks |
|---|---|---|
| Poljica Brig | A quiet village nestled in nature, perfect for travelers seeking tranquility away from the bustling tourist spots. Close proximity to Zadar offers cultural experiences and local beaches. | Zadar Old Town, Greetings to the Sun, Sea Organ, Nin, Sveti Petar Beach, Paklenica National Park |
| Zadar City Center | The historic heart of Zadar, featuring ancient Roman ruins, vibrant streets, and waterfront views. Ideal for tourists looking for a rich blend of history and modern amenities. | Roman Forum, St. Donatus Church, Zadar Sea Organ, Museum of Illusions, Zadar Cathedral, Five Wells Square |
| Nin | A charming old town with sandy beaches, known for its rich history and salt production. Attracts families and history enthusiasts. | Nin Lagoon, Church of the Holy Cross, Queen's Beach, Ninska Laguna, Salt Fields, Stone Bridge |
| Biograd na Moru | A popular coastal tourist town with a picturesque marina and beautiful beaches. Great for beach lovers and water sports enthusiasts. | Biograd Ferry Port, Soline Beach, Fun Park Biograd, Riviera Beach, Kornati National Park, Marina Kornati |
| Paklenica National Park | A stunning national park famous for its climbing, hiking, and breathtaking landscapes. Perfect for nature lovers and outdoor enthusiasts. | Velika Paklenica, Small Paklenica, Hiking Trails, Rock Climbing Areas, Visitor Center, Scenic Views |
| Pakoštane | A serene coastal village known for its natural beauty and family-friendly atmosphere. Close to national parks and ideal for peaceful retreats. | Janice Beach, Pine Beach, Lake Vrana, Vransko Lake Nature Park, Olive Groves, Water Sports |
| Starigrad-Paklenica | A town that serves as a gateway to Paklenica National Park, offering beautiful accommodation options and outdoor adventures. | Paklenica National Park, Beaches, Hiking Trails, Traditional Dalmatian Cuisine, Scenic Views, Cultural Heritage |
| Vir Island | A small island community with beautiful beaches and relaxed atmosphere. Popular for summer vacations among families and Aquatic sports lovers. | Vir Beach, Duboka Draga Beach, Jadro Beach, Historical Sites, Water Sports, Nightlife |
With 8 distinct neighborhoods showing meaningful short-term rental activity, Poljica Brig offers diversification within a single market. Investors can tailor their strategy — from high-turnover tourist zones to quieter residential areas that attract longer stays and remote workers.
What Types of Properties Are on Airbnb in Poljica Brig?
Room Type Distribution
Property Type Distribution
Market Composition Insights for Poljica Brig
- The Poljica Brig Airbnb market composition is heavily skewed towards Entire Home/Apt listings, which make up 100% of the 17 active rentals. This indicates strong guest preference for privacy and space.
- Looking at the property type distribution in Poljica Brig, House properties are the most common (88.2%), reflecting the local real estate landscape.
- Houses represent a significant 88.2% portion, catering likely to families or larger groups.
Poljica Brig Airbnb Room Capacity Analysis (2026): Bedroom Distribution
Distribution of Listings by Number of Bedrooms
Room Capacity Insights for Poljica Brig
- The dominant room capacity in Poljica Brig is 5+ bedrooms listings, making up 41.2% of the market. This suggests a strong demand for properties suitable for families or small groups.
- Together, 5+ bedrooms and 4 bedrooms properties represent 70.6% of the active Airbnb listings in Poljica Brig, indicating a high concentration in these sizes.
- A significant 100.0% of listings offer 3+ bedrooms, catering to larger groups and families seeking more space in Poljica Brig.
Poljica Brig Vacation Rental Guest Capacity Trends (2026)
Distribution of Listings by Guest Capacity
Guest Capacity Insights for Poljica Brig
- The most common guest capacity trend in Poljica Brig vacation rentals is listings accommodating 8+ guests (70.6%). This suggests the primary traveler segment is likely larger groups.
- Properties designed for 8+ guests and 6 guests dominate the Poljica Brig STR market, accounting for 94.1% of listings.
- 94.1% of properties accommodate 6+ guests, serving the market segment for larger families or group travel in Poljica Brig.
- On average, properties in Poljica Brig are equipped to host 7.4 guests.
What Amenities Do Airbnb Guests Expect in Poljica Brig?
Amenity Prevalence
Amenity Insights for Poljica Brig
- Essential amenities in Poljica Brig that guests expect include: Wifi, Cooking basics, Kitchen, Free parking on premises, Washer, TV, Air conditioning. Lacking these (any) could significantly impact bookings.
- Popular amenities like BBQ grill, Pool, Essentials are common but not universal. Offering these can provide a competitive edge.
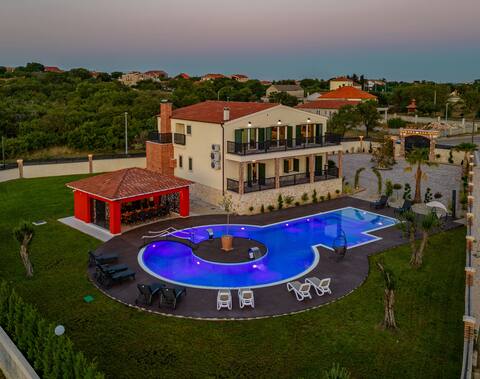
- A pool is a highly desired but not standard amenity, making it a key feature for attracting guests seeking leisure in Poljica Brig.
Recommendations for Hosts
- Ensure your listing includes all essential amenities for Poljica Brig: Wifi, Cooking basics, Kitchen, Free parking on premises, Washer, TV, Air conditioning.
- Consider adding popular differentiators like BBQ grill or Pool to increase appeal.
- Highlight unique or less common amenities you offer (e.g., hot tub, dedicated workspace, EV charger) in your listing description and photos.
- Regularly check competitor amenities in Poljica Brig to stay competitive.
Dive Deeper: Advanced Poljica Brig STR Market Data (2026)
Ready to unlock more insights? AirROI provides access to advanced metrics and comprehensive Airbnb data for Poljica Brig. Explore detailed analytics beyond this report to refine your investment strategy, optimize pricing, and maximize your vacation rental profits.
Explore Advanced MetricsPoljica Brig Airbnb Guest Demographics & Profile Analysis (2026)
Guest Profile Summary for Poljica Brig
- The typical guest profile for Airbnb in Poljica Brig consists of predominantly international visitors (98%), with top international origins including United Kingdom, typically belonging to the Post-2000s (Gen Z/Alpha) group (50%), primarily speaking English or German.
- Domestic travelers account for 1.7% of guests.
- Key international markets include Germany (36.2%) and United Kingdom (15.5%).
- Top languages spoken are English (50%) followed by German (27.8%).
- A significant demographic segment is the Post-2000s (Gen Z/Alpha) group, representing 50% of guests.
Recommendations for Hosts
- Focus marketing internationally, particularly towards travelers from United Kingdom.
- Tailor amenities and listing descriptions to appeal to the dominant Post-2000s (Gen Z/Alpha) demographic (e.g., highlight fast WiFi, smart home features, local guides).
- Highlight unique local experiences or amenities relevant to the primary guest profile.
- Consider seasonal promotions aligned with peak travel times for key origin markets.
Poljica Brig Airbnb Booking Patterns (2026): Available vs. Booked Days
Available Days Distribution
Booked Days Distribution
Booking Pattern Insights for Poljica Brig
- The most common availability pattern in Poljica Brig falls within the 271-366 days range, representing 76.5% of listings. This suggests many properties have significant open periods on their calendars.
- Approximately 100.0% of listings show high availability (181+ days open annually), indicating potential for increased bookings or specific owner usage patterns.
- For booked days, the 31-90 days range is most frequent in Poljica Brig (58.8%), reflecting common guest stay durations or potential owner blocking patterns.
How Far in Advance Do Guests Book Airbnb in Poljica Brig?
Average Booking Lead Time by Month
Booking Lead Time Insights for Poljica Brig
- The overall average booking lead time for vacation rentals in Poljica Brig is 77 days.
- Guests book furthest in advance for stays during May (average 115 days), likely coinciding with peak travel demand or local events.
- The shortest booking windows occur for stays in December (average 30 days), indicating more last-minute travel plans during this time.
- Seasonally, Summer (86 days avg.) sees the longest lead times, while Winter (59 days avg.) has the shortest, reflecting typical travel planning cycles.
Recommendations for Hosts
- Use the overall average lead time (77 days) as a baseline for your pricing and availability strategy in Poljica Brig.
- For May stays, consider implementing length-of-stay discounts or slightly higher rates for bookings made less than 115 days out to capitalize on advance planning.
- Target marketing efforts for the Summer season well in advance (at least 86 days) to capture early planners.
- Monitor your own booking lead times against these Poljica Brig averages to identify opportunities for dynamic pricing adjustments.
Poljica Brig Airbnb Minimum Stay Requirements Analysis
Distribution of Listings by Minimum Night Requirement
1 Night
3 listings
17.6% of total
3 Nights
5 listings
29.4% of total
4-6 Nights
2 listings
11.8% of total
7-29 Nights
2 listings
11.8% of total
30+ Nights
5 listings
29.4% of total
Key Insights
- The most prevalent minimum stay requirement in Poljica Brig is 3 Nights, adopted by 29.4% of listings. This highlights the market's preference for longer commitments.
- Very short stays (1-2 nights) are less common (17.6%), suggesting hosts prefer slightly longer bookings to optimize turnover.
- A significant segment (29.4%) caters to monthly stays (30+ nights) in Poljica Brig, pointing to opportunities in the extended-stay market.
Recommendations
- Align with the market by considering a 3 Nights minimum stay, as 29.4% of Poljica Brig hosts use this setting.
- If feasible, allowing 1-night stays, especially midweek or during low season, could capture last-minute bookings, as only 17.6% currently do.
- Explore offering discounts for stays of 30+ nights to attract the 29.4% of the market seeking extended stays.
- Adjust minimum nights based on seasonality – potentially shorter during low season and longer during peak demand periods in Poljica Brig.
Poljica Brig Airbnb Cancellation Policy Trends Analysis (2026)
Super Strict 30 Days
1 listings
9.1% of total
Moderate
1 listings
9.1% of total
Firm
4 listings
36.4% of total
Strict
5 listings
45.5% of total
Cancellation Policy Insights for Poljica Brig
- The prevailing Airbnb cancellation policy trend in Poljica Brig is Strict, used by 45.5% of listings.
- A majority (81.9%) of hosts in Poljica Brig utilize Firm or Strict policies, indicating a market where hosts prioritize booking security.
Recommendations for Hosts
- Consider adopting a Strict policy to align with the 45.5% market standard in Poljica Brig.
- With 45.5% using Strict terms, this is a viable option in Poljica Brig, particularly for high-value properties or during peak demand periods.
- Regularly review your cancellation policy against competitors and market demand shifts in Poljica Brig.
What Do the Top Airbnb Listings in Poljica Brig Look Like?
Benchmark your potential! Explore examples of top-performing Airbnb properties in Poljica Brigbased on Trailing Twelve Month (TTM) revenue. Analyze their characteristics, revenue, occupancy rate, and ADR to understand what drives success in this market.
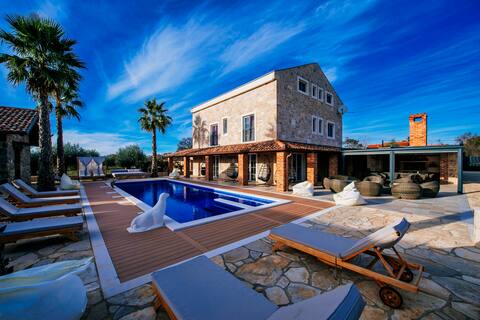
Incredible Luxury Rustic Estate - Villa Marta
Entire Place • 8 bedrooms
Villa Marta
Entire Place • 8 bedrooms
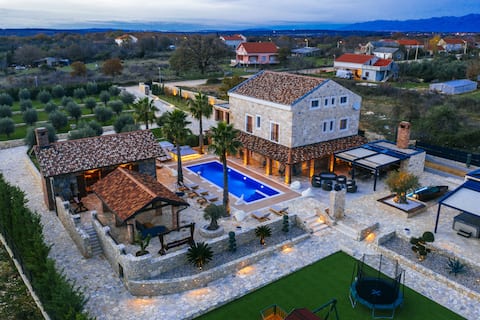
Villa Amfora for 12 guests with sauna, jacuzzi, te
Entire Place • 6 bedrooms
Wellness & spa Villa Spirini Dvori
Entire Place • 6 bedrooms
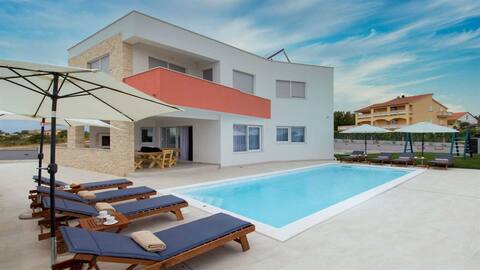
Villa Leon
Entire Place • 7 bedrooms

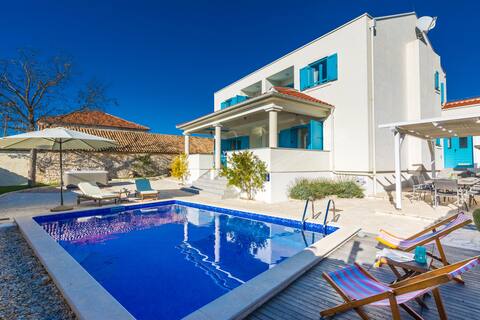
Villa Nola
Entire Place • 4 bedrooms
Note: Performance varies based on location, size, amenities, seasonality, and management quality. Data reflects the past 12 months.
Who Are the Top Airbnb Hosts in Poljica Brig?
Learn from the best! This table showcases top-performing Airbnb hosts in Poljica Brig based on the number of properties managed and estimated total revenue over the past year. Analyze their scale and performance metrics.
| Host Name | Properties | Grossing Revenue | Stay Reviews | Avg Rating |
|---|---|---|---|---|
| Tomislav | 4 | $173,296 | 5 | 1.15/5.0 |
| Host #401443164 | 1 | $83,387 | 0 | 0.00/5.0 |
| Danijela | 1 | $69,470 | 4 | 5.00/5.0 |
| Damir | 1 | $65,544 | 47 | 4.96/5.0 |
| Host #154026976 | 1 | $61,612 | 0 | 0.00/5.0 |
| Dubravka | 1 | $57,576 | 7 | 5.00/5.0 |
| Villa Matea | 2 | $40,135 | 39 | 4.96/5.0 |
| Adriatic Luxury Villas | 1 | $36,839 | 23 | 4.83/5.0 |
| Bilja&Darko | 1 | $22,124 | 33 | 4.61/5.0 |
| Host #154026790 | 1 | $20,935 | 0 | 0.00/5.0 |
Analyzing the strategies of top hosts, such as their property selection, pricing, and guest communication, can offer valuable lessons for optimizing your own Airbnb operations in Poljica Brig.
How Does Poljica Brig's Airbnb Market Compare to Nearby Cities?
How does the Poljica Brig Airbnb market stack up against its neighbors? Compare key performance metrics like average monthly revenue, ADR, and occupancy rates in surrounding areas to understand the broader regional STR landscape.
Compared with Općina Klis, Poljica Brig has 2 percentage points lower occupancy and about $139 higher ADR. That helps frame whether this market is winning more on demand, pricing, or both.
| Market | Active Properties | Monthly Revenue | Daily Rate | Avg. Occupancy |
|---|---|---|---|---|
| Dugopolje | 22 | $3,124 | $385.63 | 52% |
| Strožanac Gornji | 38 | $2,981 | $385.30 | 45% |
| Srinjine | 36 | $2,949 | $380.82 | 49% |
| Crno | 18 | $2,734 | $521.51 | 38% |
| Općina Klis | 87 | $2,653 | $343.45 | 53% |
| Grad Solin | 217 | $2,253 | $262.02 | 49% |
| Zemunik Gornji | 12 | $2,245 | $321.74 | 42% |
| Hum | 24 | $2,244 | $289.68 | 25% |
| Briševo | 19 | $2,221 | $317.80 | 41% |
| Kamen | 14 | $2,212 | $280.86 | 50% |
Frequently Asked Questions About Airbnb in Poljica Brig
These quick answers summarize the most common investor and operator questions using AirROI's latest market data for Poljica Brig.
How much do Airbnb hosts make in Poljica Brig?
Poljica Brig hosts earn about $39,766 per year on average, with an average nightly rate of $482 and RevPAR of N/A. Those figures describe the typical revenue environment for active listings in Poljica Brig, Zadar County, not the ceiling for the best operators. Source: AirROI 2025 data, Poljica Brig market, May 2024 to April 2025.
What is the average Airbnb occupancy rate in Poljica Brig?
The average Airbnb occupancy rate in Poljica Brig is 50.8%. August is the strongest month and March is the softest, so hosts should expect demand to move meaningfully throughout the year rather than stay flat.
What is the average Airbnb daily rate in Poljica Brig?
Listings in Poljica Brig average $482 per night. The broader pricing spread also matters: lower-performing listings cluster closer to the lower quartiles, while premium homes can price materially above the city average when demand spikes or listing quality stands out.
How many Airbnb listings are active in Poljica Brig?
Poljica Brig currently has about 17 active Airbnb listings in AirROI's market dataset. That supply count helps explain how competitive the market is, how much depth there is for benchmarking, and whether the market behaves like a niche destination or a scaled urban market.
How strict are short-term rental regulations in Poljica Brig?
AirROI currently classifies the short-term rental regulation level in Poljica Brig as Low. The dataset also shows about 0.0% of listings with registration evidence. That is a market signal, not legal advice, so hosts should still confirm current licensing and compliance rules locally before listing.
What is the RevPAR for Airbnb in Poljica Brig?
RevPAR in Poljica Brig is about N/A. That metric combines pricing and occupancy into one efficiency number, so it is often a better quick benchmark than ADR alone when investors want to compare how well listings convert nightly rates into realized revenue.
Is Airbnb profitable in Poljica Brig?
At 50.8% occupancy, Poljica Brig can be profitable — but margins depend heavily on operating costs, property acquisition price, and how well hosts optimize pricing across seasons. Average annual revenue is $39,766, but individual returns depend on property type, location within the city, and the host's operating efficiency.
How far in advance do guests book Airbnb in Poljica Brig?
The average booking lead time in Poljica Brig is about 77 days — a longer planning horizon typical of destination or vacation markets where travelers book well in advance. Hosts who understand their market's booking cadence can adjust minimum stays and pricing windows accordingly.
What are the best neighborhoods for Airbnb in Poljica Brig?
Based on AirROI's analysis, some of the top neighborhoods for short-term rentals in Poljica Brig include Poljica Brig, Zadar City Center, Nin. Each area attracts different guest profiles — from business travelers to leisure visitors — so the best location depends on the property type and target audience a host is aiming for. See the full neighborhood breakdown above.
What type of property performs best on Airbnb in Poljica Brig?
entire_home listings make up 100.0% of the active supply in Poljica Brig. The most common configuration does not always mean the most profitable — operators who identify underserved property types or bedroom counts can sometimes outperform the market average by filling a gap in local supply.
How does Poljica Brig compare to nearby Airbnb markets?
Among neighboring markets, Dugopolje posts $37,483 in average annual revenue with 52.3% occupancy, compared to Poljica Brig's $39,766 and 50.8%. Comparing nearby markets helps investors understand whether a destination's performance reflects local demand or broader regional trends.
When is the peak season for Airbnb in Poljica Brig?
August is the highest-revenue month in Poljica Brig, while March is the softest. The revenue spread between them indicates a highly seasonal market — revenue in the peak month is more than double the low month, so cash-flow planning and pricing automation are critical.
About AirROI Market Data
AirROI tracks over 20 million properties across 190+ countries and maintains 15+ years of historical performance data, making it one of the deepest Airbnb and STR intelligence platforms available. The analytics pipeline aggregates listing-level data monthly — revenue, occupancy, nightly rates, RevPAR, guest demographics, booking patterns, and competitive supply — so investors and operators can benchmark any market against its own history and against neighboring destinations.
Real estate investors, property managers, financial institutions, hedge funds, tourism boards, hospitality consultants, tech platforms, and academic researchers rely on AirROI data to underwrite acquisitions, optimize pricing, model macro trends, and conduct peer-reviewed research. Data is available through in-depth market reports like this one and the Airbnb API with 22 endpoints and an Airbnb MCP Server for AI agents.
AirROI proprietary analytics as of 2025-04-30. Metrics reflect trailing twelve-month aggregates from active listings. Revenue figures are market averages, not projections. Neighborhood descriptions are AI-generated and reviewed for accuracy. For full methodology, see the data methodology page.