Cogua, Cundinamarca Airbnb Market Data 2026: STR Report & Statistics
How much can you earn on Airbnb in Cogua, Cundinamarca? Based on AirROI's 2026 dataset (July 2025 – June 2026), the short answer is $2,302 per year — at a $70 nightly rate, 15.3% occupancy, and a $10 RevPAR that reflects a wider gap between nightly rates and realized revenue that rewards occupancy-focused strategies.
With just 21 active listings, Cogua is a micro-market where selective demand that rewards strong listing quality and pricing strategy. Supply grew 23.5% and nightly rates have risen, creating an environment where the most bookable listings stand to capture outsized share. Hosts who pair competitive pricing with strong guest experience are well-positioned to convert the growing traveler base into consistent bookings.
Regulation is high and 100% of listings show active registration — compliance is the cost of entry. In a market this size, differentiated listings with strong reviews can capture outsized returns relative to the competition.
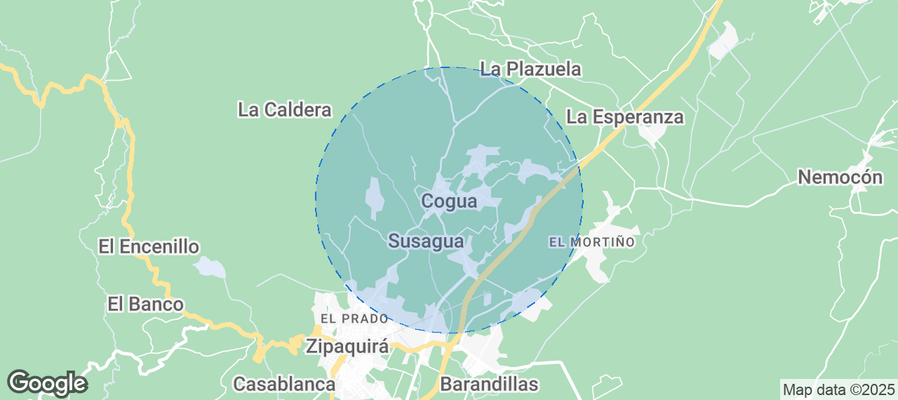
Table of Contents [hide] [show]
What Are the Key Airbnb Metrics in Cogua?
In Cogua, the headline Airbnb metrics are $2,302 in average annual revenue,15.3% occupancy, $70 ADR, and $10 in RevPAR, and guests book about 12 days in advance.
How Much Do Airbnb Hosts Earn Monthly in Cogua?
Understanding the monthly revenue variations for Airbnb listings in Cogua is key to maximizing your short term rental income potential. Seasonality significantly impacts earnings. Our analysis, based on data from the past 12 months, shows that the peak revenue month for STRs in Cogua is typically March, while May often presents the lowest earnings, highlighting opportunities for strategic pricing adjustments during shoulder and low seasons. Explore the typical Airbnb income in Cogua across different performance tiers:
- Best-in-class properties (Top 10%) achieve $1,057+ monthly, often utilizing dynamic pricing and superior guest experiences.
- Strong performing properties (Top 25%) earn $420 or more, indicating effective management and desirable locations/amenities.
- Typical properties (Median) generate around $207 per month, representing the average market performance.
- Entry-level properties (Bottom 25%) see earnings around $107, often with potential for optimization.
Average Monthly Airbnb Earnings Trend in Cogua
What Is the Monthly Airbnb Occupancy Rate in Cogua?
Maximize your bookings by understanding the Cogua STR occupancy trends. Seasonal demand shifts significantly influence how often properties are booked. Typically, Julysees the highest demand (peak season occupancy), while May experiences the lowest (low season). Effective strategies, like adjusting minimum stays or offering promotions, can boost occupancy during slower periods. Here's how different property tiers perform in Cogua:
- Best-in-class properties (Top 10%) achieve 47%+ occupancy, indicating high desirability and potentially optimized availability.
- Strong performing properties (Top 25%) maintain 22% or higher occupancy, suggesting good market fit and guest satisfaction.
- Typical properties (Median) have an occupancy rate around 10%.
- Entry-level properties (Bottom 25%) average 5% occupancy, potentially facing higher vacancy.
Average Monthly Occupancy Rate Trend in Cogua
What Is the Average Airbnb Nightly Rate in Cogua?
Effective short term rental pricing strategy in Cogua involves understanding monthly ADR fluctuations. The Average Daily Rate (ADR) for Airbnb in Cogua typically peaks in June and dips lowest during July. Leveraging Airbnb dynamic pricing tools or strategies based on this seasonality can significantly boost revenue. Here's a look at the typical nightly rates achieved:
- Best-in-class properties (Top 10%) command rates of $111+ per night, often due to premium features or locations.
- Strong performing properties (Top 25%) achieve nightly rates of $92 or more.
- Typical properties (Median) charge around $67 per night.
- Entry-level properties (Bottom 25%) earn around $51 per night.
Average Daily Rate (ADR) Trend by Month in Cogua
What Is the RevPAR for Airbnb in Cogua?
RevPAR in Cogua is currently $10. Because RevPAR combines nightly rates with realized occupancy, it is one of the cleanest ways to compare how efficiently listings turn demand into revenue across the market.
- Entry-level properties (Bottom 25%) see $5 RevPAR.
- Typical properties (Median) generate $7 RevPAR.
- Strong performers (Top 25%) earn $14 RevPAR.
- Best-in-class (Top 10%) achieve $15 RevPAR.
Average Monthly RevPAR Trend in Cogua
RevPAR Insights for Cogua
- The average RevPAR in Cogua is $10. This metric combines nightly rates with realized occupancy, making it one of the best single-number indicators of market efficiency.
- The gap between the top 10% ($15) and bottom 25% ($5) is $10, suggesting a relatively compressed market where operational differences yield moderate returns.
- RevPAR peaks in Mar and bottoms out in May, mirroring the broader seasonal demand pattern and suggesting opportunities for dynamic pricing.
Recommendations for Hosts
- Track your own RevPAR monthly against these Cogua benchmarks. If your RevPAR falls below the median of $7, examine whether low occupancy or low ADR is the primary drag.
- Top-quartile listings achieve $14+ RevPAR through a combination of competitive pricing, strong reviews, and strategic amenities. Target this tier through incremental improvements.
- Use RevPAR rather than revenue alone when comparing properties of different sizes — it normalizes for available nights and gives a more accurate picture of performance.
Get Live Cogua Market Intelligence 👇
Explore Real-time Analytics
When Is the Peak Season for Airbnb in Cogua?
Cogua's peak Airbnb season falls in March, June, August, while the softest stretch is February, May, September. Overall, the market shows highly seasonal trends requiring careful strategy, which should guide pricing, minimum stays, and cash-flow planning.
Peak Season (March, June, August)
- Revenue averages $465 per month
- Occupancy rates average 16.7%
- Daily rates average $76
Shoulder Season
- Revenue averages $359 per month
- Occupancy maintains around 19.3%
- Daily rates hold near $70
Low Season (February, May, September)
- Revenue drops to average $258 per month
- Occupancy decreases to average 11.8%
- Daily rates adjust to average $74
Seasonality Insights for Cogua
- Airbnb seasonality in Cogua is pronounced. Revenue swings sharply between peak and low months, which means pricing strategy, minimum-stay settings, and cash reserves all need to account for extended slower periods.
- During the high season, the absolute peak month showcases Cogua's highest earning potential, with monthly revenues climbing to $492, occupancy reaching 24.7%, and ADRs peaking at $83.
- Conversely, the slowest single month marks the market's lowest point — revenue may dip to $239, occupancy could drop to 9.4%, and ADRs may adjust to $66.
- Lower occupancy paired with meaningful seasonality means hosts in Cogua need to maximize every peak-season booking and seriously consider whether off-season pricing adjustments or minimum-stay changes can capture incremental revenue.
Seasonal Strategies for Maximizing Profit
- Peak Season: Maximize revenue through premium pricing. In a high-regulation market like Cogua, ensure your permit covers the number of nights you plan to book — some jurisdictions cap annual rental days.
- Low Season: Offer competitive pricing, extended-stay discounts, and flexible cancellation policies. Target off-season travelers like remote workers, budget-conscious guests, and travelers with flexible schedules.
- Shoulder Seasons: Implement dynamic pricing that bridges peak and low rates. Target weekend travelers, local events, and business visitors. Slightly more flexible terms than peak season can help maintain occupancy without deep discounting.
- In a highly seasonal market like Cogua, building a cash reserve during the top months is essential for covering fixed costs during the slow period. Automated pricing tools can help capture demand shifts in real time.
Do You Need a License for Airbnb in Cogua?
Yes, Cogua, Cundinamarca, Colombia enforces high STR regulations and 100% of active listings show registration evidence — indicating that enforcement is active and compliance is a prerequisite for operating legally. Hosts entering this market should budget for permit fees, inspections, and potential occupancy tax obligations as part of their startup costs. Always verify the latest short-term rental regulations and Airbnb license requirements directly with local government authorities for Cogua to ensure full compliance before hosting.
(Source: AirROI data, 2026, based on 100% licensed listings)
What Are the Best Neighborhoods for Airbnb in Cogua?
With a compact short-term rental market, Cogua gives early-mover hosts an advantage in the right neighborhoods. The areas listed below are where guest demand and local attractions converge — a useful lens for investors evaluating whether to enter this market and where to position their listing.
| Neighborhood / Area | Why Host Here? (Target Guests & Appeal) | Key Attractions & Landmarks |
|---|---|---|
| Centrala de Cogua | This area is known for its accessibility and convenience, making it a popular choice for tourists and locals alike. It has a mix of commercial and residential spaces, ideal for hosting guests. | Plaza de Mercado, Parroquia San Juan Bautista, Pueblo de Cogua, Cerro de las Tres Viejas, Parque Principal |
| Vereda La Palma | A serene and natural setting, perfect for guests looking to escape the hustle and bustle. This area offers beautiful views and a tranquil atmosphere, ideal for weekends and retreats. | Sendero ecológico, Mirador La Palma, Cascada del Indio, Finca El Encanto, Parque Natural Chicaque |
| Vereda La Cabaña | Known for its rural charm and proximity to nature, this area attracts visitors seeking a peaceful getaway. Popular among families and nature lovers. | Reserva Natural La Cabaña, Café la Palma, Cultivo de flores, Ruta ecológica, Mirador de La Cabaña |
| Pueblo de Cogua | The historical center of Cogua, featuring local culture and community spirit. A great place for tourists to experience the authentic Colombian lifestyle. | Iglesia San Juan Bautista, Plaza Principal, Caminos de la Historia, Cultura Local, Mercado Artesanal |
| Sector El Chorro | A picturesque area known for its natural beauty and outdoor activities. It's great for adventure tourism and guests looking for exploration. | Cascada El Chorro, Rutas de senderismo, Mirador El Chorro, Parque Ecológico, Zona de picnic |
| Vereda La Estancia | A tranquil and scenic location favored by those looking for a countryside escape. Great for romantic getaways or family gatherings. | Área de camping, Parque natural, Sendero ecológico, Río Cogua, Cabalgatas |
| Vereda San Rafael | Famous for its coffee plantations and scenic routes. Ideal for tourists interested in the coffee culture of Colombia. | Finca Cafetera, Recorridos cafetaleros, Cultura del café, Paisaje cultural, Café de altura |
| Embalse del Neusa | This artificial lake area is popular for water sports and picnics. A weekend hotspot for tourists and locals seeking leisure activities. | Deportes acuáticos, Senderos alrededor del embalse, Pesca deportiva, Áreas de descanso, Mirador del embalse |
Because Cogua has a high regulation profile, confirming that short-term rental permits are available in your target neighborhood is a critical first step before committing to a property purchase. Regulation can vary at the neighborhood or district level even within the same city.
What Types of Properties Are on Airbnb in Cogua?
Room Type Distribution
Property Type Distribution
Market Composition Insights for Cogua
- The Cogua Airbnb market composition is heavily skewed towards Entire Home/Apt listings, which make up 95.2% of the 21 active rentals. This indicates strong guest preference for privacy and space.
- Looking at the property type distribution in Cogua, Outdoor/Unique properties are the most common (52.4%), reflecting the local real estate landscape.
- Houses represent a significant 19% portion, catering likely to families or larger groups.
- The presence of 23.8% Hotel/Boutique listings indicates integration with traditional hospitality.
- Smaller segments like others (combined 4.8%) offer potential for unique stay experiences.
Cogua Airbnb Room Capacity Analysis (2026): Bedroom Distribution
Distribution of Listings by Number of Bedrooms
Room Capacity Insights for Cogua
- The dominant room capacity in Cogua is 1 bedroom listings, making up 66.7% of the market. This suggests a strong demand for properties suitable for couples or solo travelers.
- Together, 1 bedroom and 2 bedrooms properties represent 90.5% of the active Airbnb listings in Cogua, indicating a high concentration in these sizes.
- With over half the market (66.7%) consisting of studios or 1-bedroom units, Cogua is particularly well-suited for individuals or couples.
- Listings with 3+ bedrooms (9.5%) represent a smaller niche, potentially indicating an underserved market for larger group accommodations in Cogua.
Cogua Vacation Rental Guest Capacity Trends (2026)
Distribution of Listings by Guest Capacity
Guest Capacity Insights for Cogua
- The most common guest capacity trend in Cogua vacation rentals is listings accommodating 2 guests (33.3%). This suggests the primary traveler segment is likely couples or solo travelers.
- Properties designed for 2 guests and 3 guests dominate the Cogua STR market, accounting for 57.1% of listings.
- 14.4% of properties accommodate 6+ guests, serving the market segment for larger families or group travel in Cogua.
- On average, properties in Cogua are equipped to host 3.4 guests.
How Do Listings in Cogua Compare on Quality?
Listing quality in Cogua can be approximated through presentation depth, bedroom count, and how often hosts disclose exact locations. These signals show how professionally the local supply base is merchandised.
Listing Quality Insights for Cogua
- At 23.7 photos per listing on average, Cogua hosts invest well in visual presentation. Listings with 20+ photos consistently outperform in search ranking and conversion.
- 33.3% of listings show their exact location. Lower disclosure rates can increase booking hesitation — guests want to know exactly where they are staying.
Recommendations for Hosts
- Enable exact location if possible — it removes a common source of guest uncertainty and can improve your listing's position in map-based searches.
- Use these quality indicators as a self-audit checklist. Listings that exceed the Cogua averages across all three metrics are better positioned for premium pricing.
What Amenities Do Airbnb Guests Expect in Cogua?
Amenity Prevalence
Amenity Insights for Cogua
- Essential amenities in Cogua that guests expect include: Wifi, Pets allowed, Free parking on premises. Lacking these (any) could significantly impact bookings.
- Popular amenities like Dedicated workspace, BBQ grill, Kitchen are common but not universal. Offering these can provide a competitive edge.
Recommendations for Hosts
- Ensure your listing includes all essential amenities for Cogua: Wifi, Pets allowed, Free parking on premises.
- Prioritize adding missing essentials: Wifi, Pets allowed, Free parking on premises.
- Consider adding popular differentiators like Dedicated workspace or BBQ grill to increase appeal.
- Highlight unique or less common amenities you offer (e.g., hot tub, dedicated workspace, EV charger) in your listing description and photos.
- Regularly check competitor amenities in Cogua to stay competitive.
Which Airbnb Amenities Boost Revenue in Cogua?
Not every amenity matters equally. This table focuses on the amenities most associated with higher revenue in Cogua, which makes it more useful for prioritizing upgrades than a simple popularity list alone.
| Amenity | Prevalence | Revenue With | Revenue Without | Revenue Uplift |
|---|---|---|---|---|
Host greets you | 38.1% | $4,402 | $1,010 | 336.0% |
Clothing storage | 38.1% | $4,222 | $1,120 | 276.8% |
Bed linens | 57.1% | $3,258 | $1,027 | 217.2% |
First aid kit | 66.7% | $2,960 | $986 | 200.4% |
Extra pillows and blankets | 61.9% | $3,080 | $1,037 | 196.9% |
Board games | 47.6% | $3,373 | $1,328 | 153.9% |
Backyard | 61.9% | $2,990 | $1,184 | 152.6% |
Cooking basics | 76.2% | $2,681 | $1,088 | 146.5% |
Hot water | 76.2% | $2,681 | $1,088 | 146.5% |
Oven | 33.3% | $3,723 | $1,592 | 133.9% |
Revenue Impact Insights for Cogua
- Host greets you tops the revenue impact list with a 336.0% uplift — listings with this amenity earn $4,402 vs. $1,010 without it.
Recommendations for Hosts
- Focus your upgrade budget on amenities in the top half of this table. Below-median amenities may improve guest experience but contribute less to revenue growth.
- Highlight revenue-impacting amenities prominently in your listing title, photos, and description — guests can't value what they don't notice.
Dive Deeper: Advanced Cogua STR Market Data (2026)
Ready to unlock more insights? AirROI provides access to advanced metrics and comprehensive Airbnb data for Cogua. Explore detailed analytics beyond this report to refine your investment strategy, optimize pricing, and maximize your vacation rental profits.
Explore Advanced MetricsCogua Airbnb Guest Demographics & Profile Analysis (2026)
Guest Profile Summary for Cogua
- The typical guest profile for Airbnb in Cogua consists of primarily domestic travelers (89%), often arriving from nearby Bogotá, typically belonging to the Post-2000s (Gen Z/Alpha) group (50%), primarily speaking Spanish or English.
- Domestic travelers account for 89.3% of guests.
- Key international markets include Colombia (89.3%) and United States (2.7%).
- Top languages spoken are Spanish (59.1%) followed by English (34.8%).
- A significant demographic segment is the Post-2000s (Gen Z/Alpha) group, representing 50% of guests.
Recommendations for Hosts
- Target domestic marketing efforts towards travelers from Bogotá and Bogota.
- Tailor amenities and listing descriptions to appeal to the dominant Post-2000s (Gen Z/Alpha) demographic (e.g., highlight fast WiFi, smart home features, local guides).
- Highlight unique local experiences or amenities relevant to the primary guest profile.
- Consider seasonal promotions aligned with peak travel times for key origin markets.
What Are Airbnb Guest Ratings in Cogua?
Listings in Cogua average 4.84 out of 5 overall, with about 38.3 reviews per active listing and 42.9% of listings carrying the Guest Favorite badge.
Rating Breakdown by Category
Guest Rating Insights for Cogua
- With an overall rating of 4.84, Cogua listings meet an exceptionally high bar. Guests consistently report strong satisfaction, which drives repeat bookings and referral traffic.
- The strongest subcategory is Communication (4.92), while Check-in (4.73) trails behind — a useful signal for hosts looking to prioritize upgrades.
- 42.9% of listings carry the Guest Favorite badge, a strong trust signal that can meaningfully lift click-through and booking rates.
Recommendations for Hosts
- Focus improvement efforts on Check-in — even small gains in the weakest subcategory can lift overall ratings and search ranking.
- Encourage guests to leave reviews after checkout. Listings with more reviews rank higher in search results and convert browsers into bookers more effectively.
Cogua Airbnb Booking Patterns (2026): Available vs. Booked Days
Available Days Distribution
Booked Days Distribution
Booking Pattern Insights for Cogua
- The most common availability pattern in Cogua falls within the 271-366 days range, representing 85.7% of listings. This suggests many properties have significant open periods on their calendars.
- Approximately 100.0% of listings show high availability (181+ days open annually), indicating potential for increased bookings or specific owner usage patterns.
- For booked days, the 1-30 days range is most frequent in Cogua (57.1%), reflecting common guest stay durations or potential owner blocking patterns.
How Far in Advance Do Guests Book Airbnb in Cogua?
Average Booking Lead Time by Month
Booking Lead Time Insights for Cogua
- The overall average booking lead time for vacation rentals in Cogua is 12 days.
- Guests book furthest in advance for stays during December (average 16 days), likely coinciding with peak travel demand or local events.
- The shortest booking windows occur for stays in March (average 4 days), indicating more last-minute travel plans during this time.
- Seasonally, Winter (11 days avg.) sees the longest lead times, while Spring (5 days avg.) has the shortest, reflecting typical travel planning cycles.
Recommendations for Hosts
- Use the overall average lead time (12 days) as a baseline for your pricing and availability strategy in Cogua.
- During March, focus on last-minute booking availability and promotions, as guests book with very short notice (4 days avg.).
- Target marketing efforts for the Winter season well in advance (at least 11 days) to capture early planners.
- Monitor your own booking lead times against these Cogua averages to identify opportunities for dynamic pricing adjustments.
What Is the Average Length of Stay for Airbnb in Cogua?
Guests in Cogua stay about 2.8 nights on average, generating roughly 108 reservations and 5.4 bookings per listing in the latest AirROI dataset. The most common check-in time is 3:00 PM and check-out is 1:00 PM.
Monthly Length of Stay in Cogua
Check-in Time Distribution
Check-out Time Distribution
Stay Pattern Insights for Cogua
- Very short stays drive high turnover. Cleaning costs, consumable restocking, and check-in coordination become significant operational factors at this frequency.
- Stay lengths peak in Jul (5.3 nights) and shorten in Feb (1.1 nights). Adjust minimum-night requirements seasonally to match.
Recommendations for Hosts
- With shorter average stays, focus on streamlining turnover. Self-check-in, reliable cleaning crews, and pre-staged amenities can reduce per-booking operational costs.
- Set your check-in time to match or beat the market standard of 3:00 PM. Offering early check-in flexibility can be a low-cost differentiator.
- Monitor length-of-stay seasonality to adjust minimum-night requirements — longer minimums during peak periods maximize revenue while shorter minimums fill gaps in shoulder seasons.
Cogua Airbnb Minimum Stay Requirements Analysis
Distribution of Listings by Minimum Night Requirement
1 Night
20 listings
95.2% of total
2 Nights
1 listings
4.8% of total
Key Insights
- The most prevalent minimum stay requirement in Cogua is 1 Night, adopted by 95.2% of listings. This highlights the market's preference for shorter, flexible bookings.
- A strong majority (100.0%) of the Cogua Airbnb data shows acceptance of very short stays (1-2 nights), indicating a dynamic, high-turnover market.
Recommendations
- Align with the market by considering a 1 Night minimum stay, as 95.2% of Cogua hosts use this setting.
- Adjust minimum nights based on seasonality – potentially shorter during low season and longer during peak demand periods in Cogua.
Cogua Airbnb Cancellation Policy Trends Analysis (2026)
Limited
1 listings
4.8% of total
Flexible
7 listings
33.3% of total
Moderate
11 listings
52.4% of total
Firm
2 listings
9.5% of total
Cancellation Policy Insights for Cogua
- The prevailing Airbnb cancellation policy trend in Cogua is Moderate, used by 52.4% of listings.
- The market strongly favors guest-friendly terms, with 85.7% of listings offering Flexible or Moderate policies. This suggests guests in Cogua may expect booking flexibility.
Recommendations for Hosts
- Consider adopting a Moderate policy to align with the 52.4% market standard in Cogua.
- Regularly review your cancellation policy against competitors and market demand shifts in Cogua.
How Much Are Airbnb Cleaning Fees in Cogua?
Cleaning fees in Cogua are meaningful operating levers, not just pass-through charges. What matters most is how often hosts charge them, how high they run relative to market norms, and how large a share of gross revenue they consume.
Cleaning Fee Insights for Cogua
- About 47.6% of Cogua listings charge a cleaning fee — a mixed market where some hosts absorb the cost into nightly rates while others break it out.
- The average cleaning fee of $11 is close to the median ($10), suggesting a relatively consistent fee structure across the market.
- Cleaning fees represent 3.2% of gross revenue on average — a modest component of the overall booking price.
Recommendations for Hosts
- Price your cleaning fee competitively against the Cogua median of $10. Fees significantly above market norms can deter bookings, especially for shorter stays.
- Monitor competitor cleaning fees regularly. Airbnb's search algorithm factors in total price, so a well-calibrated cleaning fee can improve your listing's ranking.
What Do the Top Airbnb Listings in Cogua Look Like?
Benchmark your potential! Explore examples of top-performing Airbnb properties in Coguabased on Trailing Twelve Month (TTM) revenue. Analyze their characteristics, revenue, occupancy rate, and ADR to understand what drives success in this market.
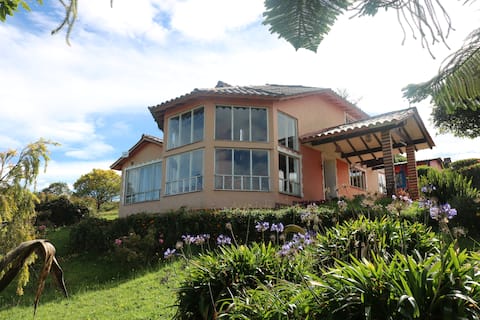
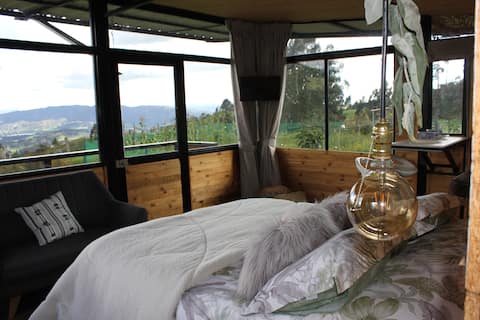
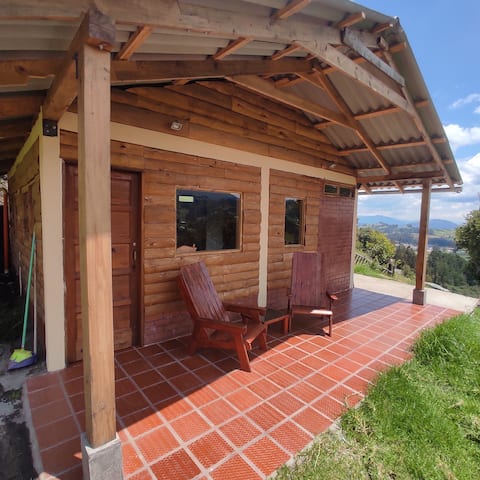
Beautiful cabin with mountain views RNT.118410
Entire Place • 3 bedrooms
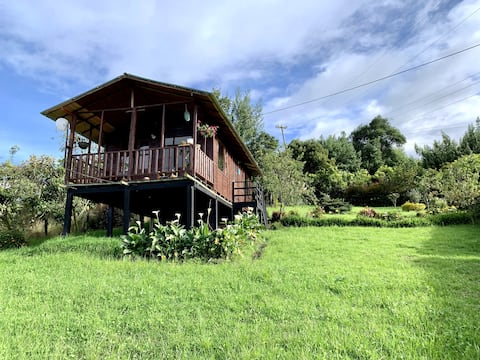
Beautiful little cabin near Neusa
Entire Place • 1 bedroom
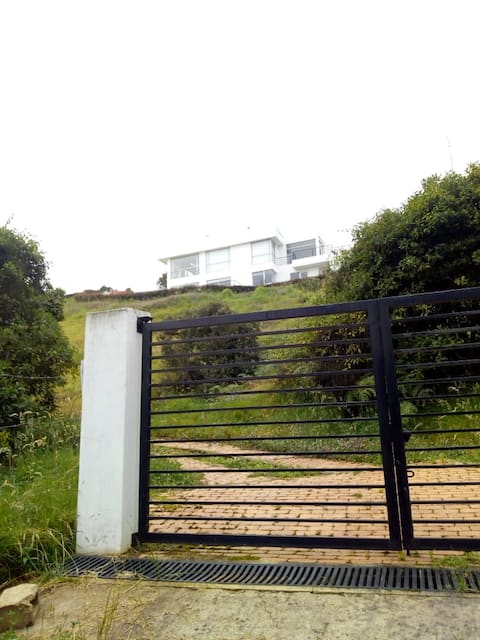
The entire White House for 2 people.
Entire Place • 1 bedroom

Wake up with nature
Entire Place • 1 bedroom
More than a cabin, a transformative experience
Entire Place • 1 bedroom
A nice cabin to enjoy nature
Entire Place • 2 bedrooms
Note: Performance varies based on location, size, amenities, seasonality, and management quality. Data reflects the past 12 months.
Who Are the Top Airbnb Hosts in Cogua?
Learn from the best! This table showcases top-performing Airbnb hosts in Cogua based on the number of properties managed and estimated total revenue over the past year. Analyze their scale and performance metrics.
| Host Name | Properties | Grossing Revenue | Stay Reviews | Avg Rating |
|---|---|---|---|---|
| Alexandra | 1 | $16,556 | 55 | 4.93/5.0 |
| Diego | 1 | $5,565 | 48 | 4.90/5.0 |
| Manuel | 2 | $4,169 | 33 | 4.95/5.0 |
| Myriam | 2 | $3,845 | 57 | 4.74/5.0 |
| Martha | 1 | $3,060 | 46 | 5.00/5.0 |
| Jorge | 4 | $2,822 | 157 | 4.81/5.0 |
| Gus | 1 | $2,601 | 54 | 5.00/5.0 |
| Camilo | 1 | $2,600 | 133 | 4.90/5.0 |
| Laura Melissa | 1 | $2,330 | 39 | 4.97/5.0 |
| Iván | 1 | $1,269 | 50 | 4.76/5.0 |
Analyzing the strategies of top hosts, such as their property selection, pricing, and guest communication, can offer valuable lessons for optimizing your own Airbnb operations in Cogua.
Who Are the Airbnb Hosts in Cogua?
Cogua has a relatively balanced host base.
Host Profile Insights for Cogua
- A 42.9% Superhost share is healthy — enough experienced operators to anchor quality without making the market impenetrable for newcomers.
- 4.8% of listings have Instant Book enabled. Lower Instant Book adoption means many guests must request approval, which can slow conversions.
- 76.2% of listings use Airbnb's simplified pricing (host-only fee), where the host pays the entire platform service fee and the guest sees one all-in price with no separate Airbnb service charge. High adoption signals a professional, PMS-connected host base — Airbnb mandates simplified pricing for software-connected listings.
Recommendations for Hosts
- Earning Superhost status can significantly improve search ranking and guest trust. Focus on maintaining high response rates, low cancellations, and strong reviews.
- Consider enabling Instant Book — it reduces booking friction and Airbnb's algorithm tends to favor Instant Book listings in search results.
- With 38.1% cohosted listings, there may be a growing local market for property management services.
- Benchmark your host metrics against these Cogua averages regularly and adjust your hosting strategy based on what top performers do differently.
How Does Cogua's Airbnb Market Compare to Nearby Cities?
How does the Cogua Airbnb market stack up against its neighbors? Compare key performance metrics like average monthly revenue, ADR, and occupancy rates in surrounding areas to understand the broader regional STR landscape.
Compared with Anapoima, Cogua has 9 percentage points lower occupancy and about $230 lower ADR. That helps frame whether this market is winning more on demand, pricing, or both.
| Market | Active Properties | Monthly Revenue | Daily Rate | Avg. Occupancy |
|---|---|---|---|---|
| Anapoima | 332 | $1,674 | $299.56 | 24% |
| Apulo | 115 | $1,454 | $279.64 | 22% |
| Cundinamarca | 12 | $1,231 | $213.09 | 19% |
| El Rosal | 10 | $1,223 | $211.69 | 23% |
| Nilo | 81 | $1,142 | $265.67 | 21% |
| Quebradanegra | 26 | $904 | $207.66 | 20% |
| El Imperio | 17 | $834 | $227.81 | 18% |
| Villeta | 428 | $784 | $186.05 | 21% |
| Nocaima | 77 | $782 | $193.72 | 18% |
| Nimaima | 43 | $751 | $185.75 | 22% |
Frequently Asked Questions About Airbnb in Cogua
These quick answers summarize the most common investor and operator questions using AirROI's latest market data for Cogua.
How much do Airbnb hosts make in Cogua?
Cogua hosts earn about $2,302 per year on average, with an average nightly rate of $70 and RevPAR of $10. Those figures describe the typical revenue environment for active listings in Cogua, Cundinamarca, not the ceiling for the best operators. Source: AirROI 2026 data, Cogua market, July 2025 to June 2026.
What is the average Airbnb occupancy rate in Cogua?
The average Airbnb occupancy rate in Cogua is 15.3%. March is the strongest month and May is the softest, so hosts should expect demand to move meaningfully throughout the year rather than stay flat.
What is the average Airbnb daily rate in Cogua?
Listings in Cogua average $70 per night. The broader pricing spread also matters: lower-performing listings cluster closer to the lower quartiles, while premium homes can price materially above the city average when demand spikes or listing quality stands out.
How many Airbnb listings are active in Cogua?
Cogua currently has about 21 active Airbnb listings in AirROI's market dataset. That supply count helps explain how competitive the market is, how much depth there is for benchmarking, and whether the market behaves like a niche destination or a scaled urban market.
How strict are short-term rental regulations in Cogua?
AirROI currently classifies the short-term rental regulation level in Cogua as High. The dataset also shows about 100.0% of listings with registration evidence. That is a market signal, not legal advice, so hosts should still confirm current licensing and compliance rules locally before listing.
What is the RevPAR for Airbnb in Cogua?
RevPAR in Cogua is about $10. That metric combines pricing and occupancy into one efficiency number, so it is often a better quick benchmark than ADR alone when investors want to compare how well listings convert nightly rates into realized revenue.
Is Airbnb profitable in Cogua?
Occupancy of 15.3% means Cogua is a more selective market. Profitability is achievable but requires careful cost management, premium positioning, or targeting longer stays to reduce turnover. Average annual revenue is $2,302, but individual returns depend on property type, location within the city, and the host's operating efficiency.
How far in advance do guests book Airbnb in Cogua?
The average booking lead time in Cogua is about 12 days — a relatively short booking window, meaning most guests decide within a few weeks of their trip — dynamic pricing can capture late demand. Hosts who understand their market's booking cadence can adjust minimum stays and pricing windows accordingly.
What are the best neighborhoods for Airbnb in Cogua?
Based on AirROI's analysis, some of the top neighborhoods for short-term rentals in Cogua include Centrala de Cogua, Vereda La Palma, Vereda La Cabaña. Each area attracts different guest profiles — from business travelers to leisure visitors — so the best location depends on the property type and target audience a host is aiming for. See the full neighborhood breakdown above.
What type of property performs best on Airbnb in Cogua?
entire_home listings make up 95.2% of the active supply in Cogua. The most common configuration does not always mean the most profitable — operators who identify underserved property types or bedroom counts can sometimes outperform the market average by filling a gap in local supply.
How does Cogua compare to nearby Airbnb markets?
Among neighboring markets, Anapoima posts $20,087 in average annual revenue with 24.4% occupancy, compared to Cogua's $2,302 and 15.3%. Comparing nearby markets helps investors understand whether a destination's performance reflects local demand or broader regional trends.
What is the average length of stay in Cogua?
The average Airbnb stay length in Cogua is about 2.8 nights. That matters for turnover, cleaning operations, and pricing strategy because shorter stays increase changeovers while longer stays can smooth occupancy and reduce operational friction.
What is the average Airbnb guest rating in Cogua?
Airbnb listings in Cogua average 4.84 out of 5 overall. About 42.9% of listings carry the guest favorite badge, which suggests a meaningful share of inventory is competing on review quality rather than price alone.
Which amenities boost Airbnb revenue in Cogua?
Host greets you and Clothing storage are among the strongest revenue-linked amenities in Cogua. In AirROI's latest dataset, listings with these amenities outperform those without on average revenue, which makes amenities analysis useful for prioritizing investment and listing upgrades.
Do Airbnb hosts charge cleaning fees in Cogua?
Yes. About 47.6% of active Airbnb listings in Cogua charge a cleaning fee, and the average fee is $11. The more important operating benchmark is how much of gross revenue that fee consumes, not just the absolute dollar amount.
What percentage of Airbnb hosts are Superhosts in Cogua?
A 42.9% Superhost rate signals a highly competitive market where review quality and responsiveness are table stakes, not differentiators.
About AirROI Market Data
AirROI tracks over 20 million properties across 190+ countries and maintains 15+ years of historical performance data, making it one of the deepest Airbnb and STR intelligence platforms available. The analytics pipeline aggregates listing-level data monthly — revenue, occupancy, nightly rates, RevPAR, guest demographics, booking patterns, and competitive supply — so investors and operators can benchmark any market against its own history and against neighboring destinations.
Real estate investors, property managers, financial institutions, hedge funds, tourism boards, hospitality consultants, tech platforms, and academic researchers rely on AirROI data to underwrite acquisitions, optimize pricing, model macro trends, and conduct peer-reviewed research. Data is available through in-depth market reports like this one and the Airbnb API with 22 endpoints and an Airbnb MCP Server for AI agents.
AirROI proprietary analytics as of 2026-06-30. Metrics reflect trailing twelve-month aggregates from active listings. Revenue figures are market averages, not projections. Neighborhood descriptions are AI-generated and reviewed for accuracy. For full methodology, see the data methodology page.