Aguas Dulces Airbnb Market Analysis 2026: Short Term Rental Data & Vacation Rental Statistics in Rocha, Uruguay
Is Airbnb profitable in Aguas Dulces in 2026? Explore comprehensive Airbnb analytics for Aguas Dulces, Rocha, Uruguay to uncover income potential. This 2026 STR market report for Aguas Dulces, based on AirROI data from February 2025 to January 2026, reveals key trends in the niche market of 113 active listings.
Whether you're considering an Airbnb investment in Aguas Dulces, optimizing your existing vacation rental, or exploring rental arbitrage opportunities, understanding the Aguas Dulces Airbnb data is crucial. Leveraging the low regulation environment is key to maximizing your short term rental income potential. Let's dive into the specifics.
Key Aguas Dulces Airbnb Performance Metrics Overview
Monthly Airbnb Revenue Variations & Income Potential in Aguas Dulces (2026)
Understanding the monthly revenue variations for Airbnb listings in Aguas Dulces is key to maximizing your short term rental income potential. Seasonality significantly impacts earnings. Our analysis, based on data from the past 12 months, shows that the peak revenue month for STRs in Aguas Dulces is typically January, while May often presents the lowest earnings, highlighting opportunities for strategic pricing adjustments during shoulder and low seasons. Explore the typical Airbnb income in Aguas Dulces across different performance tiers:
- Best-in-class properties (Top 10%) achieve $966+ monthly, often utilizing dynamic pricing and superior guest experiences.
- Strong performing properties (Top 25%) earn $568 or more, indicating effective management and desirable locations/amenities.
- Typical properties (Median) generate around $288 per month, representing the average market performance.
- Entry-level properties (Bottom 25%) see earnings around $135, often with potential for optimization.
Average Monthly Airbnb Earnings Trend in Aguas Dulces
Aguas Dulces Airbnb Occupancy Rate Trends (2026)
Maximize your bookings by understanding the Aguas Dulces STR occupancy trends. Seasonal demand shifts significantly influence how often properties are booked. Typically, Februarysees the highest demand (peak season occupancy), while May experiences the lowest (low season). Effective strategies, like adjusting minimum stays or offering promotions, can boost occupancy during slower periods. Here's how different property tiers perform in Aguas Dulces:
- Best-in-class properties (Top 10%) achieve 42%+ occupancy, indicating high desirability and potentially optimized availability.
- Strong performing properties (Top 25%) maintain 28% or higher occupancy, suggesting good market fit and guest satisfaction.
- Typical properties (Median) have an occupancy rate around 14%.
- Entry-level properties (Bottom 25%) average 7% occupancy, potentially facing higher vacancy.
Average Monthly Occupancy Rate Trend in Aguas Dulces
Average Daily Rate (ADR) Airbnb Trends in Aguas Dulces (2026)
Effective short term rental pricing strategy in Aguas Dulces involves understanding monthly ADR fluctuations. The Average Daily Rate (ADR) for Airbnb in Aguas Dulces typically peaks in January and dips lowest during April. Leveraging Airbnb dynamic pricing tools or strategies based on this seasonality can significantly boost revenue. Here's a look at the typical nightly rates achieved:
- Best-in-class properties (Top 10%) command rates of $104+ per night, often due to premium features or locations.
- Strong performing properties (Top 25%) achieve nightly rates of $82 or more.
- Typical properties (Median) charge around $62 per night.
- Entry-level properties (Bottom 25%) earn around $48 per night.
Average Daily Rate (ADR) Trend by Month in Aguas Dulces
Get Live Aguas Dulces Market Intelligence 👇

Explore Real-time Analytics
Airbnb Seasonality Analysis & Trends in Aguas Dulces (2026)
Peak Season (January, February, December)
- Revenue averages $737 per month
- Occupancy rates average 32.5%
- Daily rates average $73
Shoulder Season
- Revenue averages $341 per month
- Occupancy maintains around 17.2%
- Daily rates hold near $67
Low Season (May, June, September)
- Revenue drops to average $237 per month
- Occupancy decreases to average 13.2%
- Daily rates adjust to average $66
Seasonality Insights for Aguas Dulces
- The Airbnb seasonality in Aguas Dulces shows highly seasonal trends requiring careful strategy. While the sections above show seasonal averages, it's also insightful to look at the extremes:
- During the high season, the absolute peak month showcases Aguas Dulces's highest earning potential, with monthly revenues capable of climbing to $865, occupancy reaching a high of 42.0%, and ADRs peaking at $77.
- Conversely, the slowest single month of the year, typically falling within the low season, marks the market's lowest point. In this month, revenue might dip to $225, occupancy could drop to 10.2%, and ADRs may adjust down to $65.
- Understanding both the seasonal averages and these monthly peaks and troughs in revenue, occupancy, and ADR is crucial for maximizing your Airbnb profit potential in Aguas Dulces.
Seasonal Strategies for Maximizing Profit
- Peak Season: Maximize revenue through premium pricing and potentially longer minimum stays. Ensure high availability.
- Low Season: Offer competitive pricing, special promotions (e.g., extended stay discounts), and flexible cancellation policies. Target off-season travelers like remote workers or budget-conscious guests.
- Shoulder Seasons: Implement dynamic pricing that balances peak and low rates. Target weekend travelers or specific events. Offer slightly more flexible terms than peak season.
- Regularly analyze your own performance against these Aguas Dulces seasonality benchmarks and adjust your pricing and availability strategy accordingly.
Best Areas for Airbnb Investment in Aguas Dulces (2026)
Exploring the top neighborhoods for short-term rentals in Aguas Dulces? This section highlights key areas, outlining why they are attractive for hosts and guests, along with notable local attractions. Consider these locations based on your target guest profile and investment strategy.
| Neighborhood / Area | Why Host Here? (Target Guests & Appeal) | Key Attractions & Landmarks |
|---|---|---|
| Playa Aguas Dulces | A peaceful and beautiful beach area known for its stunning sunsets and relaxed atmosphere. Ideal for families and travelers looking to unwind by the sea. | Aguas Dulces Beach, Laguna de Rocha, local seafood restaurants, artisanal markets, water sports activities |
| Pueblo Aguas Dulces | The charming village atmosphere provides a unique cultural experience with local shops and hospitality. Great for visitors who enjoy local culture and traditions. | Pueblo Center, local art galleries, craft shops, cultural festivals, community events |
| Las Manojos | A lesser-known beach area that offers seclusion and tranquility, perfect for nature lovers and those seeking an escape from crowded tourist spots. | Las Manojos Beach, wildlife and nature walks, secluded picnic spots, fishing areas, scenic views |
| Rocha | The capital of the Rocha department, offering more urban experiences and convenient access to various amenities, restaurants, and attractions. | Rocha City Center, Historical buildings, local markets, Cultural Center, restaurants and cafes |
| Barra de Valizas | Known for its stunning natural beauty and untouched beaches. Popular with eco-tourists and those who enjoy outdoor activities. | Barra de Valizas Beach, dunes and lagoons, hiking trails, fishing spots, observing local wildlife |
| Cabo Polonio | A unique destination known for its lack of electricity and a focus on nature. Ideal for those looking for a unique getaway experience. | Cabo Polonio Beach, lighthouse, national park, sea lions, tranquil environment |
| Punta del Diablo | A popular bohemian beach town that attracts travelers seeking a vibrant community and lively atmosphere, with plenty of activities. | Punta del Diablo Beach, local surf spots, bars and nightlife, artisanal shops, fishing pier |
| La Paloma | A well-known beach resort town with more extensive amenities, catering to families and beachgoers looking for convenience and fun. | La Paloma Beach, local restaurants, markets, water activities, nightlife |
Understanding Airbnb License Requirements & STR Laws in Aguas Dulces (2026)
While Aguas Dulces, Rocha, Uruguay currently shows low STR regulations, specific Airbnb license requirements might still exist or change. Always verify the latest short term rental regulations and Airbnb license requirements directly with local government authorities for Aguas Dulces to ensure full compliance before hosting.
(Source: AirROI data, 2026, finding no licensed listings among those analyzed)
Top Performing Airbnb Properties in Aguas Dulces (2026)
Benchmark your potential! Explore examples of top-performing Airbnb properties in Aguas Dulcesbased on Trailing Twelve Month (TTM) revenue. Analyze their characteristics, revenue, occupancy rate, and ADR to understand what drives success in this market.
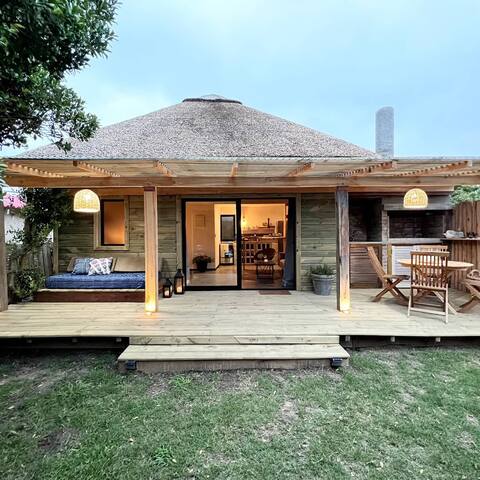
Apartment Los Quinchos with private garden.
Entire Place • 1 bedroom
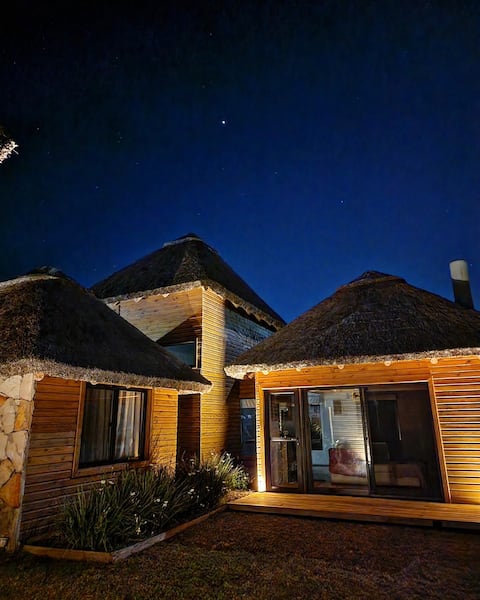
Comfortable cabin. Quinchos with barbecue.
Entire Place • 2 bedrooms

Beautiful house by the sea in Aguas Dulces
Entire Place • 3 bedrooms

Cozy, bright, with enjoyable galleries!
Entire Place • 3 bedrooms
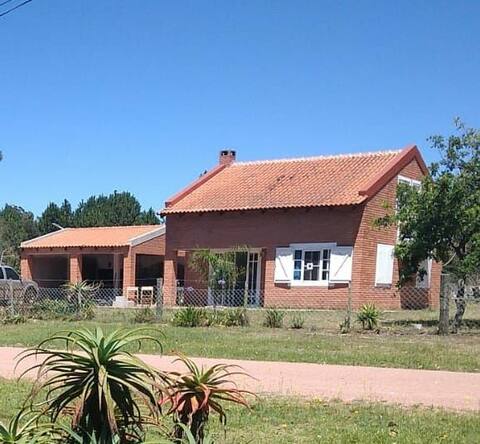
Casa Linda
Entire Place • 3 bedrooms

La Martinga Cabin, Aguas Dulces
Entire Place • 3 bedrooms
Note: Performance varies based on location, size, amenities, seasonality, and management quality. Data reflects the past 12 months.
Top Performing Airbnb Hosts in Aguas Dulces (2026)
Learn from the best! This table showcases top-performing Airbnb hosts in Aguas Dulces based on the number of properties managed and estimated total revenue over the past year. Analyze their scale and performance metrics.
| Host Name | Properties | Grossing Revenue | Stay Reviews | Avg Rating |
|---|---|---|---|---|
| Luis Eduardo | 2 | $23,234 | 102 | 4.98/5.0 |
| Complejo Arinos | 10 | $15,736 | 197 | 4.49/5.0 |
| Tabaré | 10 | $11,065 | 55 | 4.45/5.0 |
| Aguas | 2 | $8,888 | 18 | 5.00/5.0 |
| Mage | 1 | $8,160 | 5 | 5.00/5.0 |
| Maria | 1 | $7,456 | 17 | 4.94/5.0 |
| Corina | 1 | $6,540 | 1 | Not Rated |
| Maria Noel | 3 | $6,397 | 60 | 4.75/5.0 |
| Lucía | 1 | $6,254 | 17 | 4.35/5.0 |
| Lucia | 2 | $6,151 | 8 | 4.57/5.0 |
Analyzing the strategies of top hosts, such as their property selection, pricing, and guest communication, can offer valuable lessons for optimizing your own Airbnb operations in Aguas Dulces.
Dive Deeper: Advanced Aguas Dulces STR Market Data (2026)
Ready to unlock more insights? AirROI provides access to advanced metrics and comprehensive Airbnb data for Aguas Dulces. Explore detailed analytics beyond this report to refine your investment strategy, optimize pricing, and maximize your vacation rental profits.
Explore Advanced MetricsAguas Dulces Short-Term Rental Market Composition (2026): Property & Room Types
Room Type Distribution
Property Type Distribution
Market Composition Insights for Aguas Dulces
- The Aguas Dulces Airbnb market composition is heavily skewed towards Entire Home/Apt listings, which make up 97.3% of the 113 active rentals. This indicates strong guest preference for privacy and space.
- Looking at the property type distribution in Aguas Dulces, House properties are the most common (61.1%), reflecting the local real estate landscape.
- Houses represent a significant 61.1% portion, catering likely to families or larger groups.
- Smaller segments like hotel/boutique, unique stays (combined 2.7%) offer potential for unique stay experiences.
Aguas Dulces Airbnb Room Capacity Analysis (2026): Bedroom Distribution
Distribution of Listings by Number of Bedrooms
Room Capacity Insights for Aguas Dulces
- The dominant room capacity in Aguas Dulces is 1 bedroom listings, making up 36.3% of the market. This suggests a strong demand for properties suitable for couples or solo travelers.
- Together, 1 bedroom and 2 bedrooms properties represent 70.8% of the active Airbnb listings in Aguas Dulces, indicating a high concentration in these sizes.
Aguas Dulces Vacation Rental Guest Capacity Trends (2026)
Distribution of Listings by Guest Capacity
Guest Capacity Insights for Aguas Dulces
- The most common guest capacity trend in Aguas Dulces vacation rentals is listings accommodating 4 guests (31.9%). This suggests the primary traveler segment is likely small families or groups.
- Properties designed for 4 guests and 5 guests dominate the Aguas Dulces STR market, accounting for 47.8% of listings.
- 21.3% of properties accommodate 6+ guests, serving the market segment for larger families or group travel in Aguas Dulces.
- On average, properties in Aguas Dulces are equipped to host 4.2 guests.
Aguas Dulces Airbnb Booking Patterns (2026): Available vs. Booked Days
Available Days Distribution
Booked Days Distribution
Booking Pattern Insights for Aguas Dulces
- The most common availability pattern in Aguas Dulces falls within the 271-366 days range, representing 99.1% of listings. This suggests many properties have significant open periods on their calendars.
- Approximately 100.0% of listings show high availability (181+ days open annually), indicating potential for increased bookings or specific owner usage patterns.
- For booked days, the 1-30 days range is most frequent in Aguas Dulces (55.8%), reflecting common guest stay durations or potential owner blocking patterns.
Aguas Dulces Airbnb Minimum Stay Requirements Analysis
Distribution of Listings by Minimum Night Requirement
1 Night
29 listings
25.7% of total
2 Nights
15 listings
13.3% of total
3 Nights
11 listings
9.7% of total
4-6 Nights
24 listings
21.2% of total
7-29 Nights
4 listings
3.5% of total
30+ Nights
30 listings
26.5% of total
Key Insights
- The most prevalent minimum stay requirement in Aguas Dulces is 30+ Nights, adopted by 26.5% of listings. This highlights the market's preference for longer commitments.
- A significant segment (26.5%) caters to monthly stays (30+ nights) in Aguas Dulces, pointing to opportunities in the extended-stay market.
Recommendations
- Align with the market by considering a 30+ Nights minimum stay, as 26.5% of Aguas Dulces hosts use this setting.
- If feasible, allowing 1-night stays, especially midweek or during low season, could capture last-minute bookings, as only 25.7% currently do.
- Explore offering discounts for stays of 30+ nights to attract the 26.5% of the market seeking extended stays.
- Adjust minimum nights based on seasonality – potentially shorter during low season and longer during peak demand periods in Aguas Dulces.
Aguas Dulces Airbnb Cancellation Policy Trends Analysis (2026)
Limited
3 listings
2.7% of total
Flexible
29 listings
25.7% of total
Moderate
22 listings
19.5% of total
Firm
50 listings
44.2% of total
Strict
9 listings
8% of total
Cancellation Policy Insights for Aguas Dulces
- The prevailing Airbnb cancellation policy trend in Aguas Dulces is Firm, used by 44.2% of listings.
- A majority (52.2%) of hosts in Aguas Dulces utilize Firm or Strict policies, indicating a market where hosts prioritize booking security.
- Strict cancellation policies are quite rare (8%), potentially making listings with this policy less competitive unless justified by high demand or property type.
Recommendations for Hosts
- Consider adopting a Firm policy to align with the 44.2% market standard in Aguas Dulces.
- Using a Strict policy might deter some guests, as only 8% of listings use it. Evaluate if potential revenue protection outweighs possible lower booking rates.
- Regularly review your cancellation policy against competitors and market demand shifts in Aguas Dulces.
Aguas Dulces STR Booking Lead Time Analysis (2026)
Average Booking Lead Time by Month
Booking Lead Time Insights for Aguas Dulces
- The overall average booking lead time for vacation rentals in Aguas Dulces is 27 days.
- Guests book furthest in advance for stays during January (average 36 days), likely coinciding with peak travel demand or local events.
- The shortest booking windows occur for stays in September (average 8 days), indicating more last-minute travel plans during this time.
- Seasonally, Winter (31 days avg.) sees the longest lead times, while Summer (14 days avg.) has the shortest, reflecting typical travel planning cycles.
Recommendations for Hosts
- Use the overall average lead time (27 days) as a baseline for your pricing and availability strategy in Aguas Dulces.
- During September, focus on last-minute booking availability and promotions, as guests book with very short notice (8 days avg.).
- Target marketing efforts for the Winter season well in advance (at least 31 days) to capture early planners.
- Monitor your own booking lead times against these Aguas Dulces averages to identify opportunities for dynamic pricing adjustments.
Popular & Essential Airbnb Amenities in Aguas Dulces (2026)
Amenity Prevalence
Amenity Insights for Aguas Dulces
- Essential amenities in Aguas Dulces that guests expect include: Kitchen. Lacking these (this) could significantly impact bookings.
- Popular amenities like TV, Free parking on premises, Hot water are common but not universal. Offering these can provide a competitive edge.
- Warning: Wifi is not universally provided but is considered essential globally. Ensure reliable Wifi is offered.
Recommendations for Hosts
- Ensure your listing includes all essential amenities for Aguas Dulces: Kitchen.
- Prioritize adding missing essentials: Kitchen.
- Consider adding popular differentiators like TV or Free parking on premises to increase appeal.
- Highlight unique or less common amenities you offer (e.g., hot tub, dedicated workspace, EV charger) in your listing description and photos.
- Regularly check competitor amenities in Aguas Dulces to stay competitive.
Aguas Dulces Airbnb Guest Demographics & Profile Analysis (2026)
Guest Profile Summary for Aguas Dulces
- The typical guest profile for Airbnb in Aguas Dulces consists of primarily domestic travelers (71%), often arriving from nearby Montevideo, typically belonging to the Post-2000s (Gen Z/Alpha) group (50%), primarily speaking Spanish or English.
- Domestic travelers account for 70.5% of guests.
- Key international markets include Uruguay (70.5%) and Brazil (12.5%).
- Top languages spoken are Spanish (40.7%) followed by English (32.4%).
- A significant demographic segment is the Post-2000s (Gen Z/Alpha) group, representing 50% of guests.
Recommendations for Hosts
- Target domestic marketing efforts towards travelers from Montevideo and Porto Alegre.
- Tailor amenities and listing descriptions to appeal to the dominant Post-2000s (Gen Z/Alpha) demographic (e.g., highlight fast WiFi, smart home features, local guides).
- Highlight unique local experiences or amenities relevant to the primary guest profile.
- Consider seasonal promotions aligned with peak travel times for key origin markets.
Nearby Short-Term Rental Market Comparison
How does the Aguas Dulces Airbnb market stack up against its neighbors? Compare key performance metrics like average monthly revenue, ADR, and occupancy rates in surrounding areas to understand the broader regional STR landscape.
| Market | Active Properties | Monthly Revenue | Daily Rate | Avg. Occupancy |
|---|---|---|---|---|
| La Barra | 21 | $2,067 | $520.30 | 28% |
| Arenas de José Ignacio | 27 | $1,462 | $497.77 | 24% |
| San Rafael - El Placer | 121 | $1,397 | $390.47 | 26% |
| La Barra | 202 | $1,273 | $369.87 | 28% |
| José Ignacio | 239 | $1,273 | $368.04 | 27% |
| San Carlos | 23 | $1,196 | $184.62 | 27% |
| El Chorro | 75 | $1,091 | $288.10 | 27% |
| Manantiales | 99 | $1,079 | $320.35 | 28% |
| El Caracol | 13 | $1,040 | $200.95 | 30% |
| Villa Serrana | 131 | $1,031 | $104.76 | 34% |