Playa Grande Airbnb Market Analysis 2026: Short Term Rental Data & Vacation Rental Statistics in Maldonado, Uruguay
Is Airbnb profitable in Playa Grande in 2026? Explore comprehensive Airbnb analytics for Playa Grande, Maldonado, Uruguay to uncover income potential. This 2026 STR market report for Playa Grande, based on AirROI data from February 2025 to January 2026, reveals key trends in the niche market of 90 active listings.
Whether you're considering an Airbnb investment in Playa Grande, optimizing your existing vacation rental, or exploring rental arbitrage opportunities, understanding the Playa Grande Airbnb data is crucial. Leveraging the low regulation environment is key to maximizing your short term rental income potential. Let's dive into the specifics.
Key Playa Grande Airbnb Performance Metrics Overview
Monthly Airbnb Revenue Variations & Income Potential in Playa Grande (2026)
Understanding the monthly revenue variations for Airbnb listings in Playa Grande is key to maximizing your short term rental income potential. Seasonality significantly impacts earnings. Our analysis, based on data from the past 12 months, shows that the peak revenue month for STRs in Playa Grande is typically January, while August often presents the lowest earnings, highlighting opportunities for strategic pricing adjustments during shoulder and low seasons. Explore the typical Airbnb income in Playa Grande across different performance tiers:
- Best-in-class properties (Top 10%) achieve $1,559+ monthly, often utilizing dynamic pricing and superior guest experiences.
- Strong performing properties (Top 25%) earn $968 or more, indicating effective management and desirable locations/amenities.
- Typical properties (Median) generate around $532 per month, representing the average market performance.
- Entry-level properties (Bottom 25%) see earnings around $253, often with potential for optimization.
Average Monthly Airbnb Earnings Trend in Playa Grande
Playa Grande Airbnb Occupancy Rate Trends (2026)
Maximize your bookings by understanding the Playa Grande STR occupancy trends. Seasonal demand shifts significantly influence how often properties are booked. Typically, Februarysees the highest demand (peak season occupancy), while August experiences the lowest (low season). Effective strategies, like adjusting minimum stays or offering promotions, can boost occupancy during slower periods. Here's how different property tiers perform in Playa Grande:
- Best-in-class properties (Top 10%) achieve 55%+ occupancy, indicating high desirability and potentially optimized availability.
- Strong performing properties (Top 25%) maintain 36% or higher occupancy, suggesting good market fit and guest satisfaction.
- Typical properties (Median) have an occupancy rate around 20%.
- Entry-level properties (Bottom 25%) average 10% occupancy, potentially facing higher vacancy.
Average Monthly Occupancy Rate Trend in Playa Grande
Average Daily Rate (ADR) Airbnb Trends in Playa Grande (2026)
Effective short term rental pricing strategy in Playa Grande involves understanding monthly ADR fluctuations. The Average Daily Rate (ADR) for Airbnb in Playa Grande typically peaks in January and dips lowest during July. Leveraging Airbnb dynamic pricing tools or strategies based on this seasonality can significantly boost revenue. Here's a look at the typical nightly rates achieved:
- Best-in-class properties (Top 10%) command rates of $150+ per night, often due to premium features or locations.
- Strong performing properties (Top 25%) achieve nightly rates of $113 or more.
- Typical properties (Median) charge around $87 per night.
- Entry-level properties (Bottom 25%) earn around $67 per night.
Average Daily Rate (ADR) Trend by Month in Playa Grande
Get Live Playa Grande Market Intelligence 👇
Explore Real-time Analytics
Airbnb Seasonality Analysis & Trends in Playa Grande (2026)
Peak Season (January, February, December)
- Revenue averages $1,312 per month
- Occupancy rates average 41.1%
- Daily rates average $109
Shoulder Season
- Revenue averages $638 per month
- Occupancy maintains around 23.4%
- Daily rates hold near $100
Low Season (July, August, November)
- Revenue drops to average $434 per month
- Occupancy decreases to average 16.5%
- Daily rates adjust to average $100
Seasonality Insights for Playa Grande
- The Airbnb seasonality in Playa Grande shows highly seasonal trends requiring careful strategy. While the sections above show seasonal averages, it's also insightful to look at the extremes:
- During the high season, the absolute peak month showcases Playa Grande's highest earning potential, with monthly revenues capable of climbing to $1,622, occupancy reaching a high of 54.5%, and ADRs peaking at $113.
- Conversely, the slowest single month of the year, typically falling within the low season, marks the market's lowest point. In this month, revenue might dip to $332, occupancy could drop to 12.6%, and ADRs may adjust down to $99.
- Understanding both the seasonal averages and these monthly peaks and troughs in revenue, occupancy, and ADR is crucial for maximizing your Airbnb profit potential in Playa Grande.
Seasonal Strategies for Maximizing Profit
- Peak Season: Maximize revenue through premium pricing and potentially longer minimum stays. Ensure high availability.
- Low Season: Offer competitive pricing, special promotions (e.g., extended stay discounts), and flexible cancellation policies. Target off-season travelers like remote workers or budget-conscious guests.
- Shoulder Seasons: Implement dynamic pricing that balances peak and low rates. Target weekend travelers or specific events. Offer slightly more flexible terms than peak season.
- Regularly analyze your own performance against these Playa Grande seasonality benchmarks and adjust your pricing and availability strategy accordingly.
Best Areas for Airbnb Investment in Playa Grande (2026)
Exploring the top neighborhoods for short-term rentals in Playa Grande? This section highlights key areas, outlining why they are attractive for hosts and guests, along with notable local attractions. Consider these locations based on your target guest profile and investment strategy.
| Neighborhood / Area | Why Host Here? (Target Guests & Appeal) | Key Attractions & Landmarks |
|---|---|---|
| Playa Grande | A stunning beach destination that draws tourists looking for a relaxed, seaside experience. Known for its beautiful sunsets and water sports, making it ideal for vacation stays. | El Emir Beach, La Barra, Surfing spots, Natural beauty parks, Gastronomic options |
| La Barra | A vibrant area with a bohemian atmosphere, famous for its lively nightlife and artistic community. Attracts younger crowds and hip travelers seeking entertainment and culture. | La Barra Beach, Art galleries, Local bars and nightclubs, Gastronomy scene, Cultural events |
| José Ignacio | A luxurious beach resort town known for its upscale properties and celebrity visitors. Perfect for high-end Airbnb investments catering to wealthy clientele. | José Ignacio Beach, Bikini Beach, Gourmet restaurants, Lighthouse, Charming town square |
| Punta del Este | Famous for its glamorous and cosmopolitan ambiance. Offers a wealth of entertainment options and beautiful beaches, making it popular among international tourists. | Brava Beach, Casapueblo, Punta Shopping, Ralli Museum, Art and culture events |
| Manantiales | A chic beach area that combines relaxation with a trendy vibe. Popular among tourists looking for a mix of tranquility and upmarket amenities. | Manantiales Beach, Restaurants and cafes, Yoga and wellness retreats, Stunning coastal views, Surf spots |
| Maldonado | The city of Maldonado offers a blend of urban life with easy access to nearby beaches. It’s a convenient location for tourists who want to explore the region. | Maldonado's historical architecture, Markets and shopping, Cultural centers, Beautiful parks, Proximity to Punta del Este |
| Las Grutas | A hidden gem, offering a more secluded beach experience. Ideal for those looking to escape the more crowded tourist spots. | Secluded beaches, Natural landscapes, Wildlife watching, Peaceful ambiance, Local eateries |
| Rocha | Known for its unspoiled beaches and natural beauty. Attracts eco-tourists and those looking for adventure in nature. | Cabo Polonio, Valizas Beach, National parks, Diverse flora and fauna, Adventure tourism opportunities |
Understanding Airbnb License Requirements & STR Laws in Playa Grande (2026)
While Playa Grande, Maldonado, Uruguay currently shows low STR regulations, specific Airbnb license requirements might still exist or change. Always verify the latest short term rental regulations and Airbnb license requirements directly with local government authorities for Playa Grande to ensure full compliance before hosting.
(Source: AirROI data, 2026, based on 1% licensed listings)
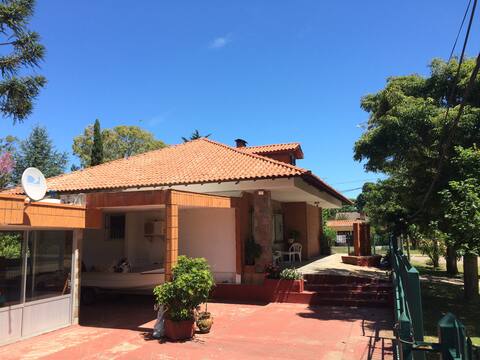
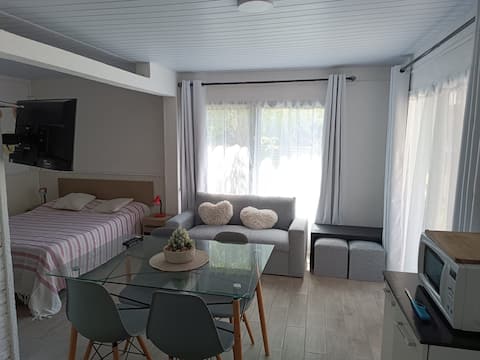
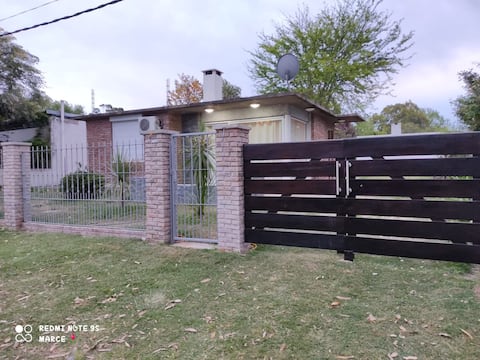
Top Performing Airbnb Properties in Playa Grande (2026)
Benchmark your potential! Explore examples of top-performing Airbnb properties in Playa Grandebased on Trailing Twelve Month (TTM) revenue. Analyze their characteristics, revenue, occupancy rate, and ADR to understand what drives success in this market.
El Paraiso
Entire Place • 4 bedrooms

House in Playa Grande
Entire Place • 3 bedrooms

Casa Clavelitos Nature: Tranquility:
Entire Place • 3 bedrooms
Comfortable apartment three blocks from the sea.
Entire Place • N/A

Cabin in Playa Grande
Entire Place • 2 bedrooms
House with Heated Pool Playa Grande
Entire Place • 1 bedroom
Note: Performance varies based on location, size, amenities, seasonality, and management quality. Data reflects the past 12 months.
Top Performing Airbnb Hosts in Playa Grande (2026)
Learn from the best! This table showcases top-performing Airbnb hosts in Playa Grande based on the number of properties managed and estimated total revenue over the past year. Analyze their scale and performance metrics.
| Host Name | Properties | Grossing Revenue | Stay Reviews | Avg Rating |
|---|---|---|---|---|
| Carlos | 8 | $48,725 | 179 | 4.88/5.0 |
| Karina | 1 | $29,321 | 72 | 4.88/5.0 |
| Laura | 6 | $20,538 | 138 | 4.89/5.0 |
| Natalia | 5 | $15,101 | 76 | 4.93/5.0 |
| Allinson | 1 | $15,044 | 3 | 5.00/5.0 |
| Luis | 2 | $14,331 | 212 | 4.91/5.0 |
| Lujan | 1 | $14,058 | 4 | 5.00/5.0 |
| Nancy | 1 | $12,601 | 56 | 4.95/5.0 |
| Patricia | 1 | $12,272 | 9 | 4.89/5.0 |
| Marcelo | 1 | $12,227 | 22 | 4.86/5.0 |
Analyzing the strategies of top hosts, such as their property selection, pricing, and guest communication, can offer valuable lessons for optimizing your own Airbnb operations in Playa Grande.
Dive Deeper: Advanced Playa Grande STR Market Data (2026)
Ready to unlock more insights? AirROI provides access to advanced metrics and comprehensive Airbnb data for Playa Grande. Explore detailed analytics beyond this report to refine your investment strategy, optimize pricing, and maximize your vacation rental profits.
Explore Advanced MetricsPlaya Grande Short-Term Rental Market Composition (2026): Property & Room Types
Room Type Distribution
Property Type Distribution
Market Composition Insights for Playa Grande
- The Playa Grande Airbnb market composition is heavily skewed towards Entire Home/Apt listings, which make up 94.4% of the 90 active rentals. This indicates strong guest preference for privacy and space.
- Looking at the property type distribution in Playa Grande, House properties are the most common (74.4%), reflecting the local real estate landscape.
- Houses represent a significant 74.4% portion, catering likely to families or larger groups.
- Smaller segments like hotel/boutique, others (combined 7.7%) offer potential for unique stay experiences.
Playa Grande Airbnb Room Capacity Analysis (2026): Bedroom Distribution
Distribution of Listings by Number of Bedrooms
Room Capacity Insights for Playa Grande
- The dominant room capacity in Playa Grande is 2 bedrooms listings, making up 44.4% of the market. This suggests a strong demand for properties suitable for couples or solo travelers.
- Together, 2 bedrooms and 1 bedroom properties represent 73.3% of the active Airbnb listings in Playa Grande, indicating a high concentration in these sizes.
Playa Grande Vacation Rental Guest Capacity Trends (2026)
Distribution of Listings by Guest Capacity
Guest Capacity Insights for Playa Grande
- The most common guest capacity trend in Playa Grande vacation rentals is listings accommodating 4 guests (42.2%). This suggests the primary traveler segment is likely small families or groups.
- Properties designed for 4 guests and 5 guests dominate the Playa Grande STR market, accounting for 58.9% of listings.
- 24.4% of properties accommodate 6+ guests, serving the market segment for larger families or group travel in Playa Grande.
- On average, properties in Playa Grande are equipped to host 4.5 guests.
Playa Grande Airbnb Booking Patterns (2026): Available vs. Booked Days
Available Days Distribution
Booked Days Distribution
Booking Pattern Insights for Playa Grande
- The most common availability pattern in Playa Grande falls within the 271-366 days range, representing 90% of listings. This suggests many properties have significant open periods on their calendars.
- Approximately 96.7% of listings show high availability (181+ days open annually), indicating potential for increased bookings or specific owner usage patterns.
- For booked days, the 31-90 days range is most frequent in Playa Grande (47.8%), reflecting common guest stay durations or potential owner blocking patterns.
- A notable 3.3% of properties secure long booking periods (181+ days booked per year), highlighting successful long-term rental strategies or significant owner usage.
Playa Grande Airbnb Minimum Stay Requirements Analysis
Distribution of Listings by Minimum Night Requirement
1 Night
7 listings
7.8% of total
2 Nights
7 listings
7.8% of total
3 Nights
10 listings
11.1% of total
4-6 Nights
15 listings
16.7% of total
7-29 Nights
8 listings
8.9% of total
30+ Nights
43 listings
47.8% of total
Key Insights
- The most prevalent minimum stay requirement in Playa Grande is 30+ Nights, adopted by 47.8% of listings. This highlights the market's preference for longer commitments.
- Very short stays (1-2 nights) are less common (15.6%), suggesting hosts prefer slightly longer bookings to optimize turnover.
- A significant segment (47.8%) caters to monthly stays (30+ nights) in Playa Grande, pointing to opportunities in the extended-stay market.
Recommendations
- Align with the market by considering a 30+ Nights minimum stay, as 47.8% of Playa Grande hosts use this setting.
- If feasible, allowing 1-night stays, especially midweek or during low season, could capture last-minute bookings, as only 7.8% currently do.
- Explore offering discounts for stays of 30+ nights to attract the 47.8% of the market seeking extended stays.
- Adjust minimum nights based on seasonality – potentially shorter during low season and longer during peak demand periods in Playa Grande.
Playa Grande Airbnb Cancellation Policy Trends Analysis (2026)
Flexible
23 listings
25.6% of total
Moderate
21 listings
23.3% of total
Firm
32 listings
35.6% of total
Strict
14 listings
15.6% of total
Cancellation Policy Insights for Playa Grande
- The prevailing Airbnb cancellation policy trend in Playa Grande is Firm, used by 35.6% of listings.
- A majority (51.2%) of hosts in Playa Grande utilize Firm or Strict policies, indicating a market where hosts prioritize booking security.
Recommendations for Hosts
- Consider adopting a Firm policy to align with the 35.6% market standard in Playa Grande.
- Regularly review your cancellation policy against competitors and market demand shifts in Playa Grande.
Playa Grande STR Booking Lead Time Analysis (2026)
Average Booking Lead Time by Month
Booking Lead Time Insights for Playa Grande
- The overall average booking lead time for vacation rentals in Playa Grande is 29 days.
- Guests book furthest in advance for stays during January (average 48 days), likely coinciding with peak travel demand or local events.
- The shortest booking windows occur for stays in October (average 6 days), indicating more last-minute travel plans during this time.
- Seasonally, Winter (38 days avg.) sees the longest lead times, while Summer (10 days avg.) has the shortest, reflecting typical travel planning cycles.
Recommendations for Hosts
- Use the overall average lead time (29 days) as a baseline for your pricing and availability strategy in Playa Grande.
- For January stays, consider implementing length-of-stay discounts or slightly higher rates for bookings made less than 48 days out to capitalize on advance planning.
- During October, focus on last-minute booking availability and promotions, as guests book with very short notice (6 days avg.).
- Target marketing efforts for the Winter season well in advance (at least 38 days) to capture early planners.
- Monitor your own booking lead times against these Playa Grande averages to identify opportunities for dynamic pricing adjustments.
Popular & Essential Airbnb Amenities in Playa Grande (2026)
Amenity Prevalence
Amenity Insights for Playa Grande
- Popular amenities like Kitchen, TV, Free parking on premises are common but not universal. Offering these can provide a competitive edge.
- Warning: Wifi is not universally provided but is considered essential globally. Ensure reliable Wifi is offered.
Recommendations for Hosts
- Consider adding popular differentiators like Kitchen or TV to increase appeal.
- Highlight unique or less common amenities you offer (e.g., hot tub, dedicated workspace, EV charger) in your listing description and photos.
- Regularly check competitor amenities in Playa Grande to stay competitive.
Playa Grande Airbnb Guest Demographics & Profile Analysis (2026)
Guest Profile Summary for Playa Grande
- The typical guest profile for Airbnb in Playa Grande consists of primarily domestic travelers (89%), often arriving from nearby Montevideo, typically belonging to the Post-2000s (Gen Z/Alpha) group (50%), primarily speaking Spanish or English.
- Domestic travelers account for 88.6% of guests.
- Key international markets include Uruguay (88.6%) and Argentina (2.1%).
- Top languages spoken are Spanish (48.3%) followed by English (33.9%).
- A significant demographic segment is the Post-2000s (Gen Z/Alpha) group, representing 50% of guests.
Recommendations for Hosts
- Target domestic marketing efforts towards travelers from Montevideo and San José de Mayo.
- Tailor amenities and listing descriptions to appeal to the dominant Post-2000s (Gen Z/Alpha) demographic (e.g., highlight fast WiFi, smart home features, local guides).
- Highlight unique local experiences or amenities relevant to the primary guest profile.
- Consider seasonal promotions aligned with peak travel times for key origin markets.
Nearby Short-Term Rental Market Comparison
How does the Playa Grande Airbnb market stack up against its neighbors? Compare key performance metrics like average monthly revenue, ADR, and occupancy rates in surrounding areas to understand the broader regional STR landscape.
| Market | Active Properties | Monthly Revenue | Daily Rate | Avg. Occupancy |
|---|---|---|---|---|
| La Barra | 21 | $2,067 | $520.30 | 28% |
| Departamento de Lavalleja | 10 | $1,714 | $114.54 | 45% |
| Arenas de José Ignacio | 27 | $1,462 | $497.77 | 24% |
| San Rafael - El Placer | 121 | $1,397 | $390.47 | 26% |
| Pan de Azúcar | 22 | $1,295 | $221.24 | 23% |
| La Barra | 202 | $1,273 | $369.87 | 28% |
| José Ignacio | 239 | $1,273 | $368.04 | 27% |
| El Edén | 29 | $1,253 | $229.87 | 24% |
| Departamento de Maldonado | 21 | $1,249 | $201.84 | 24% |
| San Carlos | 23 | $1,196 | $184.62 | 27% |