Pinares - Las Delicias Airbnb Market Analysis 2026: Short Term Rental Data & Vacation Rental Statistics in Maldonado, Uruguay
Is Airbnb profitable in Pinares - Las Delicias in 2026? Explore comprehensive Airbnb analytics for Pinares - Las Delicias, Maldonado, Uruguay to uncover income potential. This 2026 STR market report for Pinares - Las Delicias, based on AirROI data from February 2025 to January 2026, reveals key trends in the market of 632 active listings.
Whether you're considering an Airbnb investment in Pinares - Las Delicias, optimizing your existing vacation rental, or exploring rental arbitrage opportunities, understanding the Pinares - Las Delicias Airbnb data is crucial. Leveraging the low regulation environment is key to maximizing your short term rental income potential. Let's dive into the specifics.
Key Pinares - Las Delicias Airbnb Performance Metrics Overview
Monthly Airbnb Revenue Variations & Income Potential in Pinares - Las Delicias (2026)
Understanding the monthly revenue variations for Airbnb listings in Pinares - Las Delicias is key to maximizing your short term rental income potential. Seasonality significantly impacts earnings. Our analysis, based on data from the past 12 months, shows that the peak revenue month for STRs in Pinares - Las Delicias is typically February, while August often presents the lowest earnings, highlighting opportunities for strategic pricing adjustments during shoulder and low seasons. Explore the typical Airbnb income in Pinares - Las Delicias across different performance tiers:
- Best-in-class properties (Top 10%) achieve $3,573+ monthly, often utilizing dynamic pricing and superior guest experiences.
- Strong performing properties (Top 25%) earn $2,136 or more, indicating effective management and desirable locations/amenities.
- Typical properties (Median) generate around $1,079 per month, representing the average market performance.
- Entry-level properties (Bottom 25%) see earnings around $498, often with potential for optimization.
Average Monthly Airbnb Earnings Trend in Pinares - Las Delicias
Pinares - Las Delicias Airbnb Occupancy Rate Trends (2026)
Maximize your bookings by understanding the Pinares - Las Delicias STR occupancy trends. Seasonal demand shifts significantly influence how often properties are booked. Typically, Februarysees the highest demand (peak season occupancy), while June experiences the lowest (low season). Effective strategies, like adjusting minimum stays or offering promotions, can boost occupancy during slower periods. Here's how different property tiers perform in Pinares - Las Delicias:
- Best-in-class properties (Top 10%) achieve 60%+ occupancy, indicating high desirability and potentially optimized availability.
- Strong performing properties (Top 25%) maintain 40% or higher occupancy, suggesting good market fit and guest satisfaction.
- Typical properties (Median) have an occupancy rate around 21%.
- Entry-level properties (Bottom 25%) average 10% occupancy, potentially facing higher vacancy.
Average Monthly Occupancy Rate Trend in Pinares - Las Delicias
Average Daily Rate (ADR) Airbnb Trends in Pinares - Las Delicias (2026)
Effective short term rental pricing strategy in Pinares - Las Delicias involves understanding monthly ADR fluctuations. The Average Daily Rate (ADR) for Airbnb in Pinares - Las Delicias typically peaks in January and dips lowest during May. Leveraging Airbnb dynamic pricing tools or strategies based on this seasonality can significantly boost revenue. Here's a look at the typical nightly rates achieved:
- Best-in-class properties (Top 10%) command rates of $360+ per night, often due to premium features or locations.
- Strong performing properties (Top 25%) achieve nightly rates of $257 or more.
- Typical properties (Median) charge around $174 per night.
- Entry-level properties (Bottom 25%) earn around $117 per night.
Average Daily Rate (ADR) Trend by Month in Pinares - Las Delicias
Get Live Pinares - Las Delicias Market Intelligence 👇

Explore Real-time Analytics
Airbnb Seasonality Analysis & Trends in Pinares - Las Delicias (2026)
Peak Season (February, January, December)
- Revenue averages $3,013 per month
- Occupancy rates average 41.7%
- Daily rates average $243
Shoulder Season
- Revenue averages $1,335 per month
- Occupancy maintains around 25.4%
- Daily rates hold near $204
Low Season (June, August, September)
- Revenue drops to average $736 per month
- Occupancy decreases to average 16.2%
- Daily rates adjust to average $200
Seasonality Insights for Pinares - Las Delicias
- The Airbnb seasonality in Pinares - Las Delicias shows highly seasonal trends requiring careful strategy. While the sections above show seasonal averages, it's also insightful to look at the extremes:
- During the high season, the absolute peak month showcases Pinares - Las Delicias's highest earning potential, with monthly revenues capable of climbing to $3,424, occupancy reaching a high of 55.7%, and ADRs peaking at $265.
- Conversely, the slowest single month of the year, typically falling within the low season, marks the market's lowest point. In this month, revenue might dip to $655, occupancy could drop to 15.2%, and ADRs may adjust down to $195.
- Understanding both the seasonal averages and these monthly peaks and troughs in revenue, occupancy, and ADR is crucial for maximizing your Airbnb profit potential in Pinares - Las Delicias.
Seasonal Strategies for Maximizing Profit
- Peak Season: Maximize revenue through premium pricing and potentially longer minimum stays. Ensure high availability.
- Low Season: Offer competitive pricing, special promotions (e.g., extended stay discounts), and flexible cancellation policies. Target off-season travelers like remote workers or budget-conscious guests.
- Shoulder Seasons: Implement dynamic pricing that balances peak and low rates. Target weekend travelers or specific events. Offer slightly more flexible terms than peak season.
- Regularly analyze your own performance against these Pinares - Las Delicias seasonality benchmarks and adjust your pricing and availability strategy accordingly.
Best Areas for Airbnb Investment in Pinares - Las Delicias (2026)
Exploring the top neighborhoods for short-term rentals in Pinares - Las Delicias? This section highlights key areas, outlining why they are attractive for hosts and guests, along with notable local attractions. Consider these locations based on your target guest profile and investment strategy.
| Neighborhood / Area | Why Host Here? (Target Guests & Appeal) | Key Attractions & Landmarks |
|---|---|---|
| Pinares | A serene and upscale residential area close to the beach, ideal for families and couples looking for a tranquil getaway. Known for its beautiful homes and quiet streets, making it attractive for longer stays. | Pinares Beach, Bikini Beach, The Soler House Museum, Laguna del Diario, Rooftop Bars |
| Las Delicias | A picturesque coastal area with a laid-back vibe, perfect for relaxing vacations. It's a hotspot for visitors looking to enjoy the beach, nature, and charming local eateries. | Las Delicias Beach, Las Delicias Lighthouse, Local seafood restaurants, Coastal walks, Nature trails |
| Argentines | This neighborhood offers a mix of local culture and proximity to the beach, making it appealing for those who want to experience the local lifestyle while still enjoying maritime activities. | Argentines Beach, Water Sports, Local markets, Nearby cafes, Scenic views |
| La Barra | A vibrant neighborhood known for its nightlife and artistic community. It's popular among younger crowds and those seeking entertainment, dining, and surfing. | La Barra Beach, Nightclubs, Art galleries, Surf schools, Pueblo de La Barra |
| Jose Ignacio | An upscale village known for its luxurious homes and exclusivity. Perfect for hosting high-end guests who are willing to pay premium rates for a unique and luxurious experience. | Jose Ignacio Beach, Fine dining restaurants, Art galleries, Wineries nearby, Sunset views |
| Manantiales | A charming coastal area, popular with both locals and tourists, known for its beautiful beaches and surf culture. Great for families and young travelers looking for a relaxed beach experience. | Manantiales Beach, Surfing spots, Local shops, Cozy cafes, Beach clubs |
| Punta Ballena | Known for its stunning views and natural beauty. Attracts visitors looking for nature experiences coupled with the luxury of nearby resorts and beaches. | Punta Ballena Beach, Casapueblo, Whale watching, Natural reserves, Scenic viewpoints |
| Maldonado | A mix of urban and suburban living close to all major tourist attractions. Ideal for hosting travelers who want to explore the larger region while having easy access to services. | Maldonado City Center, Shopping areas, Local markets, Cultural sites, Historical buildings |
Understanding Airbnb License Requirements & STR Laws in Pinares - Las Delicias (2026)
While Pinares - Las Delicias, Maldonado, Uruguay currently shows low STR regulations, specific Airbnb license requirements might still exist or change. Always verify the latest short term rental regulations and Airbnb license requirements directly with local government authorities for Pinares - Las Delicias to ensure full compliance before hosting.
(Source: AirROI data, 2026, based on 0% licensed listings)
Top Performing Airbnb Properties in Pinares - Las Delicias (2026)
Benchmark your potential! Explore examples of top-performing Airbnb properties in Pinares - Las Deliciasbased on Trailing Twelve Month (TTM) revenue. Analyze their characteristics, revenue, occupancy rate, and ADR to understand what drives success in this market.
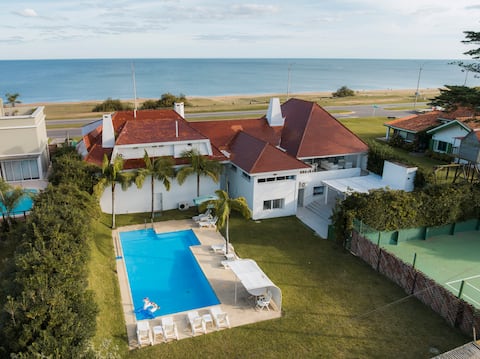
Oceanfront, exclusive house for +19 people.
Entire Place • 9 bedrooms
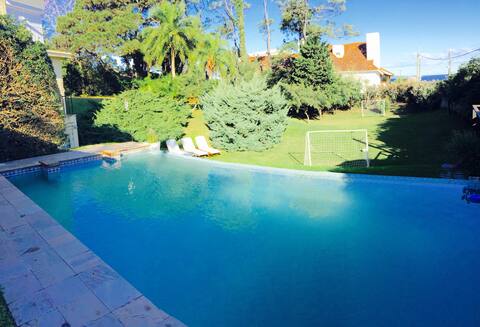
Ocean view, large park, very comfortable
Entire Place • 6 bedrooms

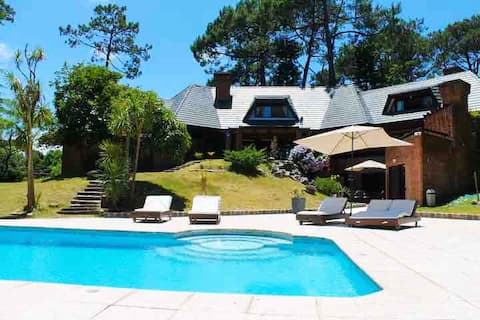
Relax Beyond The Sea
Entire Place • 4 bedrooms
Spectacular house, excellent environment, unique.
Entire Place • 5 bedrooms

Brisa de Burnett
Entire Place • 3 bedrooms

Casa Playa Mansa Stop 28
Entire Place • 4 bedrooms
Note: Performance varies based on location, size, amenities, seasonality, and management quality. Data reflects the past 12 months.
Top Performing Airbnb Hosts in Pinares - Las Delicias (2026)
Learn from the best! This table showcases top-performing Airbnb hosts in Pinares - Las Delicias based on the number of properties managed and estimated total revenue over the past year. Analyze their scale and performance metrics.
| Host Name | Properties | Grossing Revenue | Stay Reviews | Avg Rating |
|---|---|---|---|---|
| Marta | 1 | $130,542 | 31 | 4.87/5.0 |
| Marcos | 6 | $108,413 | 115 | 4.78/5.0 |
| Oceana | 4 | $97,667 | 56 | 4.84/5.0 |
| Rossina | 1 | $77,216 | 50 | 4.92/5.0 |
| Paula | 1 | $75,569 | 24 | 4.92/5.0 |
| Gustavo | 2 | $67,445 | 79 | 5.00/5.0 |
| Andrea | 3 | $67,330 | 75 | 4.93/5.0 |
| Noelia | 1 | $57,301 | 24 | 4.88/5.0 |
| Martin | 1 | $54,800 | 7 | 5.00/5.0 |
| José Pedro | 2 | $50,421 | 162 | 4.99/5.0 |
Analyzing the strategies of top hosts, such as their property selection, pricing, and guest communication, can offer valuable lessons for optimizing your own Airbnb operations in Pinares - Las Delicias.
Dive Deeper: Advanced Pinares - Las Delicias STR Market Data (2026)
Ready to unlock more insights? AirROI provides access to advanced metrics and comprehensive Airbnb data for Pinares - Las Delicias. Explore detailed analytics beyond this report to refine your investment strategy, optimize pricing, and maximize your vacation rental profits.
Explore Advanced MetricsPinares - Las Delicias Short-Term Rental Market Composition (2026): Property & Room Types
Room Type Distribution
Property Type Distribution
Market Composition Insights for Pinares - Las Delicias
- The Pinares - Las Delicias Airbnb market composition is heavily skewed towards Entire Home/Apt listings, which make up 96.5% of the 632 active rentals. This indicates strong guest preference for privacy and space.
- Looking at the property type distribution in Pinares - Las Delicias, Apartment/Condo properties are the most common (62%), reflecting the local real estate landscape.
- Houses represent a significant 33.2% portion, catering likely to families or larger groups.
- Smaller segments like hotel/boutique, outdoor/unique, others, unique stays (combined 4.8%) offer potential for unique stay experiences.
Pinares - Las Delicias Airbnb Room Capacity Analysis (2026): Bedroom Distribution
Distribution of Listings by Number of Bedrooms
Room Capacity Insights for Pinares - Las Delicias
- The dominant room capacity in Pinares - Las Delicias is 2 bedrooms listings, making up 31.2% of the market. This suggests a strong demand for properties suitable for couples or solo travelers.
- Together, 2 bedrooms and 1 bedroom properties represent 55.6% of the active Airbnb listings in Pinares - Las Delicias, indicating a high concentration in these sizes.
- A significant 38.4% of listings offer 3+ bedrooms, catering to larger groups and families seeking more space in Pinares - Las Delicias.
Pinares - Las Delicias Vacation Rental Guest Capacity Trends (2026)
Distribution of Listings by Guest Capacity
Guest Capacity Insights for Pinares - Las Delicias
- The most common guest capacity trend in Pinares - Las Delicias vacation rentals is listings accommodating 4 guests (31.6%). This suggests the primary traveler segment is likely small families or groups.
- Properties designed for 4 guests and 6 guests dominate the Pinares - Las Delicias STR market, accounting for 48.7% of listings.
- 39.0% of properties accommodate 6+ guests, serving the market segment for larger families or group travel in Pinares - Las Delicias.
- On average, properties in Pinares - Las Delicias are equipped to host 5.0 guests.
Pinares - Las Delicias Airbnb Booking Patterns (2026): Available vs. Booked Days
Available Days Distribution
Booked Days Distribution
Booking Pattern Insights for Pinares - Las Delicias
- The most common availability pattern in Pinares - Las Delicias falls within the 271-366 days range, representing 84.3% of listings. This suggests many properties have significant open periods on their calendars.
- Approximately 97.1% of listings show high availability (181+ days open annually), indicating potential for increased bookings or specific owner usage patterns.
- For booked days, the 1-30 days range is most frequent in Pinares - Las Delicias (44.3%), reflecting common guest stay durations or potential owner blocking patterns.
- A notable 3.4% of properties secure long booking periods (181+ days booked per year), highlighting successful long-term rental strategies or significant owner usage.
Pinares - Las Delicias Airbnb Minimum Stay Requirements Analysis
Distribution of Listings by Minimum Night Requirement
1 Night
45 listings
7.1% of total
2 Nights
69 listings
10.9% of total
3 Nights
50 listings
7.9% of total
4-6 Nights
138 listings
21.8% of total
7-29 Nights
111 listings
17.6% of total
30+ Nights
219 listings
34.7% of total
Key Insights
- The most prevalent minimum stay requirement in Pinares - Las Delicias is 30+ Nights, adopted by 34.7% of listings. This highlights the market's preference for longer commitments.
- Very short stays (1-2 nights) are less common (18.0%), suggesting hosts prefer slightly longer bookings to optimize turnover.
- A significant segment (34.7%) caters to monthly stays (30+ nights) in Pinares - Las Delicias, pointing to opportunities in the extended-stay market.
Recommendations
- Align with the market by considering a 30+ Nights minimum stay, as 34.7% of Pinares - Las Delicias hosts use this setting.
- If feasible, allowing 1-night stays, especially midweek or during low season, could capture last-minute bookings, as only 7.1% currently do.
- Explore offering discounts for stays of 30+ nights to attract the 34.7% of the market seeking extended stays.
- Adjust minimum nights based on seasonality – potentially shorter during low season and longer during peak demand periods in Pinares - Las Delicias.
Pinares - Las Delicias Airbnb Cancellation Policy Trends Analysis (2026)
Limited
17 listings
2.7% of total
Flexible
121 listings
19.2% of total
Moderate
123 listings
19.5% of total
Firm
280 listings
44.4% of total
Strict
89 listings
14.1% of total
Cancellation Policy Insights for Pinares - Las Delicias
- The prevailing Airbnb cancellation policy trend in Pinares - Las Delicias is Firm, used by 44.4% of listings.
- A majority (58.5%) of hosts in Pinares - Las Delicias utilize Firm or Strict policies, indicating a market where hosts prioritize booking security.
Recommendations for Hosts
- Consider adopting a Firm policy to align with the 44.4% market standard in Pinares - Las Delicias.
- Using a Strict policy might deter some guests, as only 14.1% of listings use it. Evaluate if potential revenue protection outweighs possible lower booking rates.
- Regularly review your cancellation policy against competitors and market demand shifts in Pinares - Las Delicias.
Pinares - Las Delicias STR Booking Lead Time Analysis (2026)
Average Booking Lead Time by Month
Booking Lead Time Insights for Pinares - Las Delicias
- The overall average booking lead time for vacation rentals in Pinares - Las Delicias is 36 days.
- Guests book furthest in advance for stays during December (average 70 days), likely coinciding with peak travel demand or local events.
- The shortest booking windows occur for stays in June (average 6 days), indicating more last-minute travel plans during this time.
- Seasonally, Winter (55 days avg.) sees the longest lead times, while Summer (9 days avg.) has the shortest, reflecting typical travel planning cycles.
Recommendations for Hosts
- Use the overall average lead time (36 days) as a baseline for your pricing and availability strategy in Pinares - Las Delicias.
- For December stays, consider implementing length-of-stay discounts or slightly higher rates for bookings made less than 70 days out to capitalize on advance planning.
- During June, focus on last-minute booking availability and promotions, as guests book with very short notice (6 days avg.).
- Target marketing efforts for the Winter season well in advance (at least 55 days) to capture early planners.
- Monitor your own booking lead times against these Pinares - Las Delicias averages to identify opportunities for dynamic pricing adjustments.
Popular & Essential Airbnb Amenities in Pinares - Las Delicias (2026)
Amenity Prevalence
Amenity Insights for Pinares - Las Delicias
- Essential amenities in Pinares - Las Delicias that guests expect include: Kitchen, Wifi, TV. Lacking these (any) could significantly impact bookings.
- Popular amenities like Free parking on premises, Air conditioning, Washer are common but not universal. Offering these can provide a competitive edge.
Recommendations for Hosts
- Ensure your listing includes all essential amenities for Pinares - Las Delicias: Kitchen, Wifi, TV.
- Prioritize adding missing essentials: Kitchen, Wifi, TV.
- Consider adding popular differentiators like Free parking on premises or Air conditioning to increase appeal.
- Highlight unique or less common amenities you offer (e.g., hot tub, dedicated workspace, EV charger) in your listing description and photos.
- Regularly check competitor amenities in Pinares - Las Delicias to stay competitive.
Pinares - Las Delicias Airbnb Guest Demographics & Profile Analysis (2026)
Guest Profile Summary for Pinares - Las Delicias
- The typical guest profile for Airbnb in Pinares - Las Delicias consists of a mix of domestic (55%) and international guests, often arriving from nearby Montevideo, typically belonging to the Post-2000s (Gen Z/Alpha) group (50%), primarily speaking Spanish or English.
- Domestic travelers account for 54.6% of guests.
- Key international markets include Uruguay (54.6%) and Argentina (25%).
- Top languages spoken are Spanish (42.9%) followed by English (34.9%).
- A significant demographic segment is the Post-2000s (Gen Z/Alpha) group, representing 50% of guests.
Recommendations for Hosts
- Balance marketing efforts between domestic and international channels based on the guest mix.
- Tailor amenities and listing descriptions to appeal to the dominant Post-2000s (Gen Z/Alpha) demographic (e.g., highlight fast WiFi, smart home features, local guides).
- Highlight unique local experiences or amenities relevant to the primary guest profile.
- Consider seasonal promotions aligned with peak travel times for key origin markets.
Nearby Short-Term Rental Market Comparison
How does the Pinares - Las Delicias Airbnb market stack up against its neighbors? Compare key performance metrics like average monthly revenue, ADR, and occupancy rates in surrounding areas to understand the broader regional STR landscape.
| Market | Active Properties | Monthly Revenue | Daily Rate | Avg. Occupancy |
|---|---|---|---|---|
| La Barra | 21 | $2,067 | $520.30 | 28% |
| Departamento de Lavalleja | 10 | $1,714 | $114.54 | 45% |
| Arenas de José Ignacio | 27 | $1,462 | $497.77 | 24% |
| San Rafael - El Placer | 121 | $1,397 | $390.47 | 26% |
| Pan de Azúcar | 22 | $1,295 | $221.24 | 23% |
| La Barra | 202 | $1,273 | $369.87 | 28% |
| José Ignacio | 239 | $1,273 | $368.04 | 27% |
| El Edén | 29 | $1,253 | $229.87 | 24% |
| Departamento de Maldonado | 21 | $1,249 | $201.84 | 24% |
| San Carlos | 23 | $1,196 | $184.62 | 27% |