Maldonado Airbnb Market Analysis 2025: Short Term Rental Data & Vacation Rental Statistics in Maldonado, Uruguay
Is Airbnb profitable in Maldonado in 2025? Explore comprehensive Airbnb analytics for Maldonado, Maldonado, Uruguay to uncover income potential. This 2025 STR market report for Maldonado, based on AirROI data from November 2024 to October 2025, reveals key trends in the niche market of 141 active listings.
Whether you're considering an Airbnb investment in Maldonado, optimizing your existing vacation rental, or exploring rental arbitrage opportunities, understanding the Maldonado Airbnb data is crucial. Leveraging the low regulation environment is key to maximizing your short term rental income potential. Let's dive into the specifics.
Key Maldonado Airbnb Performance Metrics Overview
Monthly Airbnb Revenue Variations & Income Potential in Maldonado (2025)
Understanding the monthly revenue variations for Airbnb listings in Maldonado is key to maximizing your short term rental income potential. Seasonality significantly impacts earnings. Our analysis, based on data from the past 12 months, shows that the peak revenue month for STRs in Maldonado is typically January, while August often presents the lowest earnings, highlighting opportunities for strategic pricing adjustments during shoulder and low seasons. Explore the typical Airbnb income in Maldonado across different performance tiers:
- Best-in-class properties (Top 10%) achieve $3,486+ monthly, often utilizing dynamic pricing and superior guest experiences.
- Strong performing properties (Top 25%) earn $1,734 or more, indicating effective management and desirable locations/amenities.
- Typical properties (Median) generate around $852 per month, representing the average market performance.
- Entry-level properties (Bottom 25%) see earnings around $398, often with potential for optimization.
Average Monthly Airbnb Earnings Trend in Maldonado
Maldonado Airbnb Occupancy Rate Trends (2025)
Maximize your bookings by understanding the Maldonado STR occupancy trends. Seasonal demand shifts significantly influence how often properties are booked. Typically, Januarysees the highest demand (peak season occupancy), while June experiences the lowest (low season). Effective strategies, like adjusting minimum stays or offering promotions, can boost occupancy during slower periods. Here's how different property tiers perform in Maldonado:
- Best-in-class properties (Top 10%) achieve 63%+ occupancy, indicating high desirability and potentially optimized availability.
- Strong performing properties (Top 25%) maintain 46% or higher occupancy, suggesting good market fit and guest satisfaction.
- Typical properties (Median) have an occupancy rate around 25%.
- Entry-level properties (Bottom 25%) average 10% occupancy, potentially facing higher vacancy.
Average Monthly Occupancy Rate Trend in Maldonado
Average Daily Rate (ADR) Airbnb Trends in Maldonado (2025)
Effective short term rental pricing strategy in Maldonado involves understanding monthly ADR fluctuations. The Average Daily Rate (ADR) for Airbnb in Maldonado typically peaks in January and dips lowest during September. Leveraging Airbnb dynamic pricing tools or strategies based on this seasonality can significantly boost revenue. Here's a look at the typical nightly rates achieved:
- Best-in-class properties (Top 10%) command rates of $334+ per night, often due to premium features or locations.
- Strong performing properties (Top 25%) achieve nightly rates of $206 or more.
- Typical properties (Median) charge around $121 per night.
- Entry-level properties (Bottom 25%) earn around $77 per night.
Average Daily Rate (ADR) Trend by Month in Maldonado
Get Live Maldonado Market Intelligence 👇

Explore Real-time Analytics
Airbnb Seasonality Analysis & Trends in Maldonado (2025)
Peak Season (January, March, December)
- Revenue averages $2,264 per month
- Occupancy rates average 40.7%
- Daily rates average $195
Shoulder Season
- Revenue averages $1,337 per month
- Occupancy maintains around 28.7%
- Daily rates hold near $178
Low Season (June, July, August)
- Revenue drops to average $883 per month
- Occupancy decreases to average 21.7%
- Daily rates adjust to average $170
Seasonality Insights for Maldonado
- The Airbnb seasonality in Maldonado shows highly seasonal trends requiring careful strategy. While the sections above show seasonal averages, it's also insightful to look at the extremes:
- During the high season, the absolute peak month showcases Maldonado's highest earning potential, with monthly revenues capable of climbing to $2,620, occupancy reaching a high of 48.9%, and ADRs peaking at $207.
- Conversely, the slowest single month of the year, typically falling within the low season, marks the market's lowest point. In this month, revenue might dip to $845, occupancy could drop to 20.2%, and ADRs may adjust down to $166.
- Understanding both the seasonal averages and these monthly peaks and troughs in revenue, occupancy, and ADR is crucial for maximizing your Airbnb profit potential in Maldonado.
Seasonal Strategies for Maximizing Profit
- Peak Season: Maximize revenue through premium pricing and potentially longer minimum stays. Ensure high availability.
- Low Season: Offer competitive pricing, special promotions (e.g., extended stay discounts), and flexible cancellation policies. Target off-season travelers like remote workers or budget-conscious guests.
- Shoulder Seasons: Implement dynamic pricing that balances peak and low rates. Target weekend travelers or specific events. Offer slightly more flexible terms than peak season.
- Regularly analyze your own performance against these Maldonado seasonality benchmarks and adjust your pricing and availability strategy accordingly.
Best Areas for Airbnb Investment in Maldonado (2025)
Exploring the top neighborhoods for short-term rentals in Maldonado? This section highlights key areas, outlining why they are attractive for hosts and guests, along with notable local attractions. Consider these locations based on your target guest profile and investment strategy.
| Neighborhood / Area | Why Host Here? (Target Guests & Appeal) | Key Attractions & Landmarks |
|---|---|---|
| Punta del Este | Famous beach resort town known for its luxurious lifestyle, beautiful beaches, and vibrant nightlife. It's a prime destination for both local and international tourists, especially during the summer months. | La Mano Sculpture, Mansa Beach, Brava Beach, Gorlero Avenue, Punta Shopping, Casapueblo Museum |
| Jose Ignacio | Exclusive coastal village renowned for its stunning beaches and upscale atmosphere. This area attracts affluent travelers looking for a more laid-back, sophisticated beach experience. | Jose Ignacio Beach, Punta del Este Lighthouse, The Blue House, La Olada, Local seafood restaurants, Art galleries |
| La Barra | Trendy coastal area popular among young tourists and locals, known for its bohemian vibe and nightlife. Ideal for hosting Airbnb guests looking for a lively and artistic environment. | La Barra Beach, Bridge of La Barra, Local art galleries, Surfing spots, Nightclubs and bars |
| Manantiales | Charming beach town that offers a mix of tranquility and vibrant beach life. Attracts families and couples seeking a relaxing getaway without the hustle of Punta del Este. | Manantiales Beach, Local markets, Boutique shops, Nearby nature reserves, Restaurants with sea views |
| Punta Ballena | A scenic coastal area famous for its panoramic views and nature. It's popular among eco-tourists and those looking for a serene escape close to Punta del Este. | Humboldt Reserve, Solanas Beach, Casa Pueblo, Whale Watching (in season), Nature trails |
| Piriápolis | Historic beach town known for its charming architecture and beautiful coastal views. It offers a more relaxed alternative to Punta del Este, appealing to families and couples. | Piriápolis Beach, Argentino Hotel, Cerro del Toro, Local shops and eateries, Historic pier |
| San Carlos | A traditional Uruguayan town offering authenticity and cultural experiences. It presents opportunities for hosting guests looking for a genuine local experience away from the tourist hotspots. | Historic buildings, Local festivals, Nearby vineyards, Cultural heritage sites, Artisans' markets |
| Solanas | An emerging destination with beautiful beaches and nature, appealing to those looking for tranquility and outdoor activities. Ideal for eco-tourists and families alike. | Solanas Beach, Nature trails, Camping areas, Birdwatching sites, Water sports activities |
Understanding Airbnb License Requirements & STR Laws in Maldonado (2025)
While Maldonado, Maldonado, Uruguay currently shows low STR regulations, specific Airbnb license requirements might still exist or change. Always verify the latest short term rental regulations and Airbnb license requirements directly with local government authorities for Maldonado to ensure full compliance before hosting.
(Source: AirROI data, 2025, finding no licensed listings among those analyzed)
Top Performing Airbnb Properties in Maldonado (2025)
Benchmark your potential! Explore examples of top-performing Airbnb properties in Maldonadobased on Trailing Twelve Month (TTM) revenue. Analyze their characteristics, revenue, occupancy rate, and ADR to understand what drives success in this market.
"La Tertulia" - Spectacular Mansion - Garzón
Entire Place • 4 bedrooms
Family Summer House
Entire Place • 4 bedrooms
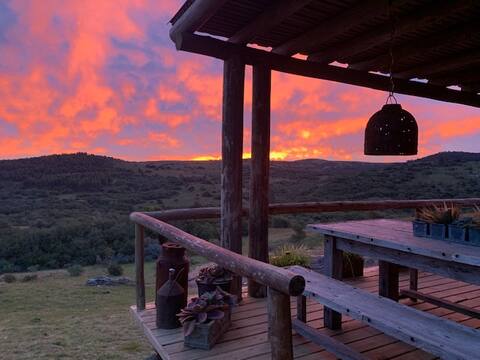
Spectacular farm in the mountains, “La Soñada”
Entire Place • 2 bedrooms
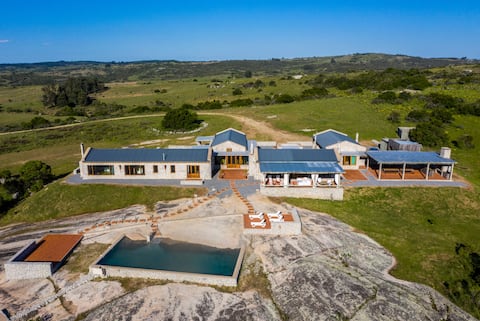
Private farm with pool 20 minutes from Punta del Este
Entire Place • 4 bedrooms
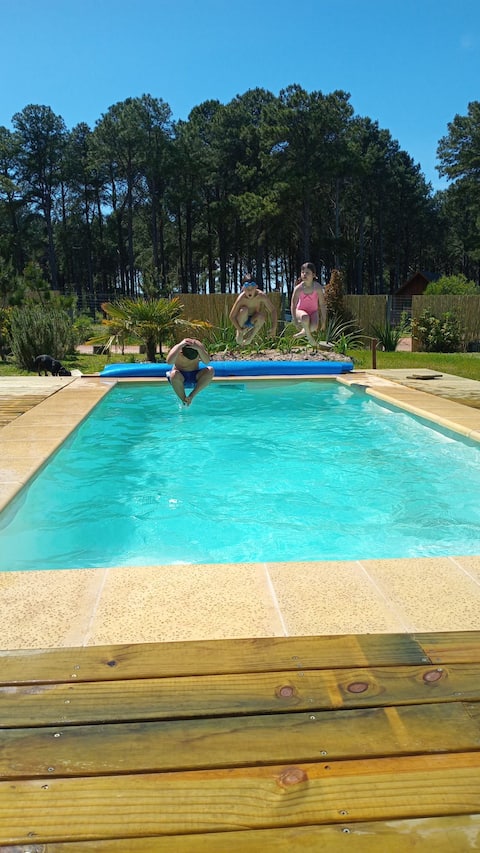
Cabaña La Sosiega in pine forests, Punta del Este
Entire Place • 3 bedrooms

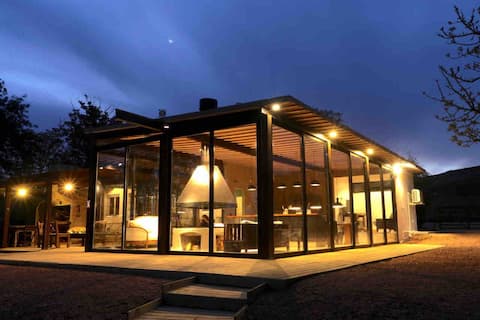
Pueblo Edén, spectacular "Sierra Paz" farm
Entire Place • 5 bedrooms
Note: Performance varies based on location, size, amenities, seasonality, and management quality. Data reflects the past 12 months.
Top Performing Airbnb Hosts in Maldonado (2025)
Learn from the best! This table showcases top-performing Airbnb hosts in Maldonado based on the number of properties managed and estimated total revenue over the past year. Analyze their scale and performance metrics.
| Host Name | Properties | Grossing Revenue | Stay Reviews | Avg Rating |
|---|---|---|---|---|
| Estancia | 11 | $129,082 | 112 | 4.84/5.0 |
| Martin | 1 | $88,403 | 2 | Not Rated |
| Christian | 1 | $66,938 | 10 | 5.00/5.0 |
| Gabriela | 1 | $53,933 | 47 | 4.94/5.0 |
| Diego | 1 | $45,293 | 107 | 4.74/5.0 |
| Fabian | 1 | $43,637 | 57 | 4.95/5.0 |
| Maria Ximena | 1 | $42,001 | 37 | 5.00/5.0 |
| Ana Paula | 1 | $41,332 | 14 | 5.00/5.0 |
| Premium Host Punta | 1 | $38,345 | 2 | Not Rated |
| Veronica | 1 | $38,171 | 32 | 4.84/5.0 |
Analyzing the strategies of top hosts, such as their property selection, pricing, and guest communication, can offer valuable lessons for optimizing your own Airbnb operations in Maldonado.
Dive Deeper: Advanced Maldonado STR Market Data (2025)
Ready to unlock more insights? AirROI provides access to advanced metrics and comprehensive Airbnb data for Maldonado. Explore detailed analytics beyond this report to refine your investment strategy, optimize pricing, and maximize your vacation rental profits.
Explore Advanced MetricsMaldonado Short-Term Rental Market Composition (2025): Property & Room Types
Room Type Distribution
Property Type Distribution
Market Composition Insights for Maldonado
- The Maldonado Airbnb market composition is heavily skewed towards Entire Home/Apt listings, which make up 86.5% of the 141 active rentals. This indicates strong guest preference for privacy and space.
- Looking at the property type distribution in Maldonado, House properties are the most common (39.7%), reflecting the local real estate landscape.
- Houses represent a significant 39.7% portion, catering likely to families or larger groups.
- The presence of 9.2% Hotel/Boutique listings indicates integration with traditional hospitality.
- Smaller segments like others, unique stays (combined 4.9%) offer potential for unique stay experiences.
Maldonado Airbnb Room Capacity Analysis (2025): Bedroom Distribution
Distribution of Listings by Number of Bedrooms
Room Capacity Insights for Maldonado
- The dominant room capacity in Maldonado is 1 bedroom listings, making up 28.4% of the market. This suggests a strong demand for properties suitable for couples or solo travelers.
- Together, 1 bedroom and 2 bedrooms properties represent 55.4% of the active Airbnb listings in Maldonado, indicating a high concentration in these sizes.
- A significant 28.4% of listings offer 3+ bedrooms, catering to larger groups and families seeking more space in Maldonado.
Maldonado Vacation Rental Guest Capacity Trends (2025)
Distribution of Listings by Guest Capacity
Guest Capacity Insights for Maldonado
- The most common guest capacity trend in Maldonado vacation rentals is listings accommodating 4 guests (24.1%). This suggests the primary traveler segment is likely small families or groups.
- Properties designed for 4 guests and 2 guests dominate the Maldonado STR market, accounting for 46.1% of listings.
- 26.2% of properties accommodate 6+ guests, serving the market segment for larger families or group travel in Maldonado.
- On average, properties in Maldonado are equipped to host 4.1 guests.
Maldonado Airbnb Booking Patterns (2025): Available vs. Booked Days
Available Days Distribution
Booked Days Distribution
Booking Pattern Insights for Maldonado
- The most common availability pattern in Maldonado falls within the 271-366 days range, representing 71.6% of listings. This suggests many properties have significant open periods on their calendars.
- Approximately 95.7% of listings show high availability (181+ days open annually), indicating potential for increased bookings or specific owner usage patterns.
- For booked days, the 31-90 days range is most frequent in Maldonado (36.9%), reflecting common guest stay durations or potential owner blocking patterns.
- A notable 4.3% of properties secure long booking periods (181+ days booked per year), highlighting successful long-term rental strategies or significant owner usage.
Maldonado Airbnb Minimum Stay Requirements Analysis
Distribution of Listings by Minimum Night Requirement
1 Night
27 listings
19.1% of total
2 Nights
35 listings
24.8% of total
3 Nights
11 listings
7.8% of total
4-6 Nights
22 listings
15.6% of total
7-29 Nights
10 listings
7.1% of total
30+ Nights
36 listings
25.5% of total
Key Insights
- The most prevalent minimum stay requirement in Maldonado is 30+ Nights, adopted by 25.5% of listings. This highlights the market's preference for longer commitments.
- A significant segment (25.5%) caters to monthly stays (30+ nights) in Maldonado, pointing to opportunities in the extended-stay market.
Recommendations
- Align with the market by considering a 30+ Nights minimum stay, as 25.5% of Maldonado hosts use this setting.
- If feasible, allowing 1-night stays, especially midweek or during low season, could capture last-minute bookings, as only 19.1% currently do.
- Explore offering discounts for stays of 30+ nights to attract the 25.5% of the market seeking extended stays.
- Adjust minimum nights based on seasonality – potentially shorter during low season and longer during peak demand periods in Maldonado.
Maldonado Airbnb Cancellation Policy Trends Analysis (2025)
Flexible
26 listings
18.7% of total
Moderate
37 listings
26.6% of total
Firm
47 listings
33.8% of total
Strict
29 listings
20.9% of total
Cancellation Policy Insights for Maldonado
- The prevailing Airbnb cancellation policy trend in Maldonado is Firm, used by 33.8% of listings.
- A majority (54.7%) of hosts in Maldonado utilize Firm or Strict policies, indicating a market where hosts prioritize booking security.
Recommendations for Hosts
- Consider adopting a Firm policy to align with the 33.8% market standard in Maldonado.
- Regularly review your cancellation policy against competitors and market demand shifts in Maldonado.
Maldonado STR Booking Lead Time Analysis (2025)
Average Booking Lead Time by Month
Booking Lead Time Insights for Maldonado
- The overall average booking lead time for vacation rentals in Maldonado is 25 days.
- Guests book furthest in advance for stays during December (average 44 days), likely coinciding with peak travel demand or local events.
- The shortest booking windows occur for stays in June (average 9 days), indicating more last-minute travel plans during this time.
- Seasonally, Winter (34 days avg.) sees the longest lead times, while Summer (15 days avg.) has the shortest, reflecting typical travel planning cycles.
Recommendations for Hosts
- Use the overall average lead time (25 days) as a baseline for your pricing and availability strategy in Maldonado.
- For December stays, consider implementing length-of-stay discounts or slightly higher rates for bookings made less than 44 days out to capitalize on advance planning.
- During June, focus on last-minute booking availability and promotions, as guests book with very short notice (9 days avg.).
- Target marketing efforts for the Winter season well in advance (at least 34 days) to capture early planners.
- Monitor your own booking lead times against these Maldonado averages to identify opportunities for dynamic pricing adjustments.
Popular & Essential Airbnb Amenities in Maldonado (2025)
Amenity Prevalence
Amenity Insights for Maldonado
- Popular amenities like Kitchen, Wifi, Free parking on premises are common but not universal. Offering these can provide a competitive edge.
- Warning: Wifi is not universally provided but is considered essential globally. Ensure reliable Wifi is offered.
Recommendations for Hosts
- Consider adding popular differentiators like Kitchen or Wifi to increase appeal.
- Highlight unique or less common amenities you offer (e.g., hot tub, dedicated workspace, EV charger) in your listing description and photos.
- Regularly check competitor amenities in Maldonado to stay competitive.
Maldonado Airbnb Guest Demographics & Profile Analysis (2025)
Guest Profile Summary for Maldonado
- The typical guest profile for Airbnb in Maldonado consists of a mix of domestic (59%) and international guests, often arriving from nearby Montevideo, typically belonging to the Post-2000s (Gen Z/Alpha) group (50%), primarily speaking Spanish or English.
- Domestic travelers account for 58.6% of guests.
- Key international markets include Uruguay (58.6%) and Brazil (13.5%).
- Top languages spoken are Spanish (43.5%) followed by English (33.8%).
- A significant demographic segment is the Post-2000s (Gen Z/Alpha) group, representing 50% of guests.
Recommendations for Hosts
- Balance marketing efforts between domestic and international channels based on the guest mix.
- Tailor amenities and listing descriptions to appeal to the dominant Post-2000s (Gen Z/Alpha) demographic (e.g., highlight fast WiFi, smart home features, local guides).
- Highlight unique local experiences or amenities relevant to the primary guest profile.
- Consider seasonal promotions aligned with peak travel times for key origin markets.
Nearby Short-Term Rental Market Comparison
How does the Maldonado Airbnb market stack up against its neighbors? Compare key performance metrics like average monthly revenue, ADR, and occupancy rates in surrounding areas to understand the broader regional STR landscape.
| Market | Active Properties | Monthly Revenue | Daily Rate | Avg. Occupancy |
|---|---|---|---|---|
| La Barra | 18 | $2,349 | $559.73 | 28% |
| San Rafael - El Placer | 125 | $1,924 | $410.90 | 31% |
| La Barra | 197 | $1,912 | $392.45 | 34% |
| José Ignacio | 243 | $1,742 | $388.98 | 32% |
| Arenas de José Ignacio | 19 | $1,679 | $459.65 | 29% |
| Manantiales | 102 | $1,618 | $324.45 | 34% |
| Pan de Azúcar | 22 | $1,511 | $249.55 | 24% |
| Departamento de Maldonado | 22 | $1,492 | $201.77 | 28% |
| El Edén | 27 | $1,456 | $236.05 | 24% |
| Departamento de Lavalleja | 12 | $1,437 | $115.87 | 40% |