Maldonado Airbnb Market Analysis 2026: Short Term Rental Data & Vacation Rental Statistics in Departamento de Maldonado, Uruguay
Is Airbnb profitable in Maldonado in 2026? Explore comprehensive Airbnb analytics for Maldonado, Departamento de Maldonado, Uruguay to uncover income potential. This 2026 STR market report for Maldonado, based on AirROI data from February 2025 to January 2026, reveals key trends in the niche market of 156 active listings.
Whether you're considering an Airbnb investment in Maldonado, optimizing your existing vacation rental, or exploring rental arbitrage opportunities, understanding the Maldonado Airbnb data is crucial. Leveraging the low regulation environment is key to maximizing your short term rental income potential. Let's dive into the specifics.
Key Maldonado Airbnb Performance Metrics Overview
Monthly Airbnb Revenue Variations & Income Potential in Maldonado (2026)
Understanding the monthly revenue variations for Airbnb listings in Maldonado is key to maximizing your short term rental income potential. Seasonality significantly impacts earnings. Our analysis, based on data from the past 12 months, shows that the peak revenue month for STRs in Maldonado is typically January, while August often presents the lowest earnings, highlighting opportunities for strategic pricing adjustments during shoulder and low seasons. Explore the typical Airbnb income in Maldonado across different performance tiers:
- Best-in-class properties (Top 10%) achieve $3,320+ monthly, often utilizing dynamic pricing and superior guest experiences.
- Strong performing properties (Top 25%) earn $1,727 or more, indicating effective management and desirable locations/amenities.
- Typical properties (Median) generate around $807 per month, representing the average market performance.
- Entry-level properties (Bottom 25%) see earnings around $343, often with potential for optimization.
Average Monthly Airbnb Earnings Trend in Maldonado
Maldonado Airbnb Occupancy Rate Trends (2026)
Maximize your bookings by understanding the Maldonado STR occupancy trends. Seasonal demand shifts significantly influence how often properties are booked. Typically, Februarysees the highest demand (peak season occupancy), while June experiences the lowest (low season). Effective strategies, like adjusting minimum stays or offering promotions, can boost occupancy during slower periods. Here's how different property tiers perform in Maldonado:
- Best-in-class properties (Top 10%) achieve 62%+ occupancy, indicating high desirability and potentially optimized availability.
- Strong performing properties (Top 25%) maintain 45% or higher occupancy, suggesting good market fit and guest satisfaction.
- Typical properties (Median) have an occupancy rate around 23%.
- Entry-level properties (Bottom 25%) average 9% occupancy, potentially facing higher vacancy.
Average Monthly Occupancy Rate Trend in Maldonado
Average Daily Rate (ADR) Airbnb Trends in Maldonado (2026)
Effective short term rental pricing strategy in Maldonado involves understanding monthly ADR fluctuations. The Average Daily Rate (ADR) for Airbnb in Maldonado typically peaks in January and dips lowest during May. Leveraging Airbnb dynamic pricing tools or strategies based on this seasonality can significantly boost revenue. Here's a look at the typical nightly rates achieved:
- Best-in-class properties (Top 10%) command rates of $348+ per night, often due to premium features or locations.
- Strong performing properties (Top 25%) achieve nightly rates of $216 or more.
- Typical properties (Median) charge around $131 per night.
- Entry-level properties (Bottom 25%) earn around $82 per night.
Average Daily Rate (ADR) Trend by Month in Maldonado
Get Live Maldonado Market Intelligence 👇

Explore Real-time Analytics
Airbnb Seasonality Analysis & Trends in Maldonado (2026)
Peak Season (January, December, March)
- Revenue averages $2,193 per month
- Occupancy rates average 36.7%
- Daily rates average $207
Shoulder Season
- Revenue averages $1,381 per month
- Occupancy maintains around 28.5%
- Daily rates hold near $181
Low Season (June, July, August)
- Revenue drops to average $892 per month
- Occupancy decreases to average 22.2%
- Daily rates adjust to average $172
Seasonality Insights for Maldonado
- The Airbnb seasonality in Maldonado shows highly seasonal trends requiring careful strategy. While the sections above show seasonal averages, it's also insightful to look at the extremes:
- During the high season, the absolute peak month showcases Maldonado's highest earning potential, with monthly revenues capable of climbing to $2,388, occupancy reaching a high of 40.8%, and ADRs peaking at $229.
- Conversely, the slowest single month of the year, typically falling within the low season, marks the market's lowest point. In this month, revenue might dip to $843, occupancy could drop to 19.8%, and ADRs may adjust down to $170.
- Understanding both the seasonal averages and these monthly peaks and troughs in revenue, occupancy, and ADR is crucial for maximizing your Airbnb profit potential in Maldonado.
Seasonal Strategies for Maximizing Profit
- Peak Season: Maximize revenue through premium pricing and potentially longer minimum stays. Ensure high availability.
- Low Season: Offer competitive pricing, special promotions (e.g., extended stay discounts), and flexible cancellation policies. Target off-season travelers like remote workers or budget-conscious guests.
- Shoulder Seasons: Implement dynamic pricing that balances peak and low rates. Target weekend travelers or specific events. Offer slightly more flexible terms than peak season.
- Regularly analyze your own performance against these Maldonado seasonality benchmarks and adjust your pricing and availability strategy accordingly.
Best Areas for Airbnb Investment in Maldonado (2026)
Exploring the top neighborhoods for short-term rentals in Maldonado? This section highlights key areas, outlining why they are attractive for hosts and guests, along with notable local attractions. Consider these locations based on your target guest profile and investment strategy.
| Neighborhood / Area | Why Host Here? (Target Guests & Appeal) | Key Attractions & Landmarks |
|---|---|---|
| Punta del Este | A world-renowned resort city that attracts tourists year-round for its beautiful beaches, luxury lifestyle, and vibrant nightlife. A prime location for vacation rentals due to its popularity with both local and international travelers. | Playa Brava, Playa Mansa, The Hand of Punta del Este, Casapueblo, La Barra, Shopping mall Punta, Artigas Square |
| José Ignacio | A chic and tranquil beach village popular among celebrities and affluent travelers. Known for its stunning beaches and laid-back atmosphere, it's a desirable spot for high-end Airbnb investments. | José Ignacio Beach, Playa Brava, The Lighthouse, beachfront restaurants, Art galleries like La Faro, Rooftop bars |
| La Barra | A vibrant neighborhood known for its artistic vibe and nightlife. Attracts younger crowds and surfers, making it a great location for hip vacation rentals. | La Barra Beach, Pueblo de La Barra, Art galleries and boutiques, Nightclubs and bars, Surf spots, Rooftop lounges |
| Piriápolis | A charming coastal town known for its historical significance and scenic beauty. It's a growing market for Airbnb with a focus on family vacations and nature retreats. | Piriápolis Beach, Cerro del Toro, La Rambla, Castle of Piria, Casino de Piriápolis, Mediterranean-style architecture |
| Maldonado City | The capital of the department, offering a mix of cultural attractions and conveniences. Attractive for visitors looking for a more authentic Uruguayan experience and proximity to Punta del Este. | Museo Mazzoni, Plaza Libertad, Cerro de la Paz, Palacio de Maldonado, Local markets, Cultural events |
| Solanas | This area is known for its stunning natural scenery and is popular with families and nature lovers. Ideal for eco-friendly rentals and outdoor activities. | Solanas Beach, Caminos de los Rios, Natural parks, Water sports, Dining by the beach, Eco-friendly retreats |
| Manantiales | An upscale beach destination known for its exclusiveness and luxury rentals. A popular choice among affluent travelers looking for a quieter getaway. | Manantiales Beach, Beachfront restaurants, Yoga retreats, Luxury shopping, Art galleries, Scenic views |
| Balneario Buenos Aires | A quaint and lesser-known beach town providing a more secluded experience. Great for those who wish to escape the busier tourist areas. | Buenos Aires Beach, Clam Fishing, Natural landscapes, Cozy cafes, Local markets and fairs, Family-friendly activities |
Understanding Airbnb License Requirements & STR Laws in Maldonado (2026)
While Maldonado, Departamento de Maldonado, Uruguay currently shows low STR regulations, specific Airbnb license requirements might still exist or change. Always verify the latest short term rental regulations and Airbnb license requirements directly with local government authorities for Maldonado to ensure full compliance before hosting.
(Source: AirROI data, 2026, finding no licensed listings among those analyzed)
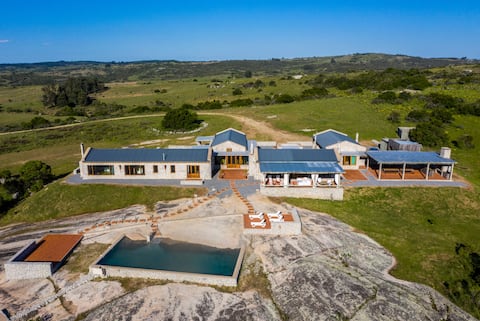
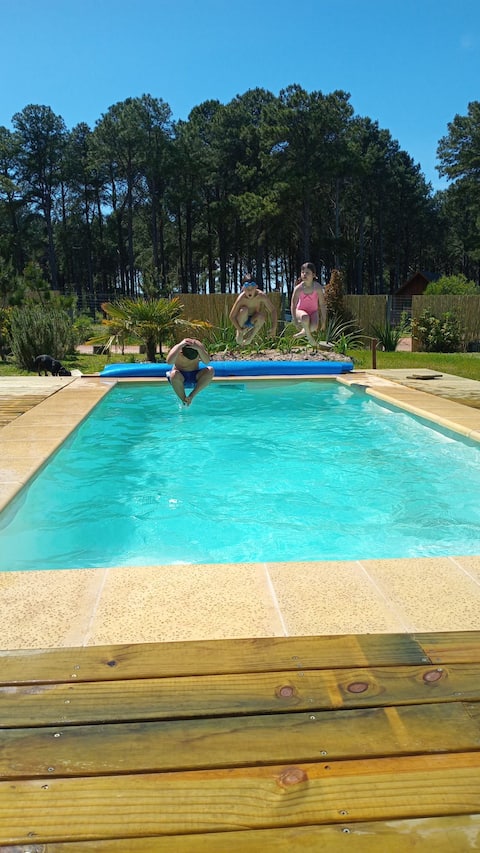
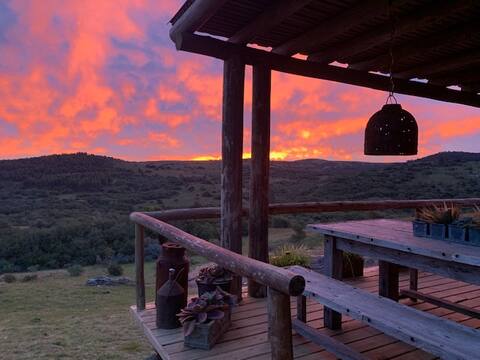
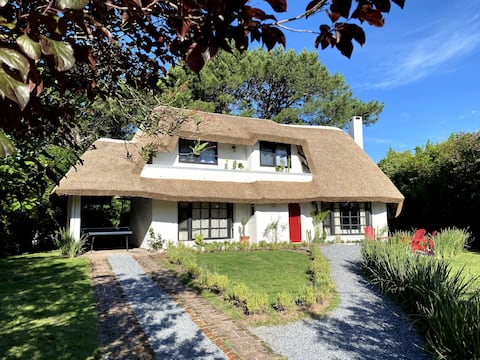
Top Performing Airbnb Properties in Maldonado (2026)
Benchmark your potential! Explore examples of top-performing Airbnb properties in Maldonadobased on Trailing Twelve Month (TTM) revenue. Analyze their characteristics, revenue, occupancy rate, and ADR to understand what drives success in this market.

PHPunta zLaguna Cisnes, Chacra Pool, BBQ, 7D
Entire Place • 7 bedrooms
"La Tertulia" - Spectacular Mansion - Garzón
Entire Place • 4 bedrooms
Family Summer House
Entire Place • 4 bedrooms
Spectacular farm in the mountains, “La Soñada”
Entire Place • 2 bedrooms

Pueblo Edén, spectacular "Sierra Paz" farm
Entire Place • 5 bedrooms
Cabaña La Sosiega in pine forests, Punta del Este
Entire Place • 3 bedrooms
Note: Performance varies based on location, size, amenities, seasonality, and management quality. Data reflects the past 12 months.
Top Performing Airbnb Hosts in Maldonado (2026)
Learn from the best! This table showcases top-performing Airbnb hosts in Maldonado based on the number of properties managed and estimated total revenue over the past year. Analyze their scale and performance metrics.
| Host Name | Properties | Grossing Revenue | Stay Reviews | Avg Rating |
|---|---|---|---|---|
| Estancia | 11 | $114,182 | 120 | 4.84/5.0 |
| Premium Host Punta | 1 | $76,845 | 3 | 5.00/5.0 |
| Martin | 1 | $76,067 | 2 | Not Rated |
| Christian | 1 | $72,452 | 18 | 5.00/5.0 |
| Gabriela | 1 | $49,149 | 50 | 4.94/5.0 |
| Maria Ximena | 1 | $47,931 | 44 | 5.00/5.0 |
| Fabian | 1 | $41,456 | 62 | 4.95/5.0 |
| Diego | 1 | $40,372 | 117 | 4.71/5.0 |
| Chacra La Ariscona | 1 | $37,459 | 13 | 5.00/5.0 |
| Micaela | 1 | $31,680 | 16 | 4.56/5.0 |
Analyzing the strategies of top hosts, such as their property selection, pricing, and guest communication, can offer valuable lessons for optimizing your own Airbnb operations in Maldonado.
Dive Deeper: Advanced Maldonado STR Market Data (2026)
Ready to unlock more insights? AirROI provides access to advanced metrics and comprehensive Airbnb data for Maldonado. Explore detailed analytics beyond this report to refine your investment strategy, optimize pricing, and maximize your vacation rental profits.
Explore Advanced MetricsMaldonado Short-Term Rental Market Composition (2026): Property & Room Types
Room Type Distribution
Property Type Distribution
Market Composition Insights for Maldonado
- The Maldonado Airbnb market composition is heavily skewed towards Entire Home/Apt listings, which make up 85.9% of the 156 active rentals. This indicates strong guest preference for privacy and space.
- Looking at the property type distribution in Maldonado, House properties are the most common (39.1%), reflecting the local real estate landscape.
- Houses represent a significant 39.1% portion, catering likely to families or larger groups.
- The presence of 10.3% Hotel/Boutique listings indicates integration with traditional hospitality.
- Smaller segments like others, unique stays (combined 3.9%) offer potential for unique stay experiences.
Maldonado Airbnb Room Capacity Analysis (2026): Bedroom Distribution
Distribution of Listings by Number of Bedrooms
Room Capacity Insights for Maldonado
- The dominant room capacity in Maldonado is 1 bedroom listings, making up 30.1% of the market. This suggests a strong demand for properties suitable for couples or solo travelers.
- Together, 1 bedroom and 2 bedrooms properties represent 58.3% of the active Airbnb listings in Maldonado, indicating a high concentration in these sizes.
- A significant 26.3% of listings offer 3+ bedrooms, catering to larger groups and families seeking more space in Maldonado.
Maldonado Vacation Rental Guest Capacity Trends (2026)
Distribution of Listings by Guest Capacity
Guest Capacity Insights for Maldonado
- The most common guest capacity trend in Maldonado vacation rentals is listings accommodating 4 guests (23.1%). This suggests the primary traveler segment is likely small families or groups.
- Properties designed for 4 guests and 2 guests dominate the Maldonado STR market, accounting for 43.0% of listings.
- 26.9% of properties accommodate 6+ guests, serving the market segment for larger families or group travel in Maldonado.
- On average, properties in Maldonado are equipped to host 4.1 guests.
Maldonado Airbnb Booking Patterns (2026): Available vs. Booked Days
Available Days Distribution
Booked Days Distribution
Booking Pattern Insights for Maldonado
- The most common availability pattern in Maldonado falls within the 271-366 days range, representing 80.1% of listings. This suggests many properties have significant open periods on their calendars.
- Approximately 95.5% of listings show high availability (181+ days open annually), indicating potential for increased bookings or specific owner usage patterns.
- For booked days, the 1-30 days range is most frequent in Maldonado (44.2%), reflecting common guest stay durations or potential owner blocking patterns.
- A notable 5.1% of properties secure long booking periods (181+ days booked per year), highlighting successful long-term rental strategies or significant owner usage.
Maldonado Airbnb Minimum Stay Requirements Analysis
Distribution of Listings by Minimum Night Requirement
1 Night
25 listings
16% of total
2 Nights
33 listings
21.2% of total
3 Nights
8 listings
5.1% of total
4-6 Nights
22 listings
14.1% of total
7-29 Nights
7 listings
4.5% of total
30+ Nights
61 listings
39.1% of total
Key Insights
- The most prevalent minimum stay requirement in Maldonado is 30+ Nights, adopted by 39.1% of listings. This highlights the market's preference for longer commitments.
- A significant segment (39.1%) caters to monthly stays (30+ nights) in Maldonado, pointing to opportunities in the extended-stay market.
Recommendations
- Align with the market by considering a 30+ Nights minimum stay, as 39.1% of Maldonado hosts use this setting.
- If feasible, allowing 1-night stays, especially midweek or during low season, could capture last-minute bookings, as only 16% currently do.
- Explore offering discounts for stays of 30+ nights to attract the 39.1% of the market seeking extended stays.
- Adjust minimum nights based on seasonality – potentially shorter during low season and longer during peak demand periods in Maldonado.
Maldonado Airbnb Cancellation Policy Trends Analysis (2026)
Limited
3 listings
1.9% of total
Flexible
25 listings
16% of total
Moderate
51 listings
32.7% of total
Firm
60 listings
38.5% of total
Strict
17 listings
10.9% of total
Cancellation Policy Insights for Maldonado
- The prevailing Airbnb cancellation policy trend in Maldonado is Firm, used by 38.5% of listings.
- There's a relatively balanced mix between guest-friendly (48.7%) and stricter (49.4%) policies, offering choices for different guest needs.
Recommendations for Hosts
- Consider adopting a Firm policy to align with the 38.5% market standard in Maldonado.
- Using a Strict policy might deter some guests, as only 10.9% of listings use it. Evaluate if potential revenue protection outweighs possible lower booking rates.
- Regularly review your cancellation policy against competitors and market demand shifts in Maldonado.
Maldonado STR Booking Lead Time Analysis (2026)
Average Booking Lead Time by Month
Booking Lead Time Insights for Maldonado
- The overall average booking lead time for vacation rentals in Maldonado is 32 days.
- Guests book furthest in advance for stays during November (average 50 days), likely coinciding with peak travel demand or local events.
- The shortest booking windows occur for stays in June (average 8 days), indicating more last-minute travel plans during this time.
- Seasonally, Winter (35 days avg.) sees the longest lead times, while Summer (15 days avg.) has the shortest, reflecting typical travel planning cycles.
Recommendations for Hosts
- Use the overall average lead time (32 days) as a baseline for your pricing and availability strategy in Maldonado.
- For November stays, consider implementing length-of-stay discounts or slightly higher rates for bookings made less than 50 days out to capitalize on advance planning.
- During June, focus on last-minute booking availability and promotions, as guests book with very short notice (8 days avg.).
- Target marketing efforts for the Winter season well in advance (at least 35 days) to capture early planners.
- Monitor your own booking lead times against these Maldonado averages to identify opportunities for dynamic pricing adjustments.
Popular & Essential Airbnb Amenities in Maldonado (2026)
Amenity Prevalence
Amenity Insights for Maldonado
- Popular amenities like Wifi, Kitchen, Air conditioning are common but not universal. Offering these can provide a competitive edge.
- Warning: Wifi is not universally provided but is considered essential globally. Ensure reliable Wifi is offered.
Recommendations for Hosts
- Consider adding popular differentiators like Wifi or Kitchen to increase appeal.
- Highlight unique or less common amenities you offer (e.g., hot tub, dedicated workspace, EV charger) in your listing description and photos.
- Regularly check competitor amenities in Maldonado to stay competitive.
Maldonado Airbnb Guest Demographics & Profile Analysis (2026)
Guest Profile Summary for Maldonado
- The typical guest profile for Airbnb in Maldonado consists of a mix of domestic (65%) and international guests, often arriving from nearby Montevideo, typically belonging to the Post-2000s (Gen Z/Alpha) group (50%), primarily speaking Spanish or English.
- Domestic travelers account for 64.8% of guests.
- Key international markets include Uruguay (64.8%) and Argentina (10.4%).
- Top languages spoken are Spanish (42.9%) followed by English (34.1%).
- A significant demographic segment is the Post-2000s (Gen Z/Alpha) group, representing 50% of guests.
Recommendations for Hosts
- Target domestic marketing efforts towards travelers from Montevideo and Buenos Aires.
- Tailor amenities and listing descriptions to appeal to the dominant Post-2000s (Gen Z/Alpha) demographic (e.g., highlight fast WiFi, smart home features, local guides).
- Highlight unique local experiences or amenities relevant to the primary guest profile.
- Consider seasonal promotions aligned with peak travel times for key origin markets.
Nearby Short-Term Rental Market Comparison
How does the Maldonado Airbnb market stack up against its neighbors? Compare key performance metrics like average monthly revenue, ADR, and occupancy rates in surrounding areas to understand the broader regional STR landscape.
| Market | Active Properties | Monthly Revenue | Daily Rate | Avg. Occupancy |
|---|---|---|---|---|
| La Barra | 21 | $2,067 | $520.30 | 28% |
| Departamento de Lavalleja | 10 | $1,714 | $114.54 | 45% |
| Arenas de José Ignacio | 27 | $1,462 | $497.77 | 24% |
| San Rafael - El Placer | 121 | $1,397 | $390.47 | 26% |
| Pan de Azúcar | 22 | $1,295 | $221.24 | 23% |
| La Barra | 202 | $1,273 | $369.87 | 28% |
| José Ignacio | 239 | $1,273 | $368.04 | 27% |
| El Edén | 29 | $1,253 | $229.87 | 24% |
| Departamento de Maldonado | 21 | $1,249 | $201.84 | 24% |
| San Carlos | 23 | $1,196 | $184.62 | 27% |