La Barra Airbnb Market Analysis 2026: Short Term Rental Data & Vacation Rental Statistics in Departamento de Maldonado, Uruguay
Is Airbnb profitable in La Barra in 2026? Explore comprehensive Airbnb analytics for La Barra, Departamento de Maldonado, Uruguay to uncover income potential. This 2026 STR market report for La Barra, based on AirROI data from February 2025 to January 2026, reveals key trends in the niche market of 21 active listings.
Whether you're considering an Airbnb investment in La Barra, optimizing your existing vacation rental, or exploring rental arbitrage opportunities, understanding the La Barra Airbnb data is crucial. Leveraging the low regulation environment is key to maximizing your short term rental income potential. Let's dive into the specifics.
Key La Barra Airbnb Performance Metrics Overview
Monthly Airbnb Revenue Variations & Income Potential in La Barra (2026)
Understanding the monthly revenue variations for Airbnb listings in La Barra is key to maximizing your short term rental income potential. Seasonality significantly impacts earnings. Our analysis, based on data from the past 12 months, shows that the peak revenue month for STRs in La Barra is typically January, while September often presents the lowest earnings, highlighting opportunities for strategic pricing adjustments during shoulder and low seasons. Explore the typical Airbnb income in La Barra across different performance tiers:
- Best-in-class properties (Top 10%) achieve $13,525+ monthly, often utilizing dynamic pricing and superior guest experiences.
- Strong performing properties (Top 25%) earn $5,483 or more, indicating effective management and desirable locations/amenities.
- Typical properties (Median) generate around $2,445 per month, representing the average market performance.
- Entry-level properties (Bottom 25%) see earnings around $953, often with potential for optimization.
Average Monthly Airbnb Earnings Trend in La Barra
La Barra Airbnb Occupancy Rate Trends (2026)
Maximize your bookings by understanding the La Barra STR occupancy trends. Seasonal demand shifts significantly influence how often properties are booked. Typically, Januarysees the highest demand (peak season occupancy), while May experiences the lowest (low season). Effective strategies, like adjusting minimum stays or offering promotions, can boost occupancy during slower periods. Here's how different property tiers perform in La Barra:
- Best-in-class properties (Top 10%) achieve 47%+ occupancy, indicating high desirability and potentially optimized availability.
- Strong performing properties (Top 25%) maintain 38% or higher occupancy, suggesting good market fit and guest satisfaction.
- Typical properties (Median) have an occupancy rate around 18%.
- Entry-level properties (Bottom 25%) average 10% occupancy, potentially facing higher vacancy.
Average Monthly Occupancy Rate Trend in La Barra
Average Daily Rate (ADR) Airbnb Trends in La Barra (2026)
Effective short term rental pricing strategy in La Barra involves understanding monthly ADR fluctuations. The Average Daily Rate (ADR) for Airbnb in La Barra typically peaks in January and dips lowest during May. Leveraging Airbnb dynamic pricing tools or strategies based on this seasonality can significantly boost revenue. Here's a look at the typical nightly rates achieved:
- Best-in-class properties (Top 10%) command rates of $1,308+ per night, often due to premium features or locations.
- Strong performing properties (Top 25%) achieve nightly rates of $540 or more.
- Typical properties (Median) charge around $331 per night.
- Entry-level properties (Bottom 25%) earn around $186 per night.
Average Daily Rate (ADR) Trend by Month in La Barra
Get Live La Barra Market Intelligence 👇

Explore Real-time Analytics
Airbnb Seasonality Analysis & Trends in La Barra (2026)
Peak Season (January, April, February)
- Revenue averages $7,631 per month
- Occupancy rates average 38.3%
- Daily rates average $527
Shoulder Season
- Revenue averages $4,210 per month
- Occupancy maintains around 21.6%
- Daily rates hold near $504
Low Season (June, August, September)
- Revenue drops to average $1,886 per month
- Occupancy decreases to average 13.5%
- Daily rates adjust to average $439
Seasonality Insights for La Barra
- The Airbnb seasonality in La Barra shows highly seasonal trends requiring careful strategy. While the sections above show seasonal averages, it's also insightful to look at the extremes:
- During the high season, the absolute peak month showcases La Barra's highest earning potential, with monthly revenues capable of climbing to $9,348, occupancy reaching a high of 46.3%, and ADRs peaking at $647.
- Conversely, the slowest single month of the year, typically falling within the low season, marks the market's lowest point. In this month, revenue might dip to $1,292, occupancy could drop to 11.9%, and ADRs may adjust down to $419.
- Understanding both the seasonal averages and these monthly peaks and troughs in revenue, occupancy, and ADR is crucial for maximizing your Airbnb profit potential in La Barra.
Seasonal Strategies for Maximizing Profit
- Peak Season: Maximize revenue through premium pricing and potentially longer minimum stays. Ensure high availability.
- Low Season: Offer competitive pricing, special promotions (e.g., extended stay discounts), and flexible cancellation policies. Target off-season travelers like remote workers or budget-conscious guests.
- Shoulder Seasons: Implement dynamic pricing that balances peak and low rates. Target weekend travelers or specific events. Offer slightly more flexible terms than peak season.
- Regularly analyze your own performance against these La Barra seasonality benchmarks and adjust your pricing and availability strategy accordingly.
Best Areas for Airbnb Investment in La Barra (2026)
Exploring the top neighborhoods for short-term rentals in La Barra? This section highlights key areas, outlining why they are attractive for hosts and guests, along with notable local attractions. Consider these locations based on your target guest profile and investment strategy.
| Neighborhood / Area | Why Host Here? (Target Guests & Appeal) | Key Attractions & Landmarks |
|---|---|---|
| Punta de la Barra | A picturesque beach area known for its tranquility and natural beauty. It attracts families and couples looking for a peaceful getaway with easy access to beach activities. | La Barra Beach, Punta del Este, Local artisan shops, Restaurants and cafes, Scenic walking paths |
| Laguna del Diario | A stunning lagoon area that offers water sports and activities. It’s perfect for tourists looking for a mix of relaxation and adventure. | Water sports, Fishing, Bird watching, Picnic areas, Nature trails |
| Barra de Maldonado | An attractive residential area that offers a local experience and a close-knit community feel. Suitable for visitors interested in a quieter, more authentic stay. | Local markets, Cultural events, Proximity to main attractions in Punta del Este, Family-friendly parks, Community gatherings |
| El Chorro | This area is known for its beautiful landscapes and upscale properties. Ideal for those who want luxury combined with nature. | Scenic views, Hiking trails, Upscale restaurants, Exclusive beaches, Nature reserves |
| La Posta del Cangrejo | A charming area popular with travelers looking for unique accommodations and local culture. It offers a great mix of relaxation and local entertainment. | Local dining, Cultural festivals, Art galleries, Beach access, Nightlife spots |
| Playa Brava | Famous for its surf and nightlife, Playa Brava is a hot spot for younger travelers and beach lovers. It's a vibrant area with plenty to do. | Surfing spots, Beach bars, Clubs and nightlife, Art installations, Beachside markets |
| Las Dunas | Known for its incredible sand dunes and natural parks. Great for nature lovers and families, it offers a different experience from traditional beach areas. | Sand dune exploring, Nature walks, Photography opportunities, Wildlife viewing, Picnic spots |
| Bikini Beach | A cozy beach area popular with families and young travelers alike for its relaxed vibe and beautiful sunrises. It’s great for those looking to unwind by the sea. | Gentle waves for kids, Sunbathing spots, Local food trucks, Yoga on the beach, Beach sports |
Understanding Airbnb License Requirements & STR Laws in La Barra (2026)
While La Barra, Departamento de Maldonado, Uruguay currently shows low STR regulations, specific Airbnb license requirements might still exist or change. Always verify the latest short term rental regulations and Airbnb license requirements directly with local government authorities for La Barra to ensure full compliance before hosting.
(Source: AirROI data, 2026, finding no licensed listings among those analyzed)
Top Performing Airbnb Properties in La Barra (2026)
Benchmark your potential! Explore examples of top-performing Airbnb properties in La Barrabased on Trailing Twelve Month (TTM) revenue. Analyze their characteristics, revenue, occupancy rate, and ADR to understand what drives success in this market.
Dawn
Entire Place • 8 bedrooms

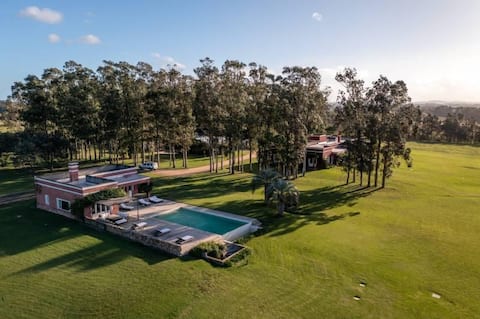
Spectacular La Encandilada Ranch - Punta del Este
Entire Place • 8 bedrooms
Cardones del Este | Exclusive Manantiales neighborhood
Entire Place • 3 bedrooms
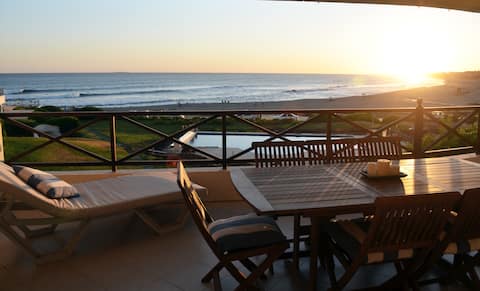
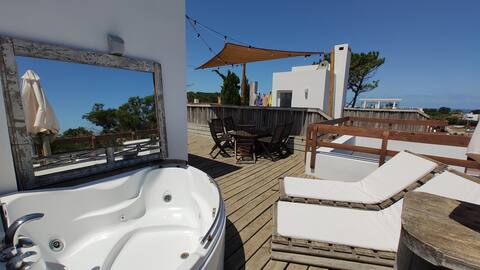
APARTMENT WITH TERRACE. UNIQUE VIEW A FEW METERS FROM THE SEA!!
Entire Place • 3 bedrooms

Vila in La Barra suited for memorable reunions
Entire Place • 7 bedrooms

Hermosa Casa en El Quijote Chacras
Entire Place • 5 bedrooms
Note: Performance varies based on location, size, amenities, seasonality, and management quality. Data reflects the past 12 months.
Top Performing Airbnb Hosts in La Barra (2026)
Learn from the best! This table showcases top-performing Airbnb hosts in La Barra based on the number of properties managed and estimated total revenue over the past year. Analyze their scale and performance metrics.
| Host Name | Properties | Grossing Revenue | Stay Reviews | Avg Rating |
|---|---|---|---|---|
| Santiago | 1 | $156,974 | 4 | 5.00/5.0 |
| Natalia | 1 | $137,186 | 37 | 4.92/5.0 |
| Ezequiel | 1 | $37,403 | 21 | 4.95/5.0 |
| Nicolas | 1 | $35,785 | 9 | 5.00/5.0 |
| Guillermo Gustavo | 3 | $22,355 | 20 | 4.93/5.0 |
| Diego Martin | 1 | $16,465 | 3 | 5.00/5.0 |
| Eduardo | 1 | $16,172 | 44 | 4.80/5.0 |
| Sara | 1 | $14,290 | 49 | 4.86/5.0 |
| Leticia | 1 | $14,118 | 8 | 4.50/5.0 |
| Ines | 1 | $11,810 | 9 | 4.89/5.0 |
Analyzing the strategies of top hosts, such as their property selection, pricing, and guest communication, can offer valuable lessons for optimizing your own Airbnb operations in La Barra.
Dive Deeper: Advanced La Barra STR Market Data (2026)
Ready to unlock more insights? AirROI provides access to advanced metrics and comprehensive Airbnb data for La Barra. Explore detailed analytics beyond this report to refine your investment strategy, optimize pricing, and maximize your vacation rental profits.
Explore Advanced MetricsLa Barra Short-Term Rental Market Composition (2026): Property & Room Types
Room Type Distribution
Property Type Distribution
Market Composition Insights for La Barra
- The La Barra Airbnb market composition is heavily skewed towards Entire Home/Apt listings, which make up 95.2% of the 21 active rentals. This indicates strong guest preference for privacy and space.
- Looking at the property type distribution in La Barra, House properties are the most common (52.4%), reflecting the local real estate landscape.
- Houses represent a significant 52.4% portion, catering likely to families or larger groups.
- The presence of 19% Hotel/Boutique listings indicates integration with traditional hospitality.
- Smaller segments like others, unique stays (combined 9.6%) offer potential for unique stay experiences.
La Barra Airbnb Room Capacity Analysis (2026): Bedroom Distribution
Distribution of Listings by Number of Bedrooms
Room Capacity Insights for La Barra
- The dominant room capacity in La Barra is 3 bedrooms listings, making up 23.8% of the market. This suggests a strong demand for properties suitable for families or small groups.
- Together, 3 bedrooms and 5+ bedrooms properties represent 47.6% of the active Airbnb listings in La Barra, indicating a high concentration in these sizes.
- A significant 57.1% of listings offer 3+ bedrooms, catering to larger groups and families seeking more space in La Barra.
La Barra Vacation Rental Guest Capacity Trends (2026)
Distribution of Listings by Guest Capacity
Guest Capacity Insights for La Barra
- The most common guest capacity trend in La Barra vacation rentals is listings accommodating 8+ guests (38.1%). This suggests the primary traveler segment is likely larger groups.
- Properties designed for 8+ guests and 4 guests dominate the La Barra STR market, accounting for 61.9% of listings.
- 57.1% of properties accommodate 6+ guests, serving the market segment for larger families or group travel in La Barra.
- On average, properties in La Barra are equipped to host 5.5 guests.
La Barra Airbnb Booking Patterns (2026): Available vs. Booked Days
Available Days Distribution
Booked Days Distribution
Booking Pattern Insights for La Barra
- The most common availability pattern in La Barra falls within the 271-366 days range, representing 95.2% of listings. This suggests many properties have significant open periods on their calendars.
- Approximately 100.0% of listings show high availability (181+ days open annually), indicating potential for increased bookings or specific owner usage patterns.
- For booked days, the 1-30 days range is most frequent in La Barra (52.4%), reflecting common guest stay durations or potential owner blocking patterns.
La Barra Airbnb Minimum Stay Requirements Analysis
Distribution of Listings by Minimum Night Requirement
1 Night
2 listings
9.5% of total
2 Nights
6 listings
28.6% of total
7-29 Nights
2 listings
9.5% of total
30+ Nights
11 listings
52.4% of total
Key Insights
- The most prevalent minimum stay requirement in La Barra is 30+ Nights, adopted by 52.4% of listings. This highlights the market's preference for longer commitments.
- A significant segment (52.4%) caters to monthly stays (30+ nights) in La Barra, pointing to opportunities in the extended-stay market.
Recommendations
- Align with the market by considering a 30+ Nights minimum stay, as 52.4% of La Barra hosts use this setting.
- If feasible, allowing 1-night stays, especially midweek or during low season, could capture last-minute bookings, as only 9.5% currently do.
- Explore offering discounts for stays of 30+ nights to attract the 52.4% of the market seeking extended stays.
- Adjust minimum nights based on seasonality – potentially shorter during low season and longer during peak demand periods in La Barra.
La Barra Airbnb Cancellation Policy Trends Analysis (2026)
Flexible
6 listings
28.6% of total
Moderate
3 listings
14.3% of total
Firm
7 listings
33.3% of total
Strict
5 listings
23.8% of total
Cancellation Policy Insights for La Barra
- The prevailing Airbnb cancellation policy trend in La Barra is Firm, used by 33.3% of listings.
- A majority (57.1%) of hosts in La Barra utilize Firm or Strict policies, indicating a market where hosts prioritize booking security.
Recommendations for Hosts
- Consider adopting a Firm policy to align with the 33.3% market standard in La Barra.
- Regularly review your cancellation policy against competitors and market demand shifts in La Barra.
La Barra STR Booking Lead Time Analysis (2026)
Average Booking Lead Time by Month
Booking Lead Time Insights for La Barra
- The overall average booking lead time for vacation rentals in La Barra is 43 days.
- Guests book furthest in advance for stays during January (average 55 days), likely coinciding with peak travel demand or local events.
- The shortest booking windows occur for stays in June (average 2 days), indicating more last-minute travel plans during this time.
- Seasonally, Winter (48 days avg.) sees the longest lead times, while Summer (10 days avg.) has the shortest, reflecting typical travel planning cycles.
Recommendations for Hosts
- Use the overall average lead time (43 days) as a baseline for your pricing and availability strategy in La Barra.
- For January stays, consider implementing length-of-stay discounts or slightly higher rates for bookings made less than 55 days out to capitalize on advance planning.
- During June, focus on last-minute booking availability and promotions, as guests book with very short notice (2 days avg.).
- Target marketing efforts for the Winter season well in advance (at least 48 days) to capture early planners.
- Monitor your own booking lead times against these La Barra averages to identify opportunities for dynamic pricing adjustments.
Popular & Essential Airbnb Amenities in La Barra (2026)
Amenity Prevalence
Amenity Insights for La Barra
- Essential amenities in La Barra that guests expect include: Free parking on premises, Wifi. Lacking these (any) could significantly impact bookings.
- Popular amenities like Air conditioning, TV, Kitchen are common but not universal. Offering these can provide a competitive edge.
Recommendations for Hosts
- Ensure your listing includes all essential amenities for La Barra: Free parking on premises, Wifi.
- Prioritize adding missing essentials: Wifi.
- Consider adding popular differentiators like Air conditioning or TV to increase appeal.
- Highlight unique or less common amenities you offer (e.g., hot tub, dedicated workspace, EV charger) in your listing description and photos.
- Regularly check competitor amenities in La Barra to stay competitive.
La Barra Airbnb Guest Demographics & Profile Analysis (2026)
Guest Profile Summary for La Barra
- The typical guest profile for Airbnb in La Barra consists of a mix of domestic (57%) and international guests, often arriving from nearby Montevideo, typically belonging to the Post-2000s (Gen Z/Alpha) group (50%), primarily speaking Spanish or English.
- Domestic travelers account for 56.7% of guests.
- Key international markets include Uruguay (56.7%) and United States (23.3%).
- Top languages spoken are Spanish (45.2%) followed by English (38.7%).
- A significant demographic segment is the Post-2000s (Gen Z/Alpha) group, representing 50% of guests.
Recommendations for Hosts
- Balance marketing efforts between domestic and international channels based on the guest mix.
- Tailor amenities and listing descriptions to appeal to the dominant Post-2000s (Gen Z/Alpha) demographic (e.g., highlight fast WiFi, smart home features, local guides).
- Highlight unique local experiences or amenities relevant to the primary guest profile.
- Consider seasonal promotions aligned with peak travel times for key origin markets.
Nearby Short-Term Rental Market Comparison
How does the La Barra Airbnb market stack up against its neighbors? Compare key performance metrics like average monthly revenue, ADR, and occupancy rates in surrounding areas to understand the broader regional STR landscape.
| Market | Active Properties | Monthly Revenue | Daily Rate | Avg. Occupancy |
|---|---|---|---|---|
| Departamento de Lavalleja | 10 | $1,714 | $114.54 | 45% |
| Arenas de José Ignacio | 27 | $1,462 | $497.77 | 24% |
| San Rafael - El Placer | 121 | $1,397 | $390.47 | 26% |
| Pan de Azúcar | 22 | $1,295 | $221.24 | 23% |
| La Barra | 202 | $1,273 | $369.87 | 28% |
| José Ignacio | 239 | $1,273 | $368.04 | 27% |
| El Edén | 29 | $1,253 | $229.87 | 24% |
| Departamento de Maldonado | 21 | $1,249 | $201.84 | 24% |
| San Carlos | 23 | $1,196 | $184.62 | 27% |
| Punta Ballena | 580 | $1,123 | $197.80 | 30% |