Wilson Airbnb Market Analysis 2026: Short Term Rental Data & Vacation Rental Statistics in Wyoming, United States
Is Airbnb profitable in Wilson in 2026? Explore comprehensive Airbnb analytics for Wilson, Wyoming, United States to uncover income potential. This 2026 STR market report for Wilson, based on AirROI data from February 2025 to January 2026, reveals key trends in the market of 259 active listings.
Whether you're considering an Airbnb investment in Wilson, optimizing your existing vacation rental, or exploring rental arbitrage opportunities, understanding the Wilson Airbnb data is crucial. Leveraging the low regulation environment is key to maximizing your short term rental income potential. Let's dive into the specifics.
Key Wilson Airbnb Performance Metrics Overview
Monthly Airbnb Revenue Variations & Income Potential in Wilson (2026)
Understanding the monthly revenue variations for Airbnb listings in Wilson is key to maximizing your short term rental income potential. Seasonality significantly impacts earnings. Our analysis, based on data from the past 12 months, shows that the peak revenue month for STRs in Wilson is typically July, while April often presents the lowest earnings, highlighting opportunities for strategic pricing adjustments during shoulder and low seasons. Explore the typical Airbnb income in Wilson across different performance tiers:
- Best-in-class properties (Top 10%) achieve $10,317+ monthly, often utilizing dynamic pricing and superior guest experiences.
- Strong performing properties (Top 25%) earn $7,596 or more, indicating effective management and desirable locations/amenities.
- Typical properties (Median) generate around $5,566 per month, representing the average market performance.
- Entry-level properties (Bottom 25%) see earnings around $3,742, often with potential for optimization.
Average Monthly Airbnb Earnings Trend in Wilson
Wilson Airbnb Occupancy Rate Trends (2026)
Maximize your bookings by understanding the Wilson STR occupancy trends. Seasonal demand shifts significantly influence how often properties are booked. Typically, Augustsees the highest demand (peak season occupancy), while December experiences the lowest (low season). Effective strategies, like adjusting minimum stays or offering promotions, can boost occupancy during slower periods. Here's how different property tiers perform in Wilson:
- Best-in-class properties (Top 10%) achieve 81%+ occupancy, indicating high desirability and potentially optimized availability.
- Strong performing properties (Top 25%) maintain 66% or higher occupancy, suggesting good market fit and guest satisfaction.
- Typical properties (Median) have an occupancy rate around 48%.
- Entry-level properties (Bottom 25%) average 29% occupancy, potentially facing higher vacancy.
Average Monthly Occupancy Rate Trend in Wilson
Average Daily Rate (ADR) Airbnb Trends in Wilson (2026)
Effective short term rental pricing strategy in Wilson involves understanding monthly ADR fluctuations. The Average Daily Rate (ADR) for Airbnb in Wilson typically peaks in July and dips lowest during April. Leveraging Airbnb dynamic pricing tools or strategies based on this seasonality can significantly boost revenue. Here's a look at the typical nightly rates achieved:
- Best-in-class properties (Top 10%) command rates of $850+ per night, often due to premium features or locations.
- Strong performing properties (Top 25%) achieve nightly rates of $505 or more.
- Typical properties (Median) charge around $367 per night.
- Entry-level properties (Bottom 25%) earn around $293 per night.
Average Daily Rate (ADR) Trend by Month in Wilson
Get Live Wilson Market Intelligence 👇

Explore Real-time Analytics
Airbnb Seasonality Analysis & Trends in Wilson (2026)
Peak Season (July, August, June)
- Revenue averages $10,051 per month
- Occupancy rates average 66.1%
- Daily rates average $544
Shoulder Season
- Revenue averages $5,725 per month
- Occupancy maintains around 48.7%
- Daily rates hold near $478
Low Season (April, November, December)
- Revenue drops to average $3,340 per month
- Occupancy decreases to average 27.9%
- Daily rates adjust to average $461
Seasonality Insights for Wilson
- The Airbnb seasonality in Wilson shows highly seasonal trends requiring careful strategy. While the sections above show seasonal averages, it's also insightful to look at the extremes:
- During the high season, the absolute peak month showcases Wilson's highest earning potential, with monthly revenues capable of climbing to $10,758, occupancy reaching a high of 68.8%, and ADRs peaking at $558.
- Conversely, the slowest single month of the year, typically falling within the low season, marks the market's lowest point. In this month, revenue might dip to $2,253, occupancy could drop to 26.5%, and ADRs may adjust down to $396.
- Understanding both the seasonal averages and these monthly peaks and troughs in revenue, occupancy, and ADR is crucial for maximizing your Airbnb profit potential in Wilson.
Seasonal Strategies for Maximizing Profit
- Peak Season: Maximize revenue through premium pricing and potentially longer minimum stays. Ensure high availability.
- Low Season: Offer competitive pricing, special promotions (e.g., extended stay discounts), and flexible cancellation policies. Target off-season travelers like remote workers or budget-conscious guests.
- Shoulder Seasons: Implement dynamic pricing that balances peak and low rates. Target weekend travelers or specific events. Offer slightly more flexible terms than peak season.
- Regularly analyze your own performance against these Wilson seasonality benchmarks and adjust your pricing and availability strategy accordingly.
Best Areas for Airbnb Investment in Wilson (2026)
Exploring the top neighborhoods for short-term rentals in Wilson? This section highlights key areas, outlining why they are attractive for hosts and guests, along with notable local attractions. Consider these locations based on your target guest profile and investment strategy.
| Neighborhood / Area | Why Host Here? (Target Guests & Appeal) | Key Attractions & Landmarks |
|---|---|---|
| Teton Village | Popular destination for skiing and outdoor activities, Teton Village attracts visitors year-round. The area's proximity to Jackson Hole Mountain Resort makes it ideal for winter sports enthusiasts and summer hikers alike. | Jackson Hole Mountain Resort, Aerial Tram, Teton Village Market, National Elk Refuge, Nearby hiking trails |
| Jackson Hole | Known for its stunning landscapes and vibrant arts scene, Jackson Hole is a favorite among tourists seeking a mix of outdoor adventure and cultural experiences. The town often draws families and outdoor lovers. | Grand Teton National Park, National Museum of Wildlife Art, Jackson Town Square, Elk Refuge, Snow King Mountain |
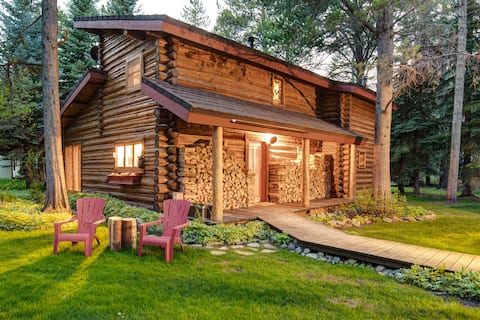
| Wilson | A quaint and charming town known for its proximity to Jackson and the entrance to Grand Teton National Park. It offers a peaceful retreat for tourists looking to escape the hustle and bustle, while still being close to popular attractions. | Grand Teton National Park, Wilson Wetlands, Local shops and cafes, Nearby hiking trails, Scenic views of the Teton Range |
| South Park Loop | Offers a more residential feel with beautiful scenic views, ideal for families and outdoor enthusiasts who prefer a quieter location while still being near Jackson and outdoor adventures. | South Park Loop Road, Eagle West and Eagle South trails, Snowshoeing and cross-country skiing, Biking paths, Peaceful, scenic views |
| North of Town | This area features larger homes and plenty of space, making it perfect for groups and families. The scenic drives and the elevated views of the Tetons can be very appealing to potential guests. | Scenic overlooks, Rustic cabins, Nearby Yellowstone National Park, Peaceful atmosphere, Proximity to trails and outdoor activities |
| Hogle's Place | A small, quiet neighborhood great for families or small groups looking for a homely feel. Close to parks and local amenities, this area offers a comfortable stay at a reasonable distance from the main attractions. | Local parks, Community events, Family-friendly environment, Access to outdoor activities, Scenic drives |
| Aspens | Known for its luxurious homes and easy access to skiing and hiking trails, Aspens is an ideal choice for affluent travelers and those looking for a high-end vacation experience. | Aspens Market, Golf courses, Nearby ski resorts, Wealth of hiking opportunities, Natural beauty |
| Moran | Located close to Grand Teton and Yellowstone National Parks, Moran attracts explorers and nature lovers seeking adventure or peaceful getaways surrounded by nature. | Grand Teton National Park, Yellowstone National Park, Scenic viewpoints, Wildlife viewing opportunities, Outdoor recreational activities |
Understanding Airbnb License Requirements & STR Laws in Wilson (2026)
While Wilson, Wyoming, United States currently shows low STR regulations, specific Airbnb license requirements might still exist or change. Always verify the latest short term rental regulations and Airbnb license requirements directly with local government authorities for Wilson to ensure full compliance before hosting.
(Source: AirROI data, 2026, finding no licensed listings among those analyzed)
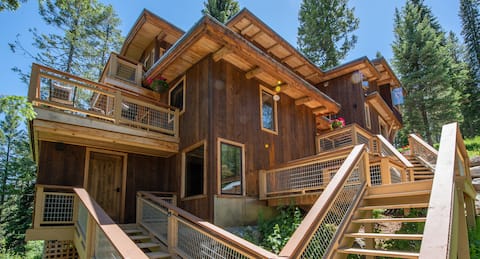
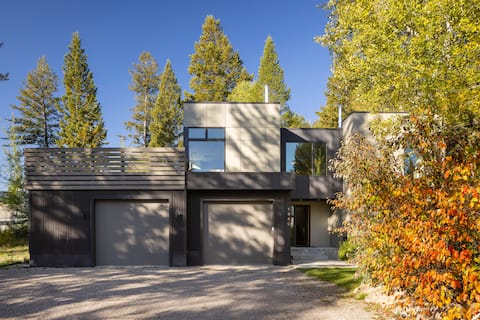
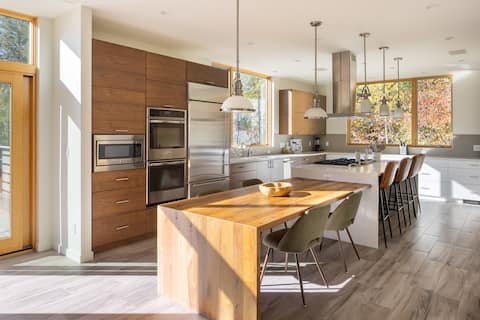
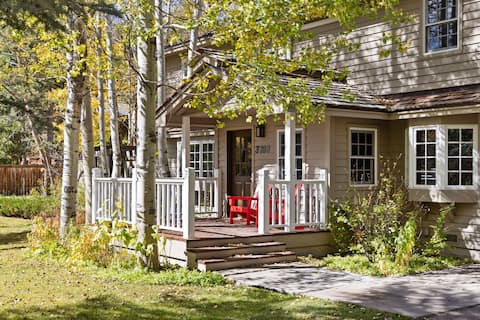
Top Performing Airbnb Properties in Wilson (2026)
Benchmark your potential! Explore examples of top-performing Airbnb properties in Wilsonbased on Trailing Twelve Month (TTM) revenue. Analyze their characteristics, revenue, occupancy rate, and ADR to understand what drives success in this market.
Jackson Hole Hideout Entire Home, Breakfast/Snacks
Entire Place • 5 bedrooms
Luxury modern estate with guest house
Entire Place • 6 bedrooms
Luxury modern retreat
Entire Place • 4 bedrooms

Luxury Modern Floating in trees
Entire Place • 4 bedrooms
Outpost: Aspens House with Private Hot Tub & AC
Entire Place • 5 bedrooms
Abode at the Aspens | Secluded Fish Creek Mountain Retreat | Hot Tub | Close to Village & NP
Entire Place • 4 bedrooms
Note: Performance varies based on location, size, amenities, seasonality, and management quality. Data reflects the past 12 months.
Top Performing Airbnb Hosts in Wilson (2026)
Learn from the best! This table showcases top-performing Airbnb hosts in Wilson based on the number of properties managed and estimated total revenue over the past year. Analyze their scale and performance metrics.
| Host Name | Properties | Grossing Revenue | Stay Reviews | Avg Rating |
|---|---|---|---|---|
| Outpost | 57 | $4,149,336 | 3456 | 4.81/5.0 |
| Rendezvous Mountain | 42 | $1,728,330 | 277 | 4.82/5.0 |
| Jackson Hole Resort Lodging | 21 | $1,025,933 | 449 | 4.82/5.0 |
| Alissa | 4 | $601,970 | 64 | 4.87/5.0 |
| Abode Luxury Rentals | 5 | $349,203 | 43 | 4.95/5.0 |
| Adi | 6 | $339,488 | 485 | 4.96/5.0 |
| Apex Property Management, LLC | 5 | $272,656 | 190 | 4.83/5.0 |
| Vacasa Jackson Hole | 14 | $266,763 | 528 | 4.80/5.0 |
| Ian | 2 | $207,046 | 102 | 4.94/5.0 |
| Derek | 1 | $195,236 | 11 | 5.00/5.0 |
Analyzing the strategies of top hosts, such as their property selection, pricing, and guest communication, can offer valuable lessons for optimizing your own Airbnb operations in Wilson.
Dive Deeper: Advanced Wilson STR Market Data (2026)
Ready to unlock more insights? AirROI provides access to advanced metrics and comprehensive Airbnb data for Wilson. Explore detailed analytics beyond this report to refine your investment strategy, optimize pricing, and maximize your vacation rental profits.
Explore Advanced MetricsWilson Short-Term Rental Market Composition (2026): Property & Room Types
Room Type Distribution
Property Type Distribution
Market Composition Insights for Wilson
- The Wilson Airbnb market composition is heavily skewed towards Entire Home/Apt listings, which make up 96.1% of the 259 active rentals. This indicates strong guest preference for privacy and space.
- Looking at the property type distribution in Wilson, Apartment/Condo properties are the most common (68.7%), reflecting the local real estate landscape.
- Houses represent a significant 24.7% portion, catering likely to families or larger groups.
- Smaller segments like hotel/boutique, outdoor/unique (combined 6.6%) offer potential for unique stay experiences.
Wilson Airbnb Room Capacity Analysis (2026): Bedroom Distribution
Distribution of Listings by Number of Bedrooms
Room Capacity Insights for Wilson
- The dominant room capacity in Wilson is 2 bedrooms listings, making up 36.7% of the market. This suggests a strong demand for properties suitable for couples or solo travelers.
- Together, 2 bedrooms and 1 bedroom properties represent 66.8% of the active Airbnb listings in Wilson, indicating a high concentration in these sizes.
- A significant 29.8% of listings offer 3+ bedrooms, catering to larger groups and families seeking more space in Wilson.
Wilson Vacation Rental Guest Capacity Trends (2026)
Distribution of Listings by Guest Capacity
Guest Capacity Insights for Wilson
- The most common guest capacity trend in Wilson vacation rentals is listings accommodating 6 guests (31.3%). This suggests the primary traveler segment is likely larger groups.
- Properties designed for 6 guests and 4 guests dominate the Wilson STR market, accounting for 56.8% of listings.
- 51.3% of properties accommodate 6+ guests, serving the market segment for larger families or group travel in Wilson.
- On average, properties in Wilson are equipped to host 5.3 guests.
Wilson Airbnb Booking Patterns (2026): Available vs. Booked Days
Available Days Distribution
Booked Days Distribution
Booking Pattern Insights for Wilson
- The most common availability pattern in Wilson falls within the 181-270 days range, representing 39.4% of listings. This suggests many properties have significant open periods on their calendars.
- Approximately 71.8% of listings show high availability (181+ days open annually), indicating potential for increased bookings or specific owner usage patterns.
- For booked days, the 91-180 days range is most frequent in Wilson (40.9%), reflecting common guest stay durations or potential owner blocking patterns.
- A notable 29.0% of properties secure long booking periods (181+ days booked per year), highlighting successful long-term rental strategies or significant owner usage.
Wilson Airbnb Minimum Stay Requirements Analysis
Distribution of Listings by Minimum Night Requirement
1 Night
21 listings
8.1% of total
2 Nights
14 listings
5.4% of total
3 Nights
42 listings
16.2% of total
4-6 Nights
20 listings
7.7% of total
7-29 Nights
11 listings
4.2% of total
30+ Nights
151 listings
58.3% of total
Key Insights
- The most prevalent minimum stay requirement in Wilson is 30+ Nights, adopted by 58.3% of listings. This highlights the market's preference for longer commitments.
- Very short stays (1-2 nights) are less common (13.5%), suggesting hosts prefer slightly longer bookings to optimize turnover.
- A significant segment (58.3%) caters to monthly stays (30+ nights) in Wilson, pointing to opportunities in the extended-stay market.
Recommendations
- Align with the market by considering a 30+ Nights minimum stay, as 58.3% of Wilson hosts use this setting.
- If feasible, allowing 1-night stays, especially midweek or during low season, could capture last-minute bookings, as only 8.1% currently do.
- Explore offering discounts for stays of 30+ nights to attract the 58.3% of the market seeking extended stays.
- Adjust minimum nights based on seasonality – potentially shorter during low season and longer during peak demand periods in Wilson.
Wilson Airbnb Cancellation Policy Trends Analysis (2026)
Super Strict 30 Days
87 listings
33.6% of total
Super Strict 60 Days
5 listings
1.9% of total
Flexible
4 listings
1.5% of total
Moderate
18 listings
6.9% of total
Firm
91 listings
35.1% of total
Strict
54 listings
20.8% of total
Cancellation Policy Insights for Wilson
- The prevailing Airbnb cancellation policy trend in Wilson is Firm, used by 35.1% of listings.
- A majority (55.9%) of hosts in Wilson utilize Firm or Strict policies, indicating a market where hosts prioritize booking security.
Recommendations for Hosts
- Consider adopting a Firm policy to align with the 35.1% market standard in Wilson.
- Regularly review your cancellation policy against competitors and market demand shifts in Wilson.
Wilson STR Booking Lead Time Analysis (2026)
Average Booking Lead Time by Month
Booking Lead Time Insights for Wilson
- The overall average booking lead time for vacation rentals in Wilson is 81 days.
- Guests book furthest in advance for stays during September (average 115 days), likely coinciding with peak travel demand or local events.
- The shortest booking windows occur for stays in November (average 55 days), indicating more last-minute travel plans during this time.
- Seasonally, Summer (91 days avg.) sees the longest lead times, while Spring (69 days avg.) has the shortest, reflecting typical travel planning cycles.
Recommendations for Hosts
- Use the overall average lead time (81 days) as a baseline for your pricing and availability strategy in Wilson.
- For September stays, consider implementing length-of-stay discounts or slightly higher rates for bookings made less than 115 days out to capitalize on advance planning.
- Target marketing efforts for the Summer season well in advance (at least 91 days) to capture early planners.
- Monitor your own booking lead times against these Wilson averages to identify opportunities for dynamic pricing adjustments.
Popular & Essential Airbnb Amenities in Wilson (2026)
Amenity Prevalence
Amenity Insights for Wilson
- Essential amenities in Wilson that guests expect include: Wifi, Heating, Free parking on premises, Smoke alarm, TV, Essentials, Kitchen, Washer. Lacking these (any) could significantly impact bookings.
- Popular amenities like Hair dryer, Dryer are common but not universal. Offering these can provide a competitive edge.
Recommendations for Hosts
- Ensure your listing includes all essential amenities for Wilson: Wifi, Heating, Free parking on premises, Smoke alarm, TV, Essentials, Kitchen, Washer.
- Prioritize adding missing essentials: Heating, Free parking on premises, Smoke alarm, TV, Essentials, Kitchen, Washer.
- Consider adding popular differentiators like Hair dryer or Dryer to increase appeal.
- Highlight unique or less common amenities you offer (e.g., hot tub, dedicated workspace, EV charger) in your listing description and photos.
- Regularly check competitor amenities in Wilson to stay competitive.
Wilson Airbnb Guest Demographics & Profile Analysis (2026)
Guest Profile Summary for Wilson
- The typical guest profile for Airbnb in Wilson consists of primarily domestic travelers (96%), often arriving from nearby New York, typically belonging to the Post-2000s (Gen Z/Alpha) group (50%), primarily speaking English or Spanish.
- Domestic travelers account for 96.3% of guests.
- Key international markets include United States (96.3%) and DC (0.7%).
- Top languages spoken are English (72.1%) followed by Spanish (10.2%).
- A significant demographic segment is the Post-2000s (Gen Z/Alpha) group, representing 50% of guests.
Recommendations for Hosts
- Target domestic marketing efforts towards travelers from New York and Denver.
- Tailor amenities and listing descriptions to appeal to the dominant Post-2000s (Gen Z/Alpha) demographic (e.g., highlight fast WiFi, smart home features, local guides).
- Highlight unique local experiences or amenities relevant to the primary guest profile.
- Consider seasonal promotions aligned with peak travel times for key origin markets.
Nearby Short-Term Rental Market Comparison
How does the Wilson Airbnb market stack up against its neighbors? Compare key performance metrics like average monthly revenue, ADR, and occupancy rates in surrounding areas to understand the broader regional STR landscape.
| Market | Active Properties | Monthly Revenue | Daily Rate | Avg. Occupancy |
|---|---|---|---|---|
| Teton Village | 283 | $8,166 | $913.82 | 43% |
| Jackson | 349 | $6,568 | $588.79 | 47% |
| Fish Haven | 61 | $6,044 | $855.41 | 33% |
| Island Park | 1,029 | $4,306 | $436.45 | 47% |
| Driggs | 374 | $3,923 | $330.77 | 49% |
| Tetonia | 113 | $3,918 | $334.73 | 47% |
| West Yellowstone | 293 | $3,896 | $390.58 | 45% |
| Victor | 338 | $3,570 | $339.17 | 49% |
| Alpine | 48 | $3,421 | $369.84 | 43% |
| Ashton | 99 | $3,082 | $364.25 | 43% |