Dayton Airbnb Market Analysis 2025: Short Term Rental Data & Vacation Rental Statistics in Wyoming, United States
Is Airbnb profitable in Dayton in 2025? Explore comprehensive Airbnb analytics for Dayton, Wyoming, United States to uncover income potential. This 2025 STR market report for Dayton, based on AirROI data from November 2024 to October 2025, reveals key trends in the niche market of 18 active listings.
Whether you're considering an Airbnb investment in Dayton, optimizing your existing vacation rental, or exploring rental arbitrage opportunities, understanding the Dayton Airbnb data is crucial. Leveraging the low regulation environment is key to maximizing your short term rental income potential. Let's dive into the specifics.
Key Dayton Airbnb Performance Metrics Overview
Monthly Airbnb Revenue Variations & Income Potential in Dayton (2025)
Understanding the monthly revenue variations for Airbnb listings in Dayton is key to maximizing your short term rental income potential. Seasonality significantly impacts earnings. Our analysis, based on data from the past 12 months, shows that the peak revenue month for STRs in Dayton is typically July, while January often presents the lowest earnings, highlighting opportunities for strategic pricing adjustments during shoulder and low seasons. Explore the typical Airbnb income in Dayton across different performance tiers:
- Best-in-class properties (Top 10%) achieve $4,947+ monthly, often utilizing dynamic pricing and superior guest experiences.
- Strong performing properties (Top 25%) earn $2,777 or more, indicating effective management and desirable locations/amenities.
- Typical properties (Median) generate around $1,650 per month, representing the average market performance.
- Entry-level properties (Bottom 25%) see earnings around $1,048, often with potential for optimization.
Average Monthly Airbnb Earnings Trend in Dayton
Dayton Airbnb Occupancy Rate Trends (2025)
Maximize your bookings by understanding the Dayton STR occupancy trends. Seasonal demand shifts significantly influence how often properties are booked. Typically, Julysees the highest demand (peak season occupancy), while March experiences the lowest (low season). Effective strategies, like adjusting minimum stays or offering promotions, can boost occupancy during slower periods. Here's how different property tiers perform in Dayton:
- Best-in-class properties (Top 10%) achieve 57%+ occupancy, indicating high desirability and potentially optimized availability.
- Strong performing properties (Top 25%) maintain 43% or higher occupancy, suggesting good market fit and guest satisfaction.
- Typical properties (Median) have an occupancy rate around 30%.
- Entry-level properties (Bottom 25%) average 18% occupancy, potentially facing higher vacancy.
Average Monthly Occupancy Rate Trend in Dayton
Average Daily Rate (ADR) Airbnb Trends in Dayton (2025)
Effective short term rental pricing strategy in Dayton involves understanding monthly ADR fluctuations. The Average Daily Rate (ADR) for Airbnb in Dayton typically peaks in July and dips lowest during April. Leveraging Airbnb dynamic pricing tools or strategies based on this seasonality can significantly boost revenue. Here's a look at the typical nightly rates achieved:
- Best-in-class properties (Top 10%) command rates of $440+ per night, often due to premium features or locations.
- Strong performing properties (Top 25%) achieve nightly rates of $247 or more.
- Typical properties (Median) charge around $188 per night.
- Entry-level properties (Bottom 25%) earn around $137 per night.
Average Daily Rate (ADR) Trend by Month in Dayton
Get Live Dayton Market Intelligence 👇

Explore Real-time Analytics
Airbnb Seasonality Analysis & Trends in Dayton (2025)
Peak Season (July, June, September)
- Revenue averages $3,572 per month
- Occupancy rates average 49.2%
- Daily rates average $244
Shoulder Season
- Revenue averages $2,035 per month
- Occupancy maintains around 31.4%
- Daily rates hold near $219
Low Season (January, March, April)
- Revenue drops to average $1,142 per month
- Occupancy decreases to average 19.6%
- Daily rates adjust to average $210
Seasonality Insights for Dayton
- The Airbnb seasonality in Dayton shows highly seasonal trends requiring careful strategy. While the sections above show seasonal averages, it's also insightful to look at the extremes:
- During the high season, the absolute peak month showcases Dayton's highest earning potential, with monthly revenues capable of climbing to $4,783, occupancy reaching a high of 63.6%, and ADRs peaking at $256.
- Conversely, the slowest single month of the year, typically falling within the low season, marks the market's lowest point. In this month, revenue might dip to $1,027, occupancy could drop to 17.1%, and ADRs may adjust down to $202.
- Understanding both the seasonal averages and these monthly peaks and troughs in revenue, occupancy, and ADR is crucial for maximizing your Airbnb profit potential in Dayton.
Seasonal Strategies for Maximizing Profit
- Peak Season: Maximize revenue through premium pricing and potentially longer minimum stays. Ensure high availability.
- Low Season: Offer competitive pricing, special promotions (e.g., extended stay discounts), and flexible cancellation policies. Target off-season travelers like remote workers or budget-conscious guests.
- Shoulder Seasons: Implement dynamic pricing that balances peak and low rates. Target weekend travelers or specific events. Offer slightly more flexible terms than peak season.
- Regularly analyze your own performance against these Dayton seasonality benchmarks and adjust your pricing and availability strategy accordingly.
Best Areas for Airbnb Investment in Dayton (2025)
Exploring the top neighborhoods for short-term rentals in Dayton? This section highlights key areas, outlining why they are attractive for hosts and guests, along with notable local attractions. Consider these locations based on your target guest profile and investment strategy.
| Neighborhood / Area | Why Host Here? (Target Guests & Appeal) | Key Attractions & Landmarks |
|---|---|---|
| Downtown Dayton | The heart of Dayton, featuring a vibrant arts scene, dining, and nightlife. It's attractive to both tourists and business travelers with easy access to attractions and events. | Oregon Historic District, Dayton Dragons Baseball, The Dayton Art Institute, RiverScape MetroPark, Dayton Convention Center |
| Oregon District | A historic neighborhood with charming architecture, eclectic bars, and restaurants. Popular with young adults and those seeking a lively atmosphere for nightlife and arts. | Oregon Historic District, Wright-Dunbar Interpretive Center, famous live music venues, unique boutiques and shops |
| Carillon Historical Park | Home to museums and historical attractions, it draws history enthusiasts and families, featuring the iconic Carillon Bell Tower and outdoor spaces. | Carillon Historical Park, The Wright Brothers National Museum, The Huffman Prairie Flying Field, The Great Miami River Trail |
| University of Dayton | With the University nearby, this area is great for accommodating students, families visiting for campus events, and university-related activities. | University of Dayton, The Victoria Theatre, Student events and performances, River Campus |
| Five Rivers MetroParks | Ideal for nature enthusiasts and families, this area offers outdoor activities and beautiful parks, making it appealing for those looking to unwind in nature. | Hills & Dales MetroPark, Delco Park, Cox Arboretum, The Miami River and its trails |
| Englewood | A suburban area providing a quiet, family-friendly atmosphere, appealing to visitors looking for a peaceful stay while still being close to Dayton attractions. | Englewood MetroPark, Local parks and recreational areas, Dining options, Shopping centers |
| Centerville | Quiet suburban community known for its charming downtown area, parks, and schools. Attractive to families and visitors looking for a relaxed stay. | Centerville-Washington Park District, The Oakwood Historical Society, Local shops and eateries, Parks and recreation areas |
| Harrison Township | A developing area that is becoming more popular for those seeking affordable accommodations while still being close to downtown Dayton and local attractions. | Local parks, Community events, Proximity to Dayton attractions, Affordable dining options |
Understanding Airbnb License Requirements & STR Laws in Dayton (2025)
While Dayton, Wyoming, United States currently shows low STR regulations, specific Airbnb license requirements might still exist or change. Always verify the latest short term rental regulations and Airbnb license requirements directly with local government authorities for Dayton to ensure full compliance before hosting.
(Source: AirROI data, 2025, finding no licensed listings among those analyzed)
Top Performing Airbnb Properties in Dayton (2025)
Benchmark your potential! Explore examples of top-performing Airbnb properties in Daytonbased on Trailing Twelve Month (TTM) revenue. Analyze their characteristics, revenue, occupancy rate, and ADR to understand what drives success in this market.
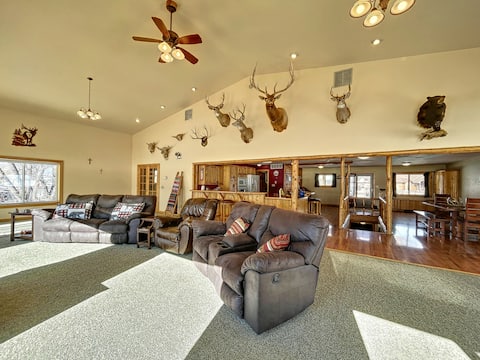
Outstanding mtn view, 5 bdr sleeps 11, 4400sqft
Entire Place • 5 bedrooms
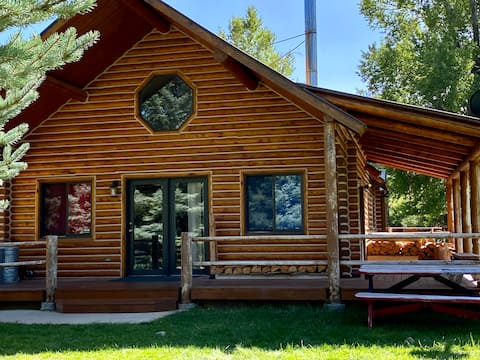
Cabin Creek
Entire Place • 2 bedrooms
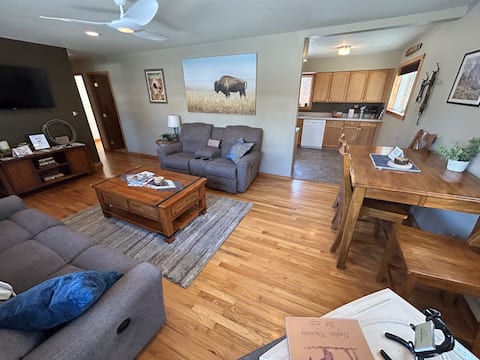
Cowboy Cottage - 3 Bedroom, Private Home
Entire Place • 3 bedrooms
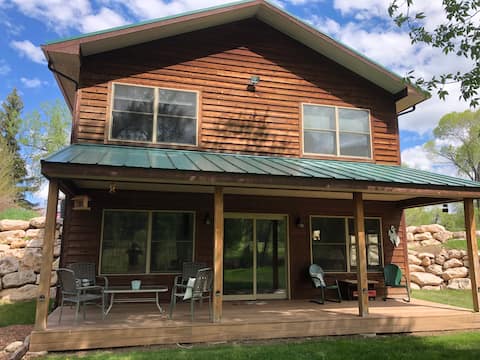
Our Little Tongue River Guest House
Entire Place • 3 bedrooms
Villa by the River
Entire Place • 4 bedrooms
Rustic Ridge Private Three Cabin Retreat
Entire Place • 6 bedrooms
Note: Performance varies based on location, size, amenities, seasonality, and management quality. Data reflects the past 12 months.
Top Performing Airbnb Hosts in Dayton (2025)
Learn from the best! This table showcases top-performing Airbnb hosts in Dayton based on the number of properties managed and estimated total revenue over the past year. Analyze their scale and performance metrics.
| Host Name | Properties | Grossing Revenue | Stay Reviews | Avg Rating |
|---|---|---|---|---|
| Kirby | 1 | $71,059 | 45 | 4.96/5.0 |
| Wanda | 4 | $64,488 | 147 | 4.99/5.0 |
| Dalton | 3 | $43,967 | 140 | 4.76/5.0 |
| Joyce | 1 | $40,181 | 106 | 5.00/5.0 |
| Travis | 2 | $31,562 | 201 | 4.96/5.0 |
| Dalton | 3 | $30,168 | 153 | 4.76/5.0 |
| Aric | 1 | $29,942 | 48 | 4.98/5.0 |
| Geoff | 1 | $26,026 | 133 | 4.99/5.0 |
| Benjamin Todd | 1 | $18,314 | 8 | 5.00/5.0 |
| Ellen | 1 | $5,406 | 3 | 5.00/5.0 |
Analyzing the strategies of top hosts, such as their property selection, pricing, and guest communication, can offer valuable lessons for optimizing your own Airbnb operations in Dayton.
Dive Deeper: Advanced Dayton STR Market Data (2025)
Ready to unlock more insights? AirROI provides access to advanced metrics and comprehensive Airbnb data for Dayton. Explore detailed analytics beyond this report to refine your investment strategy, optimize pricing, and maximize your vacation rental profits.
Explore Advanced MetricsDayton Short-Term Rental Market Composition (2025): Property & Room Types
Room Type Distribution
Property Type Distribution
Market Composition Insights for Dayton
- The Dayton Airbnb market composition is heavily skewed towards Entire Home/Apt listings, which make up 100% of the 18 active rentals. This indicates strong guest preference for privacy and space.
- Looking at the property type distribution in Dayton, Outdoor/Unique properties are the most common (50%), reflecting the local real estate landscape.
- Houses represent a significant 50% portion, catering likely to families or larger groups.
Dayton Airbnb Room Capacity Analysis (2025): Bedroom Distribution
Distribution of Listings by Number of Bedrooms
Room Capacity Insights for Dayton
- The dominant room capacity in Dayton is 1 bedroom listings, making up 38.9% of the market. This suggests a strong demand for properties suitable for couples or solo travelers.
- Together, 1 bedroom and 2 bedrooms properties represent 61.1% of the active Airbnb listings in Dayton, indicating a high concentration in these sizes.
- A significant 38.9% of listings offer 3+ bedrooms, catering to larger groups and families seeking more space in Dayton.
Dayton Vacation Rental Guest Capacity Trends (2025)
Distribution of Listings by Guest Capacity
Guest Capacity Insights for Dayton
- The most common guest capacity trend in Dayton vacation rentals is listings accommodating 8+ guests (33.3%). This suggests the primary traveler segment is likely larger groups.
- Properties designed for 8+ guests and 4 guests dominate the Dayton STR market, accounting for 55.5% of listings.
- 44.4% of properties accommodate 6+ guests, serving the market segment for larger families or group travel in Dayton.
- On average, properties in Dayton are equipped to host 5.3 guests.
Dayton Airbnb Booking Patterns (2025): Available vs. Booked Days
Available Days Distribution
Booked Days Distribution
Booking Pattern Insights for Dayton
- The most common availability pattern in Dayton falls within the 271-366 days range, representing 55.6% of listings. This suggests many properties have significant open periods on their calendars.
- Approximately 100.0% of listings show high availability (181+ days open annually), indicating potential for increased bookings or specific owner usage patterns.
- For booked days, the 31-90 days range is most frequent in Dayton (55.6%), reflecting common guest stay durations or potential owner blocking patterns.
- A notable 5.6% of properties secure long booking periods (181+ days booked per year), highlighting successful long-term rental strategies or significant owner usage.
Dayton Airbnb Minimum Stay Requirements Analysis
Distribution of Listings by Minimum Night Requirement
1 Night
12 listings
66.7% of total
2 Nights
3 listings
16.7% of total
30+ Nights
3 listings
16.7% of total
Key Insights
- The most prevalent minimum stay requirement in Dayton is 1 Night, adopted by 66.7% of listings. This highlights the market's preference for shorter, flexible bookings.
- A strong majority (83.4%) of the Dayton Airbnb data shows acceptance of very short stays (1-2 nights), indicating a dynamic, high-turnover market.
- A significant segment (16.7%) caters to monthly stays (30+ nights) in Dayton, pointing to opportunities in the extended-stay market.
Recommendations
- Align with the market by considering a 1 Night minimum stay, as 66.7% of Dayton hosts use this setting.
- Explore offering discounts for stays of 30+ nights to attract the 16.7% of the market seeking extended stays.
- Adjust minimum nights based on seasonality – potentially shorter during low season and longer during peak demand periods in Dayton.
Dayton Airbnb Cancellation Policy Trends Analysis (2025)
Flexible
4 listings
22.2% of total
Moderate
1 listings
5.6% of total
Firm
8 listings
44.4% of total
Strict
5 listings
27.8% of total
Cancellation Policy Insights for Dayton
- The prevailing Airbnb cancellation policy trend in Dayton is Firm, used by 44.4% of listings.
- A majority (72.2%) of hosts in Dayton utilize Firm or Strict policies, indicating a market where hosts prioritize booking security.
Recommendations for Hosts
- Consider adopting a Firm policy to align with the 44.4% market standard in Dayton.
- Regularly review your cancellation policy against competitors and market demand shifts in Dayton.
Dayton STR Booking Lead Time Analysis (2025)
Average Booking Lead Time by Month
Booking Lead Time Insights for Dayton
- The overall average booking lead time for vacation rentals in Dayton is 55 days.
- Guests book furthest in advance for stays during June (average 129 days), likely coinciding with peak travel demand or local events.
- The shortest booking windows occur for stays in January (average 6 days), indicating more last-minute travel plans during this time.
- Seasonally, Summer (93 days avg.) sees the longest lead times, while Winter (20 days avg.) has the shortest, reflecting typical travel planning cycles.
Recommendations for Hosts
- Use the overall average lead time (55 days) as a baseline for your pricing and availability strategy in Dayton.
- For June stays, consider implementing length-of-stay discounts or slightly higher rates for bookings made less than 129 days out to capitalize on advance planning.
- During January, focus on last-minute booking availability and promotions, as guests book with very short notice (6 days avg.).
- Target marketing efforts for the Summer season well in advance (at least 93 days) to capture early planners.
- Monitor your own booking lead times against these Dayton averages to identify opportunities for dynamic pricing adjustments.
Popular & Essential Airbnb Amenities in Dayton (2025)
Amenity Prevalence
No amenities with partial availability (less than 100%) were found to display in the chart. All essential amenities might be present in all listings. Check insights below.
Amenity Insights for Dayton
- Essential amenities in Dayton that guests expect include: Refrigerator, Microwave, Dishes and silverware, Heating, Smoke alarm, Essentials, Hot water, Coffee maker, Free parking on premises, Wifi. Lacking these (any) could significantly impact bookings.
Recommendations for Hosts
- Ensure your listing includes all essential amenities for Dayton: Refrigerator, Microwave, Dishes and silverware, Heating, Smoke alarm, Essentials, Hot water, Coffee maker, Free parking on premises, Wifi.
- Highlight unique or less common amenities you offer (e.g., hot tub, dedicated workspace, EV charger) in your listing description and photos.
- Regularly check competitor amenities in Dayton to stay competitive.
Dayton Airbnb Guest Demographics & Profile Analysis (2025)
Guest Profile Summary for Dayton
- The typical guest profile for Airbnb in Dayton consists of primarily domestic travelers (97%), often arriving from nearby Billings, typically belonging to the Post-2000s (Gen Z/Alpha) group (50%), primarily speaking English or Spanish.
- Domestic travelers account for 97.4% of guests.
- Key international markets include United States (97.4%) and Australia (1.3%).
- Top languages spoken are English (78.3%) followed by Spanish (11.7%).
- A significant demographic segment is the Post-2000s (Gen Z/Alpha) group, representing 50% of guests.
Recommendations for Hosts
- Target domestic marketing efforts towards travelers from Billings and Rapid City.
- Tailor amenities and listing descriptions to appeal to the dominant Post-2000s (Gen Z/Alpha) demographic (e.g., highlight fast WiFi, smart home features, local guides).
- Highlight unique local experiences or amenities relevant to the primary guest profile.
- Consider seasonal promotions aligned with peak travel times for key origin markets.
Nearby Short-Term Rental Market Comparison
How does the Dayton Airbnb market stack up against its neighbors? Compare key performance metrics like average monthly revenue, ADR, and occupancy rates in surrounding areas to understand the broader regional STR landscape.
| Market | Active Properties | Monthly Revenue | Daily Rate | Avg. Occupancy |
|---|---|---|---|---|
| Hardin | 10 | $2,428 | $188.93 | 48% |
| Fort Smith | 28 | $2,075 | $282.24 | 35% |
| Billings | 436 | $2,059 | $160.12 | 49% |
| Sheridan | 98 | $2,058 | $223.31 | 41% |
| Thermopolis | 55 | $1,955 | $171.05 | 40% |
| Laurel | 15 | $1,877 | $198.96 | 43% |
| Ten Sleep | 22 | $1,776 | $214.22 | 34% |
| Lovell | 15 | $1,769 | $191.54 | 42% |
| Powell | 33 | $1,681 | $175.99 | 45% |
| Shell | 13 | $1,599 | $247.26 | 31% |