Cody Airbnb Market Analysis 2026: Short Term Rental Data & Vacation Rental Statistics in Wyoming, United States
Is Airbnb profitable in Cody in 2026? Explore comprehensive Airbnb analytics for Cody, Wyoming, United States to uncover income potential. This 2026 STR market report for Cody, based on AirROI data from February 2025 to January 2026, reveals key trends in the market of 354 active listings.
Whether you're considering an Airbnb investment in Cody, optimizing your existing vacation rental, or exploring rental arbitrage opportunities, understanding the Cody Airbnb data is crucial. Leveraging the low regulation environment is key to maximizing your short term rental income potential. Let's dive into the specifics.
Key Cody Airbnb Performance Metrics Overview
Monthly Airbnb Revenue Variations & Income Potential in Cody (2026)
Understanding the monthly revenue variations for Airbnb listings in Cody is key to maximizing your short term rental income potential. Seasonality significantly impacts earnings. Our analysis, based on data from the past 12 months, shows that the peak revenue month for STRs in Cody is typically July, while February often presents the lowest earnings, highlighting opportunities for strategic pricing adjustments during shoulder and low seasons. Explore the typical Airbnb income in Cody across different performance tiers:
- Best-in-class properties (Top 10%) achieve $5,831+ monthly, often utilizing dynamic pricing and superior guest experiences.
- Strong performing properties (Top 25%) earn $3,974 or more, indicating effective management and desirable locations/amenities.
- Typical properties (Median) generate around $2,586 per month, representing the average market performance.
- Entry-level properties (Bottom 25%) see earnings around $1,525, often with potential for optimization.
Average Monthly Airbnb Earnings Trend in Cody
Cody Airbnb Occupancy Rate Trends (2026)
Maximize your bookings by understanding the Cody STR occupancy trends. Seasonal demand shifts significantly influence how often properties are booked. Typically, Julysees the highest demand (peak season occupancy), while January experiences the lowest (low season). Effective strategies, like adjusting minimum stays or offering promotions, can boost occupancy during slower periods. Here's how different property tiers perform in Cody:
- Best-in-class properties (Top 10%) achieve 77%+ occupancy, indicating high desirability and potentially optimized availability.
- Strong performing properties (Top 25%) maintain 61% or higher occupancy, suggesting good market fit and guest satisfaction.
- Typical properties (Median) have an occupancy rate around 41%.
- Entry-level properties (Bottom 25%) average 24% occupancy, potentially facing higher vacancy.
Average Monthly Occupancy Rate Trend in Cody
Average Daily Rate (ADR) Airbnb Trends in Cody (2026)
Effective short term rental pricing strategy in Cody involves understanding monthly ADR fluctuations. The Average Daily Rate (ADR) for Airbnb in Cody typically peaks in July and dips lowest during February. Leveraging Airbnb dynamic pricing tools or strategies based on this seasonality can significantly boost revenue. Here's a look at the typical nightly rates achieved:
- Best-in-class properties (Top 10%) command rates of $415+ per night, often due to premium features or locations.
- Strong performing properties (Top 25%) achieve nightly rates of $287 or more.
- Typical properties (Median) charge around $202 per night.
- Entry-level properties (Bottom 25%) earn around $152 per night.
Average Daily Rate (ADR) Trend by Month in Cody
Get Live Cody Market Intelligence 👇

Explore Real-time Analytics
Airbnb Seasonality Analysis & Trends in Cody (2026)
Peak Season (July, June, August)
- Revenue averages $5,176 per month
- Occupancy rates average 61.8%
- Daily rates average $262
Shoulder Season
- Revenue averages $2,746 per month
- Occupancy maintains around 39.9%
- Daily rates hold near $238
Low Season (January, February, March)
- Revenue drops to average $1,672 per month
- Occupancy decreases to average 31.5%
- Daily rates adjust to average $222
Seasonality Insights for Cody
- The Airbnb seasonality in Cody shows highly seasonal trends requiring careful strategy. While the sections above show seasonal averages, it's also insightful to look at the extremes:
- During the high season, the absolute peak month showcases Cody's highest earning potential, with monthly revenues capable of climbing to $5,885, occupancy reaching a high of 68.2%, and ADRs peaking at $266.
- Conversely, the slowest single month of the year, typically falling within the low season, marks the market's lowest point. In this month, revenue might dip to $1,445, occupancy could drop to 28.3%, and ADRs may adjust down to $217.
- Understanding both the seasonal averages and these monthly peaks and troughs in revenue, occupancy, and ADR is crucial for maximizing your Airbnb profit potential in Cody.
Seasonal Strategies for Maximizing Profit
- Peak Season: Maximize revenue through premium pricing and potentially longer minimum stays. Ensure high availability.
- Low Season: Offer competitive pricing, special promotions (e.g., extended stay discounts), and flexible cancellation policies. Target off-season travelers like remote workers or budget-conscious guests.
- Shoulder Seasons: Implement dynamic pricing that balances peak and low rates. Target weekend travelers or specific events. Offer slightly more flexible terms than peak season.
- Regularly analyze your own performance against these Cody seasonality benchmarks and adjust your pricing and availability strategy accordingly.
Best Areas for Airbnb Investment in Cody (2026)
Exploring the top neighborhoods for short-term rentals in Cody? This section highlights key areas, outlining why they are attractive for hosts and guests, along with notable local attractions. Consider these locations based on your target guest profile and investment strategy.
| Neighborhood / Area | Why Host Here? (Target Guests & Appeal) | Key Attractions & Landmarks |
|---|---|---|
| Buffalo Bill Center of the West | A premier destination that showcases the history of the American West, attracting visitors interested in culture and history. It offers a range of exhibits and activities related to the life of Buffalo Bill Cody. | Buffalo Bill Center of the West, Cody Nite Rodeo, Cody Wild West Museum, Cody Depot, Cody Visitor Center |
| Yellowstone National Park | Located just a short drive from Cody, this iconic national park draws millions of tourists each year with its breathtaking landscapes, geothermal features, and diverse wildlife. | Old Faithful, Mammoth Hot Springs, Grand Canyon of the Yellowstone, Yellowstone Lake, Lamar Valley |
| Cody Rodeo Grounds | Known for its vibrant rodeo events which are a key part of the local culture, attracting visitors during the summer months who want to experience traditional Wild West entertainment. | Cody Stampede Rodeo, Cody Nite Rodeo, Cody Rodeo Grounds, Wyoming Cowboy Hall of Fame |
| Downtown Cody | The charming heart of Cody with unique shops, restaurants, and art galleries, making it a hub for tourists looking to explore local culture and cuisine. | Cody Mural Festival, The Historic Irma Hotel, Cody Theatre, Local Art Galleries, Restaurants and Cafes |
| Shoshone National Forest | Offering stunning outdoor experiences like hiking, camping, and fishing, this area appeals to nature lovers and adventure seekers visiting the Cody area. | Beartooth Highway, Wild and Scenic Rivers, Campgrounds, Trails for hiking and biking, Wildlife viewing |
| Powell | A nearby town that's experiencing growth and development, attracting visitors to its local charm and offerings, making it a viable option for Airbnb investment. | Homesteader Museum, Cody-Powell Road, Local dining options, Scenic views of the Big Horn Basin, Community events and fairs |
| Meeteetse | A small historic town close to Cody known for its unique history and charm, appealing to those looking for a quiet getaway in the West. | Meeteetse Museums, Historic Main Street, Nature walks, Grizzly Bears, Local eateries |
| Heart Mountain | Historic site and memorial that draws visitors interested in World War II history, particularly the Japanese American internment experience. An educational and poignant place. | Heart Mountain Interpretive Learning Center, Historical markers, Scenic vistas, Local history exhibits, Guided tours |
Understanding Airbnb License Requirements & STR Laws in Cody (2026)
While Cody, Wyoming, United States currently shows low STR regulations, specific Airbnb license requirements might still exist or change. Always verify the latest short term rental regulations and Airbnb license requirements directly with local government authorities for Cody to ensure full compliance before hosting.
(Source: AirROI data, 2026, finding no licensed listings among those analyzed)
Top Performing Airbnb Properties in Cody (2026)
Benchmark your potential! Explore examples of top-performing Airbnb properties in Codybased on Trailing Twelve Month (TTM) revenue. Analyze their characteristics, revenue, occupancy rate, and ADR to understand what drives success in this market.
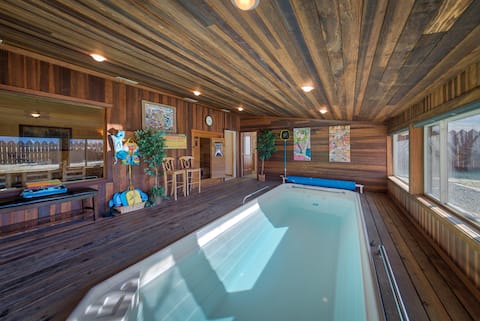
YELLOWSTONE VALLEY VAC LODGE/POOL/SAUNA/SLEEP 26
Entire Place • 9 bedrooms
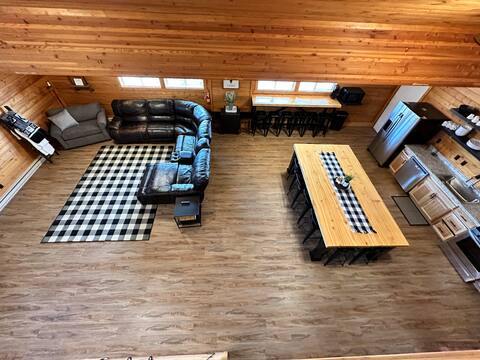
KB Lodge sleeps up to 22!
Entire Place • 5 bedrooms

Wapiti Valley Magic, East Yellowstone
Entire Place • 5 bedrooms

Dome House- New Game Room, Mountain Views!
Entire Place • 4 bedrooms

New & Private Modern Farmhouse
Entire Place • 3 bedrooms

Jim Mountain Retreat- Mountaintop Views!
Entire Place • 4 bedrooms
Note: Performance varies based on location, size, amenities, seasonality, and management quality. Data reflects the past 12 months.
Top Performing Airbnb Hosts in Cody (2026)
Learn from the best! This table showcases top-performing Airbnb hosts in Cody based on the number of properties managed and estimated total revenue over the past year. Analyze their scale and performance metrics.
| Host Name | Properties | Grossing Revenue | Stay Reviews | Avg Rating |
|---|---|---|---|---|
| Cody Lodging | 75 | $2,081,488 | 1697 | 4.85/5.0 |
| Gina | 6 | $302,061 | 419 | 4.98/5.0 |
| Erin | 10 | $239,973 | 1422 | 4.82/5.0 |
| Stacy | 6 | $225,512 | 56 | 4.91/5.0 |
| Taylor | 4 | $207,342 | 203 | 4.95/5.0 |
| Brook | 4 | $195,099 | 229 | 4.70/5.0 |
| Zhiru | 1 | $174,532 | 46 | 4.78/5.0 |
| Andres | 5 | $168,823 | 279 | 4.93/5.0 |
| Evolve | 7 | $163,744 | 217 | 4.81/5.0 |
| Alison | 6 | $125,184 | 60 | 4.91/5.0 |
Analyzing the strategies of top hosts, such as their property selection, pricing, and guest communication, can offer valuable lessons for optimizing your own Airbnb operations in Cody.
Dive Deeper: Advanced Cody STR Market Data (2026)
Ready to unlock more insights? AirROI provides access to advanced metrics and comprehensive Airbnb data for Cody. Explore detailed analytics beyond this report to refine your investment strategy, optimize pricing, and maximize your vacation rental profits.
Explore Advanced MetricsCody Short-Term Rental Market Composition (2026): Property & Room Types
Room Type Distribution
Property Type Distribution
Market Composition Insights for Cody
- The Cody Airbnb market composition is heavily skewed towards Entire Home/Apt listings, which make up 94.6% of the 354 active rentals. This indicates strong guest preference for privacy and space.
- Looking at the property type distribution in Cody, House properties are the most common (59%), reflecting the local real estate landscape.
- Houses represent a significant 59% portion, catering likely to families or larger groups.
- The presence of 6.8% Hotel/Boutique listings indicates integration with traditional hospitality.
- Smaller segments like others, unique stays (combined 4.6%) offer potential for unique stay experiences.
Cody Airbnb Room Capacity Analysis (2026): Bedroom Distribution
Distribution of Listings by Number of Bedrooms
Room Capacity Insights for Cody
- The dominant room capacity in Cody is 2 bedrooms listings, making up 31.1% of the market. This suggests a strong demand for properties suitable for couples or solo travelers.
- Together, 2 bedrooms and 1 bedroom properties represent 60.5% of the active Airbnb listings in Cody, indicating a high concentration in these sizes.
- A significant 31.6% of listings offer 3+ bedrooms, catering to larger groups and families seeking more space in Cody.
Cody Vacation Rental Guest Capacity Trends (2026)
Distribution of Listings by Guest Capacity
Guest Capacity Insights for Cody
- The most common guest capacity trend in Cody vacation rentals is listings accommodating 4 guests (25.1%). This suggests the primary traveler segment is likely small families or groups.
- Properties designed for 4 guests and 8+ guests dominate the Cody STR market, accounting for 47.1% of listings.
- 44.8% of properties accommodate 6+ guests, serving the market segment for larger families or group travel in Cody.
- On average, properties in Cody are equipped to host 5.0 guests.
Cody Airbnb Booking Patterns (2026): Available vs. Booked Days
Available Days Distribution
Booked Days Distribution
Booking Pattern Insights for Cody
- The most common availability pattern in Cody falls within the 181-270 days range, representing 45.5% of listings. This suggests many properties have significant open periods on their calendars.
- Approximately 89.3% of listings show high availability (181+ days open annually), indicating potential for increased bookings or specific owner usage patterns.
- For booked days, the 91-180 days range is most frequent in Cody (46.6%), reflecting common guest stay durations or potential owner blocking patterns.
- A notable 12.1% of properties secure long booking periods (181+ days booked per year), highlighting successful long-term rental strategies or significant owner usage.
Cody Airbnb Minimum Stay Requirements Analysis
Distribution of Listings by Minimum Night Requirement
1 Night
98 listings
27.7% of total
2 Nights
93 listings
26.3% of total
3 Nights
50 listings
14.1% of total
4-6 Nights
7 listings
2% of total
7-29 Nights
3 listings
0.8% of total
30+ Nights
103 listings
29.1% of total
Key Insights
- The most prevalent minimum stay requirement in Cody is 30+ Nights, adopted by 29.1% of listings. This highlights the market's preference for longer commitments.
- A significant segment (29.1%) caters to monthly stays (30+ nights) in Cody, pointing to opportunities in the extended-stay market.
Recommendations
- Align with the market by considering a 30+ Nights minimum stay, as 29.1% of Cody hosts use this setting.
- If feasible, allowing 1-night stays, especially midweek or during low season, could capture last-minute bookings, as only 27.7% currently do.
- Explore offering discounts for stays of 30+ nights to attract the 29.1% of the market seeking extended stays.
- Adjust minimum nights based on seasonality – potentially shorter during low season and longer during peak demand periods in Cody.
Cody Airbnb Cancellation Policy Trends Analysis (2026)
Super Strict 60 Days
1 listings
0.3% of total
Super Strict 30 Days
3 listings
0.8% of total
Limited
1 listings
0.3% of total
Flexible
71 listings
20.1% of total
Moderate
58 listings
16.4% of total
Firm
168 listings
47.6% of total
Strict
51 listings
14.4% of total
Cancellation Policy Insights for Cody
- The prevailing Airbnb cancellation policy trend in Cody is Firm, used by 47.6% of listings.
- A majority (62.0%) of hosts in Cody utilize Firm or Strict policies, indicating a market where hosts prioritize booking security.
Recommendations for Hosts
- Consider adopting a Firm policy to align with the 47.6% market standard in Cody.
- Using a Strict policy might deter some guests, as only 14.4% of listings use it. Evaluate if potential revenue protection outweighs possible lower booking rates.
- Regularly review your cancellation policy against competitors and market demand shifts in Cody.
Cody STR Booking Lead Time Analysis (2026)
Average Booking Lead Time by Month
Booking Lead Time Insights for Cody
- The overall average booking lead time for vacation rentals in Cody is 74 days.
- Guests book furthest in advance for stays during April (average 101 days), likely coinciding with peak travel demand or local events.
- The shortest booking windows occur for stays in February (average 24 days), indicating more last-minute travel plans during this time.
- Seasonally, Summer (86 days avg.) sees the longest lead times, while Winter (29 days avg.) has the shortest, reflecting typical travel planning cycles.
Recommendations for Hosts
- Use the overall average lead time (74 days) as a baseline for your pricing and availability strategy in Cody.
- For April stays, consider implementing length-of-stay discounts or slightly higher rates for bookings made less than 101 days out to capitalize on advance planning.
- Target marketing efforts for the Summer season well in advance (at least 86 days) to capture early planners.
- Monitor your own booking lead times against these Cody averages to identify opportunities for dynamic pricing adjustments.
Popular & Essential Airbnb Amenities in Cody (2026)
Amenity Prevalence
Amenity Insights for Cody
- Essential amenities in Cody that guests expect include: Free parking on premises, Heating, Hot water. Lacking these (any) could significantly impact bookings.
- Popular amenities like Coffee maker, Smoke alarm, Wifi are common but not universal. Offering these can provide a competitive edge.
- Warning: Wifi is not universally provided but is considered essential globally. Ensure reliable Wifi is offered.
Recommendations for Hosts
- Ensure your listing includes all essential amenities for Cody: Free parking on premises, Heating, Hot water.
- Prioritize adding missing essentials: Free parking on premises, Heating, Hot water.
- Consider adding popular differentiators like Coffee maker or Smoke alarm to increase appeal.
- Highlight unique or less common amenities you offer (e.g., hot tub, dedicated workspace, EV charger) in your listing description and photos.
- Regularly check competitor amenities in Cody to stay competitive.
Cody Airbnb Guest Demographics & Profile Analysis (2026)
Guest Profile Summary for Cody
- The typical guest profile for Airbnb in Cody consists of primarily domestic travelers (91%), often arriving from nearby Billings, typically belonging to the Post-2000s (Gen Z/Alpha) group (50%), primarily speaking English or Spanish.
- Domestic travelers account for 90.7% of guests.
- Key international markets include United States (90.7%) and United Kingdom (2%).
- Top languages spoken are English (75%) followed by Spanish (7.1%).
- A significant demographic segment is the Post-2000s (Gen Z/Alpha) group, representing 50% of guests.
Recommendations for Hosts
- Target domestic marketing efforts towards travelers from Billings and Casper.
- Tailor amenities and listing descriptions to appeal to the dominant Post-2000s (Gen Z/Alpha) demographic (e.g., highlight fast WiFi, smart home features, local guides).
- Highlight unique local experiences or amenities relevant to the primary guest profile.
- Consider seasonal promotions aligned with peak travel times for key origin markets.
Nearby Short-Term Rental Market Comparison
How does the Cody Airbnb market stack up against its neighbors? Compare key performance metrics like average monthly revenue, ADR, and occupancy rates in surrounding areas to understand the broader regional STR landscape.
| Market | Active Properties | Monthly Revenue | Daily Rate | Avg. Occupancy |
|---|---|---|---|---|
| Teton Village | 283 | $8,166 | $913.82 | 43% |
| Jackson | 349 | $6,568 | $588.79 | 47% |
| Wilson | 259 | $4,662 | $481.18 | 48% |
| Emigrant | 113 | $4,616 | $384.97 | 52% |
| Gardiner | 209 | $4,223 | $314.18 | 55% |
| Cooke City | 43 | $4,132 | $308.30 | 51% |
| Pray | 53 | $4,084 | $362.97 | 47% |
| Livingston | 355 | $3,305 | $322.10 | 47% |
| Red Lodge | 238 | $3,297 | $312.35 | 42% |
| Bondurant | 12 | $3,064 | $314.18 | 56% |