Town of Barnes Airbnb Market Analysis 2025: Short Term Rental Data & Vacation Rental Statistics in Wisconsin, United States
Is Airbnb profitable in Town of Barnes in 2025? Explore comprehensive Airbnb analytics for Town of Barnes, Wisconsin, United States to uncover income potential. This 2025 STR market report for Town of Barnes, based on AirROI data from April 2024 to March 2025, reveals key trends in the niche market of 17 active listings.
Whether you're considering an Airbnb investment in Town of Barnes, optimizing your existing vacation rental, or exploring rental arbitrage opportunities, understanding the Town of Barnes Airbnb data is crucial. Leveraging the low regulation environment is key to maximizing your short term rental income potential. Let's dive into the specifics.
Key Town of Barnes Airbnb Performance Metrics Overview
Monthly Airbnb Revenue Variations & Income Potential in Town of Barnes (2025)
Understanding the monthly revenue variations for Airbnb listings in Town of Barnes is key to maximizing your short term rental income potential. Seasonality significantly impacts earnings. Our analysis, based on data from the past 12 months, shows that the peak revenue month for STRs in Town of Barnes is typically July, while December often presents the lowest earnings, highlighting opportunities for strategic pricing adjustments during shoulder and low seasons. Explore the typical Airbnb income in Town of Barnes across different performance tiers:
- Best-in-class properties (Top 10%) achieve $6,462+ monthly, often utilizing dynamic pricing and superior guest experiences.
- Strong performing properties (Top 25%) earn $4,117 or more, indicating effective management and desirable locations/amenities.
- Typical properties (Median) generate around $2,640 per month, representing the average market performance.
- Entry-level properties (Bottom 25%) see earnings around $1,596, often with potential for optimization.
Average Monthly Airbnb Earnings Trend in Town of Barnes
Town of Barnes Airbnb Occupancy Rate Trends (2025)
Maximize your bookings by understanding the Town of Barnes STR occupancy trends. Seasonal demand shifts significantly influence how often properties are booked. Typically, Julysees the highest demand (peak season occupancy), while December experiences the lowest (low season). Effective strategies, like adjusting minimum stays or offering promotions, can boost occupancy during slower periods. Here's how different property tiers perform in Town of Barnes:
- Best-in-class properties (Top 10%) achieve 70%+ occupancy, indicating high desirability and potentially optimized availability.
- Strong performing properties (Top 25%) maintain 56% or higher occupancy, suggesting good market fit and guest satisfaction.
- Typical properties (Median) have an occupancy rate around 36%.
- Entry-level properties (Bottom 25%) average 18% occupancy, potentially facing higher vacancy.
Average Monthly Occupancy Rate Trend in Town of Barnes
Average Daily Rate (ADR) Airbnb Trends in Town of Barnes (2025)
Effective short term rental pricing strategy in Town of Barnes involves understanding monthly ADR fluctuations. The Average Daily Rate (ADR) for Airbnb in Town of Barnes typically peaks in August and dips lowest during April. Leveraging Airbnb dynamic pricing tools or strategies based on this seasonality can significantly boost revenue. Here's a look at the typical nightly rates achieved:
- Best-in-class properties (Top 10%) command rates of $560+ per night, often due to premium features or locations.
- Strong performing properties (Top 25%) achieve nightly rates of $346 or more.
- Typical properties (Median) charge around $240 per night.
- Entry-level properties (Bottom 25%) earn around $156 per night.
Average Daily Rate (ADR) Trend by Month in Town of Barnes
Get Live Town of Barnes Market Intelligence 👇

Explore Real-time Analytics
Airbnb Seasonality Analysis & Trends in Town of Barnes (2025)
Peak Season (July, August, September)
- Revenue averages $5,500 per month
- Occupancy rates average 63.4%
- Daily rates average $293
Shoulder Season
- Revenue averages $2,713 per month
- Occupancy maintains around 35.6%
- Daily rates hold near $282
Low Season (March, April, December)
- Revenue drops to average $1,654 per month
- Occupancy decreases to average 22.3%
- Daily rates adjust to average $275
Seasonality Insights for Town of Barnes
- The Airbnb seasonality in Town of Barnes shows highly seasonal trends requiring careful strategy. While the sections above show seasonal averages, it's also insightful to look at the extremes:
- During the high season, the absolute peak month showcases Town of Barnes's highest earning potential, with monthly revenues capable of climbing to $6,842, occupancy reaching a high of 73.3%, and ADRs peaking at $298.
- Conversely, the slowest single month of the year, typically falling within the low season, marks the market's lowest point. In this month, revenue might dip to $1,534, occupancy could drop to 18.1%, and ADRs may adjust down to $253.
- Understanding both the seasonal averages and these monthly peaks and troughs in revenue, occupancy, and ADR is crucial for maximizing your Airbnb profit potential in Town of Barnes.
Seasonal Strategies for Maximizing Profit
- Peak Season: Maximize revenue through premium pricing and potentially longer minimum stays. Ensure high availability.
- Low Season: Offer competitive pricing, special promotions (e.g., extended stay discounts), and flexible cancellation policies. Target off-season travelers like remote workers or budget-conscious guests.
- Shoulder Seasons: Implement dynamic pricing that balances peak and low rates. Target weekend travelers or specific events. Offer slightly more flexible terms than peak season.
- Regularly analyze your own performance against these Town of Barnes seasonality benchmarks and adjust your pricing and availability strategy accordingly.
Best Areas for Airbnb Investment in Town of Barnes (2025)
Exploring the top neighborhoods for short-term rentals in Town of Barnes? This section highlights key areas, outlining why they are attractive for hosts and guests, along with notable local attractions. Consider these locations based on your target guest profile and investment strategy.
| Neighborhood / Area | Why Host Here? (Target Guests & Appeal) | Key Attractions & Landmarks |
|---|---|---|
| Lake Namekagon | A pristine, beautiful lake perfect for summertime recreational activities, including swimming, fishing, and boating. An attractive destination for families and outdoor enthusiasts. | Lake Namekagon, Fishing and Boating Opportunities, Public Beach Access, Nature Trails, Local Parks |
| Copper Falls State Park | Known for its stunning waterfalls and scenic hiking trails, this state park attracts nature lovers and adventure seekers. Ideal for eco-tourism and outdoor activities. | Copper Falls State Park, Cascading Waterfalls, Hiking Trails, Picnic Areas, Camping Spots |
| Cable | A charming small town offering a quiet escape with access to beautiful lakes and the surrounding Chequamegon National Forest. Great for visitors looking to unwind amidst nature. | Cable Natural History Museum, Telemark Resort, Chequamegon National Forest, Local Shops and Cafes, Biking Trails |
| Drummond | A peaceful town surrounded by forests and lakes, making it a perfect retreat for nature lovers. Offers a serene environment for those looking to relax and enjoy the outdoors. | Drummond Area Historical Society, Mason Lake, Nature Trails, Local Artisans, Scenic Views |
| Barnes Town Park | A local spot that offers recreational facilities including sports and play areas, making it appealing for families and groups looking for outdoor fun. | Barnes Town Park, Playgrounds, Sports Fields, Recreational Activities, Picnic Areas |
| Namekagon River | Rich in wildlife and perfect for canoeing and kayaking, the river offers tranquil water experiences for tourists interested in outdoor sports and nature observation. | Namekagon River, Canoeing and Kayaking, Wildlife Watching, Fishing Opportunities, Scenic Views |
| Big Sand Lake | A popular lake for swimming, fishing, and water sports, attracting visitors during the summer months. Great for families seeking water-based activities. | Big Sand Lake, Public Beaches, Fishing and Water Sports, Camping Facilities, Nature Trails |
| Chequamegon National Forest | A massive national forest that provides endless opportunities for hiking, camping, and observing wildlife. An attractive destination for eco-tourism and outdoor adventures. | Chequamegon National Forest, Hiking Trails, Wildlife Observation, Camping Areas, Snowmobiling in Winter |
Understanding Airbnb License Requirements & STR Laws in Town of Barnes (2025)
While Town of Barnes, Wisconsin, United States currently shows low STR regulations, specific Airbnb license requirements might still exist or change. Always verify the latest short term rental regulations and Airbnb license requirements directly with local government authorities for Town of Barnes to ensure full compliance before hosting.
(Source: AirROI data, 2025, finding no licensed listings among those analyzed)
Top Performing Airbnb Properties in Town of Barnes (2025)
Benchmark your potential! Explore examples of top-performing Airbnb properties in Town of Barnesbased on Trailing Twelve Month (TTM) revenue. Analyze their characteristics, revenue, occupancy rate, and ADR to understand what drives success in this market.
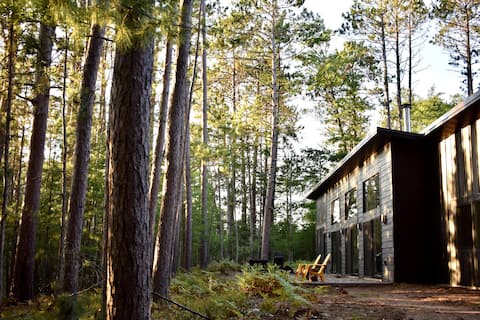
Modern Lake House | Water, Woods, Relaxation
Entire Place • 3 bedrooms

Escape on Middle Eau Claire Lake, 4 bedroom cabin
Entire Place • 4 bedrooms

Pontoon + EV + Swim/Kayak/Fish on the Lake
Entire Place • 5 bedrooms
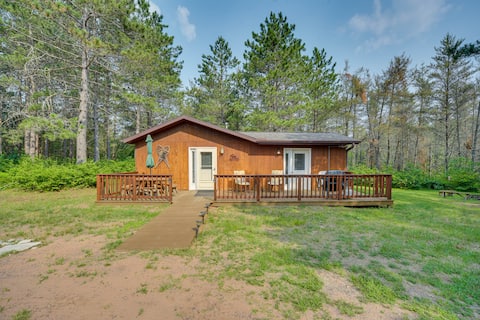
Secluded lake cabin in Barnes on 38 acres
Entire Place • 3 bedrooms

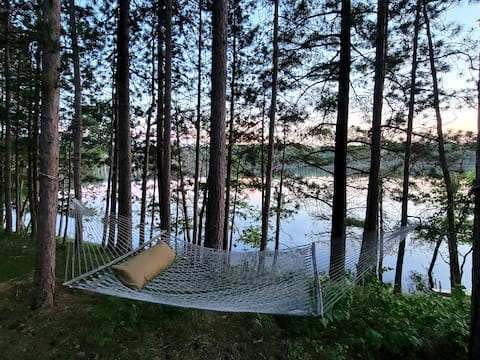
Private Retreat w/ Dock on Middle Eau Claire Lake!
Entire Place • 3 bedrooms
Woodland Cabin w/ Fishing, ATV & Snowmobile Trails
Entire Place • 2 bedrooms
Note: Performance varies based on location, size, amenities, seasonality, and management quality. Data reflects the past 12 months.
Top Performing Airbnb Hosts in Town of Barnes (2025)
Learn from the best! This table showcases top-performing Airbnb hosts in Town of Barnes based on the number of properties managed and estimated total revenue over the past year. Analyze their scale and performance metrics.
| Host Name | Properties | Grossing Revenue | Stay Reviews | Avg Rating |
|---|---|---|---|---|
| Evolve | 2 | $68,188 | 54 | 4.83/5.0 |
| Peter | 1 | $56,840 | 97 | 4.98/5.0 |
| Cristina | 1 | $56,532 | 10 | 5.00/5.0 |
| Alyssa | 1 | $53,423 | 43 | 4.98/5.0 |
| North Country Vacation Rentals | 4 | $48,827 | 27 | 3.50/5.0 |
| Jeff And Susan | 1 | $39,668 | 71 | 4.96/5.0 |
| Evolve | 1 | $32,933 | 14 | 4.86/5.0 |
| Kevin | 1 | $32,476 | 202 | 4.97/5.0 |
| Kayla | 1 | $31,474 | 46 | 5.00/5.0 |
| Michele And Marc | 1 | $31,288 | 100 | 4.84/5.0 |
Analyzing the strategies of top hosts, such as their property selection, pricing, and guest communication, can offer valuable lessons for optimizing your own Airbnb operations in Town of Barnes.
Dive Deeper: Advanced Town of Barnes STR Market Data (2025)
Ready to unlock more insights? AirROI provides access to advanced metrics and comprehensive Airbnb data for Town of Barnes. Explore detailed analytics beyond this report to refine your investment strategy, optimize pricing, and maximize your vacation rental profits.
Explore Advanced MetricsTown of Barnes Short-Term Rental Market Composition (2025): Property & Room Types
Room Type Distribution
Property Type Distribution
Market Composition Insights for Town of Barnes
- The Town of Barnes Airbnb market composition is heavily skewed towards Entire Home/Apt listings, which make up 100% of the 17 active rentals. This indicates strong guest preference for privacy and space.
- Looking at the property type distribution in Town of Barnes, Outdoor/Unique properties are the most common (64.7%), reflecting the local real estate landscape.
- Houses represent a significant 29.4% portion, catering likely to families or larger groups.
Town of Barnes Airbnb Room Capacity Analysis (2025): Bedroom Distribution
Distribution of Listings by Number of Bedrooms
Room Capacity Insights for Town of Barnes
- The dominant room capacity in Town of Barnes is 2 bedrooms listings, making up 47.1% of the market. This suggests a strong demand for properties suitable for couples or solo travelers.
- Together, 2 bedrooms and 3 bedrooms properties represent 64.7% of the active Airbnb listings in Town of Barnes, indicating a high concentration in these sizes.
- A significant 47.0% of listings offer 3+ bedrooms, catering to larger groups and families seeking more space in Town of Barnes.
Town of Barnes Vacation Rental Guest Capacity Trends (2025)
Distribution of Listings by Guest Capacity
Guest Capacity Insights for Town of Barnes
- The most common guest capacity trend in Town of Barnes vacation rentals is listings accommodating 8+ guests (35.3%). This suggests the primary traveler segment is likely larger groups.
- Properties designed for 8+ guests and 6 guests dominate the Town of Barnes STR market, accounting for 70.6% of listings.
- 82.4% of properties accommodate 6+ guests, serving the market segment for larger families or group travel in Town of Barnes.
- On average, properties in Town of Barnes are equipped to host 6.5 guests.
Town of Barnes Airbnb Booking Patterns (2025): Available vs. Booked Days
Available Days Distribution
Booked Days Distribution
Booking Pattern Insights for Town of Barnes
- The most common availability pattern in Town of Barnes falls within the 181-270 days range, representing 41.2% of listings. This suggests many properties have significant open periods on their calendars.
- Approximately 76.5% of listings show high availability (181+ days open annually), indicating potential for increased bookings or specific owner usage patterns.
- For booked days, the 91-180 days range is most frequent in Town of Barnes (41.2%), reflecting common guest stay durations or potential owner blocking patterns.
- A notable 23.5% of properties secure long booking periods (181+ days booked per year), highlighting successful long-term rental strategies or significant owner usage.
Town of Barnes Airbnb Minimum Stay Requirements Analysis
Distribution of Listings by Minimum Night Requirement
1 Night
1 listings
5.9% of total
2 Nights
4 listings
23.5% of total
3 Nights
9 listings
52.9% of total
30+ Nights
3 listings
17.6% of total
Key Insights
- The most prevalent minimum stay requirement in Town of Barnes is 3 Nights, adopted by 52.9% of listings. This highlights the market's preference for longer commitments.
- A significant segment (17.6%) caters to monthly stays (30+ nights) in Town of Barnes, pointing to opportunities in the extended-stay market.
Recommendations
- Align with the market by considering a 3 Nights minimum stay, as 52.9% of Town of Barnes hosts use this setting.
- If feasible, allowing 1-night stays, especially midweek or during low season, could capture last-minute bookings, as only 5.9% currently do.
- Explore offering discounts for stays of 30+ nights to attract the 17.6% of the market seeking extended stays.
- Adjust minimum nights based on seasonality – potentially shorter during low season and longer during peak demand periods in Town of Barnes.
Town of Barnes Airbnb Cancellation Policy Trends Analysis (2025)
Super Strict 30 Days
3 listings
18.8% of total
Flexible
1 listings
6.3% of total
Moderate
1 listings
6.3% of total
Firm
4 listings
25% of total
Strict
7 listings
43.8% of total
Cancellation Policy Insights for Town of Barnes
- The prevailing Airbnb cancellation policy trend in Town of Barnes is Strict, used by 43.8% of listings.
- A majority (68.8%) of hosts in Town of Barnes utilize Firm or Strict policies, indicating a market where hosts prioritize booking security.
Recommendations for Hosts
- Consider adopting a Strict policy to align with the 43.8% market standard in Town of Barnes.
- With 43.8% using Strict terms, this is a viable option in Town of Barnes, particularly for high-value properties or during peak demand periods.
- Regularly review your cancellation policy against competitors and market demand shifts in Town of Barnes.
Town of Barnes STR Booking Lead Time Analysis (2025)
Average Booking Lead Time by Month
Booking Lead Time Insights for Town of Barnes
- The overall average booking lead time for vacation rentals in Town of Barnes is 104 days.
- Guests book furthest in advance for stays during July (average 149 days), likely coinciding with peak travel demand or local events.
- The shortest booking windows occur for stays in December (average 42 days), indicating more last-minute travel plans during this time.
- Seasonally, Summer (137 days avg.) sees the longest lead times, while Winter (85 days avg.) has the shortest, reflecting typical travel planning cycles.
Recommendations for Hosts
- Use the overall average lead time (104 days) as a baseline for your pricing and availability strategy in Town of Barnes.
- For July stays, consider implementing length-of-stay discounts or slightly higher rates for bookings made less than 149 days out to capitalize on advance planning.
- Target marketing efforts for the Summer season well in advance (at least 137 days) to capture early planners.
- Monitor your own booking lead times against these Town of Barnes averages to identify opportunities for dynamic pricing adjustments.
Popular & Essential Airbnb Amenities in Town of Barnes (2025)
Amenity Prevalence
Amenity Insights for Town of Barnes
- Essential amenities in Town of Barnes that guests expect include: Free parking on premises, Wifi, Hot water, Carbon monoxide alarm, Smoke alarm, Fire extinguisher, Kitchen. Lacking these (any) could significantly impact bookings.
- Popular amenities like Bed linens, Oven, Dishes and silverware are common but not universal. Offering these can provide a competitive edge.
Recommendations for Hosts
- Ensure your listing includes all essential amenities for Town of Barnes: Free parking on premises, Wifi, Hot water, Carbon monoxide alarm, Smoke alarm, Fire extinguisher, Kitchen.
- Consider adding popular differentiators like Bed linens or Oven to increase appeal.
- Highlight unique or less common amenities you offer (e.g., hot tub, dedicated workspace, EV charger) in your listing description and photos.
- Regularly check competitor amenities in Town of Barnes to stay competitive.
Town of Barnes Airbnb Guest Demographics & Profile Analysis (2025)
Guest Profile Summary for Town of Barnes
- The typical guest profile for Airbnb in Town of Barnes consists of primarily domestic travelers (100%), often arriving from nearby Minneapolis, typically belonging to the Post-2000s (Gen Z/Alpha) group (50%), primarily speaking English or Spanish.
- Domestic travelers account for 100.0% of guests.
- Top languages spoken are English (80.6%) followed by Spanish (16.7%).
- A significant demographic segment is the Post-2000s (Gen Z/Alpha) group, representing 50% of guests.
Recommendations for Hosts
- Target domestic marketing efforts towards travelers from Minneapolis and Chicago.
- Tailor amenities and listing descriptions to appeal to the dominant Post-2000s (Gen Z/Alpha) demographic (e.g., highlight fast WiFi, smart home features, local guides).
- Highlight unique local experiences or amenities relevant to the primary guest profile.
- Consider seasonal promotions aligned with peak travel times for key origin markets.
Nearby Short-Term Rental Market Comparison
How does the Town of Barnes Airbnb market stack up against its neighbors? Compare key performance metrics like average monthly revenue, ADR, and occupancy rates in surrounding areas to understand the broader regional STR landscape.
| Market | Active Properties | Monthly Revenue | Daily Rate | Avg. Occupancy |
|---|---|---|---|---|
| Silver Creek Township | 19 | $5,489 | $325.00 | 58% |
| Lutsen | 12 | $5,430 | $386.14 | 47% |
| Lake No. 2 | 24 | $5,211 | $335.91 | 55% |
| Tofte | 14 | $5,052 | $461.98 | 37% |
| Schroeder | 10 | $5,039 | $404.98 | 51% |
| Town of Clover | 17 | $4,811 | $253.36 | 61% |
| Scandia | 11 | $4,597 | $436.71 | 42% |
| Morse Township | 10 | $4,546 | $329.79 | 53% |
| Town of Georgetown | 15 | $4,408 | $433.08 | 43% |
| Lutsen Township | 165 | $4,322 | $387.87 | 39% |