Williamson Airbnb Market Analysis 2026: Short Term Rental Data & Vacation Rental Statistics in West Virginia, United States
Is Airbnb profitable in Williamson in 2026? Explore comprehensive Airbnb analytics for Williamson, West Virginia, United States to uncover income potential. This 2026 STR market report for Williamson, based on AirROI data from February 2025 to January 2026, reveals key trends in the niche market of 39 active listings.
Whether you're considering an Airbnb investment in Williamson, optimizing your existing vacation rental, or exploring rental arbitrage opportunities, understanding the Williamson Airbnb data is crucial. Leveraging the low regulation environment is key to maximizing your short term rental income potential. Let's dive into the specifics.
Key Williamson Airbnb Performance Metrics Overview
Monthly Airbnb Revenue Variations & Income Potential in Williamson (2026)
Understanding the monthly revenue variations for Airbnb listings in Williamson is key to maximizing your short term rental income potential. Seasonality significantly impacts earnings. Our analysis, based on data from the past 12 months, shows that the peak revenue month for STRs in Williamson is typically October, while February often presents the lowest earnings, highlighting opportunities for strategic pricing adjustments during shoulder and low seasons. Explore the typical Airbnb income in Williamson across different performance tiers:
- Best-in-class properties (Top 10%) achieve $3,573+ monthly, often utilizing dynamic pricing and superior guest experiences.
- Strong performing properties (Top 25%) earn $2,371 or more, indicating effective management and desirable locations/amenities.
- Typical properties (Median) generate around $1,546 per month, representing the average market performance.
- Entry-level properties (Bottom 25%) see earnings around $892, often with potential for optimization.
Average Monthly Airbnb Earnings Trend in Williamson
Williamson Airbnb Occupancy Rate Trends (2026)
Maximize your bookings by understanding the Williamson STR occupancy trends. Seasonal demand shifts significantly influence how often properties are booked. Typically, Octobersees the highest demand (peak season occupancy), while February experiences the lowest (low season). Effective strategies, like adjusting minimum stays or offering promotions, can boost occupancy during slower periods. Here's how different property tiers perform in Williamson:
- Best-in-class properties (Top 10%) achieve 52%+ occupancy, indicating high desirability and potentially optimized availability.
- Strong performing properties (Top 25%) maintain 39% or higher occupancy, suggesting good market fit and guest satisfaction.
- Typical properties (Median) have an occupancy rate around 26%.
- Entry-level properties (Bottom 25%) average 16% occupancy, potentially facing higher vacancy.
Average Monthly Occupancy Rate Trend in Williamson
Average Daily Rate (ADR) Airbnb Trends in Williamson (2026)
Effective short term rental pricing strategy in Williamson involves understanding monthly ADR fluctuations. The Average Daily Rate (ADR) for Airbnb in Williamson typically peaks in June and dips lowest during February. Leveraging Airbnb dynamic pricing tools or strategies based on this seasonality can significantly boost revenue. Here's a look at the typical nightly rates achieved:
- Best-in-class properties (Top 10%) command rates of $327+ per night, often due to premium features or locations.
- Strong performing properties (Top 25%) achieve nightly rates of $250 or more.
- Typical properties (Median) charge around $163 per night.
- Entry-level properties (Bottom 25%) earn around $129 per night.
Average Daily Rate (ADR) Trend by Month in Williamson
Get Live Williamson Market Intelligence 👇

Explore Real-time Analytics
Airbnb Seasonality Analysis & Trends in Williamson (2026)
Peak Season (October, May, April)
- Revenue averages $2,687 per month
- Occupancy rates average 40.0%
- Daily rates average $212
Shoulder Season
- Revenue averages $1,770 per month
- Occupancy maintains around 27.6%
- Daily rates hold near $212
Low Season (January, February, December)
- Revenue drops to average $1,025 per month
- Occupancy decreases to average 20.0%
- Daily rates adjust to average $195
Seasonality Insights for Williamson
- The Airbnb seasonality in Williamson shows highly seasonal trends requiring careful strategy. While the sections above show seasonal averages, it's also insightful to look at the extremes:
- During the high season, the absolute peak month showcases Williamson's highest earning potential, with monthly revenues capable of climbing to $3,098, occupancy reaching a high of 47.5%, and ADRs peaking at $221.
- Conversely, the slowest single month of the year, typically falling within the low season, marks the market's lowest point. In this month, revenue might dip to $895, occupancy could drop to 17.6%, and ADRs may adjust down to $185.
- Understanding both the seasonal averages and these monthly peaks and troughs in revenue, occupancy, and ADR is crucial for maximizing your Airbnb profit potential in Williamson.
Seasonal Strategies for Maximizing Profit
- Peak Season: Maximize revenue through premium pricing and potentially longer minimum stays. Ensure high availability.
- Low Season: Offer competitive pricing, special promotions (e.g., extended stay discounts), and flexible cancellation policies. Target off-season travelers like remote workers or budget-conscious guests.
- Shoulder Seasons: Implement dynamic pricing that balances peak and low rates. Target weekend travelers or specific events. Offer slightly more flexible terms than peak season.
- Regularly analyze your own performance against these Williamson seasonality benchmarks and adjust your pricing and availability strategy accordingly.
Best Areas for Airbnb Investment in Williamson (2026)
Exploring the top neighborhoods for short-term rentals in Williamson? This section highlights key areas, outlining why they are attractive for hosts and guests, along with notable local attractions. Consider these locations based on your target guest profile and investment strategy.
| Neighborhood / Area | Why Host Here? (Target Guests & Appeal) | Key Attractions & Landmarks |
|---|---|---|
| Williamson Downtown | The heart of Williamson, offering a taste of local culture with shops, restaurants, and entertainment options. Ideal for tourists looking to experience the local vibe while having convenient access to amenities. | Historical Williamson Museum, WVU Medicine - Tug Valley, Local boutiques, Restaurants and cafes, Williamson Memorial Fountain |
| Mingo County Courthouse Area | A historic area surrounding the beautiful Mingo County Courthouse, attracting visitors interested in the architecture and history of the region. A good spot for short stays near local attractions. | Mingo County Courthouse, Historic buildings, Local eateries, Scenic views of the Tug River |
| Pond Creek | A serene area known for its natural beauty, great for outdoor enthusiasts looking to explore the outdoors while being close to Williamson. Perfect for nature lovers and retreat-style stays. | Pond Creek Park, Fishing and hiking spots, Natural beauty, Wildlife watching opportunities |
| Train Depot District | Home to the historic railway depot, this area attracts history buffs and visitors looking to explore Williamson's railroad heritage. A charming and picturesque area with local charm. | Williamson Train Depot, Rails to Trails, Scenic walking paths, Local history exhibits |
| Marion County Area | A quiet residential area that provides a homey feel ideal for families and longer stays. Close enough to downtown but far enough for some peace and quiet. | Local parks, Family-friendly restaurants, Community events, Nearby hiking trails |
| Riverside Drive | Offers beautiful views of the Tug River and a peaceful stay by the water. Great for those looking to relax and enjoy nature while still being a short distance from downtown activities. | Tug River, Riverside walking trails, Picnic areas, Fishing spots |
| Adjacent Recreational Areas | Close to spots for recreational activities and outdoor adventures. A prime location for visitors looking to hike, bike, or fish in the surrounding areas. | Hiking trails, Fishing areas, Canoeing spots, Bicycling trails |
| West Williamson | A developing area that is attracting more attention for new businesses and developments. A good option for early investors looking to capitalize on upcoming growth. | New local businesses, Community events, Parks and recreation facilities, Family-friendly activities |
Understanding Airbnb License Requirements & STR Laws in Williamson (2026)
While Williamson, West Virginia, United States currently shows low STR regulations, specific Airbnb license requirements might still exist or change. Always verify the latest short term rental regulations and Airbnb license requirements directly with local government authorities for Williamson to ensure full compliance before hosting.
(Source: AirROI data, 2026, finding no licensed listings among those analyzed)
Top Performing Airbnb Properties in Williamson (2026)
Benchmark your potential! Explore examples of top-performing Airbnb properties in Williamsonbased on Trailing Twelve Month (TTM) revenue. Analyze their characteristics, revenue, occupancy rate, and ADR to understand what drives success in this market.

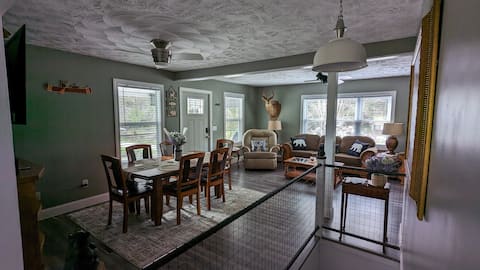
Vacation Rental in Lenore, WV
Entire Place • 3 bedrooms

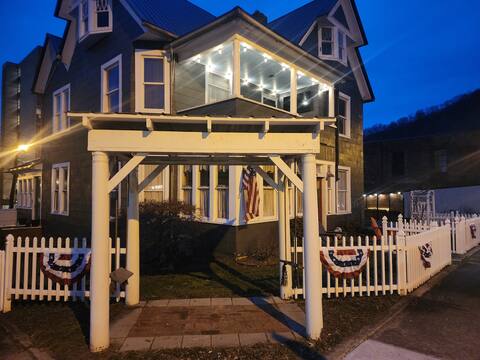
Entire house Privately located 4 bedroom
Entire Place • 4 bedrooms
Trail Riders Retreat with private in-ground pool
Entire Place • 2 bedrooms
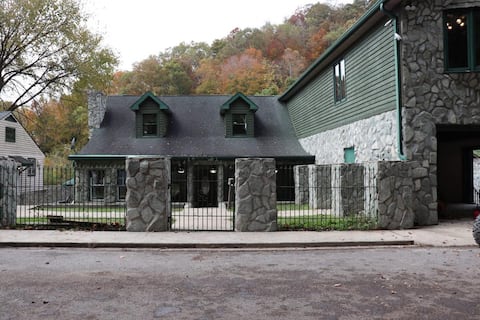
The Linkous House
Entire Place • 11 bedrooms
Buffalo Mountain Mountain Retreat in Williamson
Entire Place • 4 bedrooms
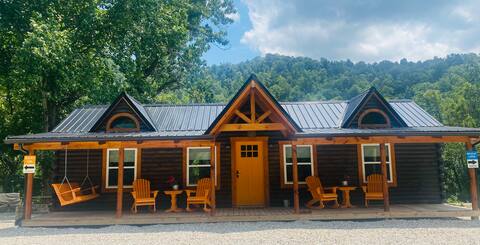
Rocky Top- Cabin at Billy Goat Mountain Village
Entire Place • 3 bedrooms
Note: Performance varies based on location, size, amenities, seasonality, and management quality. Data reflects the past 12 months.
Top Performing Airbnb Hosts in Williamson (2026)
Learn from the best! This table showcases top-performing Airbnb hosts in Williamson based on the number of properties managed and estimated total revenue over the past year. Analyze their scale and performance metrics.
| Host Name | Properties | Grossing Revenue | Stay Reviews | Avg Rating |
|---|---|---|---|---|
| Greg | 7 | $160,777 | 90 | 4.98/5.0 |
| Justin | 2 | $61,737 | 35 | 4.67/5.0 |
| Thomas | 2 | $59,746 | 57 | 4.98/5.0 |
| Anita | 5 | $45,795 | 10 | 5.00/5.0 |
| Ashley | 1 | $42,632 | 37 | 4.95/5.0 |
| Carmelita | 1 | $31,064 | 35 | 5.00/5.0 |
| Tammy | 2 | $26,964 | 97 | 4.85/5.0 |
| Roger | 1 | $25,755 | 65 | 4.91/5.0 |
| Grady | 3 | $25,271 | 156 | 4.72/5.0 |
| Daniel & Erica | 1 | $23,444 | 17 | 5.00/5.0 |
Analyzing the strategies of top hosts, such as their property selection, pricing, and guest communication, can offer valuable lessons for optimizing your own Airbnb operations in Williamson.
Dive Deeper: Advanced Williamson STR Market Data (2026)
Ready to unlock more insights? AirROI provides access to advanced metrics and comprehensive Airbnb data for Williamson. Explore detailed analytics beyond this report to refine your investment strategy, optimize pricing, and maximize your vacation rental profits.
Explore Advanced MetricsWilliamson Short-Term Rental Market Composition (2026): Property & Room Types
Room Type Distribution
Property Type Distribution
Market Composition Insights for Williamson
- The Williamson Airbnb market composition is heavily skewed towards Entire Home/Apt listings, which make up 100% of the 39 active rentals. This indicates strong guest preference for privacy and space.
- Looking at the property type distribution in Williamson, Outdoor/Unique properties are the most common (53.8%), reflecting the local real estate landscape.
- Houses represent a significant 41% portion, catering likely to families or larger groups.
- Smaller segments like apartment/condo, others (combined 5.2%) offer potential for unique stay experiences.
Williamson Airbnb Room Capacity Analysis (2026): Bedroom Distribution
Distribution of Listings by Number of Bedrooms
Room Capacity Insights for Williamson
- The dominant room capacity in Williamson is 2 bedrooms listings, making up 46.2% of the market. This suggests a strong demand for properties suitable for couples or solo travelers.
- Together, 2 bedrooms and 3 bedrooms properties represent 79.5% of the active Airbnb listings in Williamson, indicating a high concentration in these sizes.
- A significant 43.6% of listings offer 3+ bedrooms, catering to larger groups and families seeking more space in Williamson.
Williamson Vacation Rental Guest Capacity Trends (2026)
Distribution of Listings by Guest Capacity
Guest Capacity Insights for Williamson
- The most common guest capacity trend in Williamson vacation rentals is listings accommodating 8+ guests (43.6%). This suggests the primary traveler segment is likely larger groups.
- Properties designed for 8+ guests and 6 guests dominate the Williamson STR market, accounting for 79.5% of listings.
- 82.1% of properties accommodate 6+ guests, serving the market segment for larger families or group travel in Williamson.
- On average, properties in Williamson are equipped to host 6.5 guests.
Williamson Airbnb Booking Patterns (2026): Available vs. Booked Days
Available Days Distribution
Booked Days Distribution
Booking Pattern Insights for Williamson
- The most common availability pattern in Williamson falls within the 271-366 days range, representing 66.7% of listings. This suggests many properties have significant open periods on their calendars.
- Approximately 97.5% of listings show high availability (181+ days open annually), indicating potential for increased bookings or specific owner usage patterns.
- For booked days, the 31-90 days range is most frequent in Williamson (51.3%), reflecting common guest stay durations or potential owner blocking patterns.
- A notable 2.6% of properties secure long booking periods (181+ days booked per year), highlighting successful long-term rental strategies or significant owner usage.
Williamson Airbnb Minimum Stay Requirements Analysis
Distribution of Listings by Minimum Night Requirement
1 Night
12 listings
30.8% of total
2 Nights
24 listings
61.5% of total
3 Nights
2 listings
5.1% of total
30+ Nights
1 listings
2.6% of total
Key Insights
- The most prevalent minimum stay requirement in Williamson is 2 Nights, adopted by 61.5% of listings. This highlights the market's preference for shorter, flexible bookings.
- A strong majority (92.3%) of the Williamson Airbnb data shows acceptance of very short stays (1-2 nights), indicating a dynamic, high-turnover market.
- Dedicated monthly rentals (30+ nights) represent a small niche (2.6%), possibly an untapped area for hosts.
Recommendations
- Align with the market by considering a 2 Nights minimum stay, as 61.5% of Williamson hosts use this setting.
- Adjust minimum nights based on seasonality – potentially shorter during low season and longer during peak demand periods in Williamson.
Williamson Airbnb Cancellation Policy Trends Analysis (2026)
Flexible
9 listings
23.1% of total
Moderate
11 listings
28.2% of total
Firm
17 listings
43.6% of total
Strict
2 listings
5.1% of total
Cancellation Policy Insights for Williamson
- The prevailing Airbnb cancellation policy trend in Williamson is Firm, used by 43.6% of listings.
- There's a relatively balanced mix between guest-friendly (51.3%) and stricter (48.7%) policies, offering choices for different guest needs.
- Strict cancellation policies are quite rare (5.1%), potentially making listings with this policy less competitive unless justified by high demand or property type.
Recommendations for Hosts
- Consider adopting a Firm policy to align with the 43.6% market standard in Williamson.
- Using a Strict policy might deter some guests, as only 5.1% of listings use it. Evaluate if potential revenue protection outweighs possible lower booking rates.
- Regularly review your cancellation policy against competitors and market demand shifts in Williamson.
Williamson STR Booking Lead Time Analysis (2026)
Average Booking Lead Time by Month
Booking Lead Time Insights for Williamson
- The overall average booking lead time for vacation rentals in Williamson is 44 days.
- Guests book furthest in advance for stays during November (average 78 days), likely coinciding with peak travel demand or local events.
- The shortest booking windows occur for stays in January (average 13 days), indicating more last-minute travel plans during this time.
- Seasonally, Fall (62 days avg.) sees the longest lead times, while Winter (19 days avg.) has the shortest, reflecting typical travel planning cycles.
Recommendations for Hosts
- Use the overall average lead time (44 days) as a baseline for your pricing and availability strategy in Williamson.
- For November stays, consider implementing length-of-stay discounts or slightly higher rates for bookings made less than 78 days out to capitalize on advance planning.
- During January, focus on last-minute booking availability and promotions, as guests book with very short notice (13 days avg.).
- Target marketing efforts for the Fall season well in advance (at least 62 days) to capture early planners.
- Monitor your own booking lead times against these Williamson averages to identify opportunities for dynamic pricing adjustments.
Popular & Essential Airbnb Amenities in Williamson (2026)
Amenity Prevalence
Amenity Insights for Williamson
- Essential amenities in Williamson that guests expect include: Air conditioning, TV, Kitchen, Smoke alarm. Lacking these (any) could significantly impact bookings.
- Popular amenities like Fire extinguisher, Free parking on premises, BBQ grill are common but not universal. Offering these can provide a competitive edge.
- Warning: Wifi is not universally provided but is considered essential globally. Ensure reliable Wifi is offered.
Recommendations for Hosts
- Ensure your listing includes all essential amenities for Williamson: Air conditioning, TV, Kitchen, Smoke alarm.
- Prioritize adding missing essentials: TV, Kitchen, Smoke alarm.
- Consider adding popular differentiators like Fire extinguisher or Free parking on premises to increase appeal.
- Highlight unique or less common amenities you offer (e.g., hot tub, dedicated workspace, EV charger) in your listing description and photos.
- Regularly check competitor amenities in Williamson to stay competitive.
Williamson Airbnb Guest Demographics & Profile Analysis (2026)
Guest Profile Summary for Williamson
- The typical guest profile for Airbnb in Williamson consists of primarily domestic travelers (100%), often arriving from nearby Lawrenceville, typically belonging to the Post-2000s (Gen Z/Alpha) group (50%), primarily speaking English or Spanish.
- Domestic travelers account for 100.0% of guests.
- Top languages spoken are English (82%) followed by Spanish (14.8%).
- A significant demographic segment is the Post-2000s (Gen Z/Alpha) group, representing 50% of guests.
Recommendations for Hosts
- Target domestic marketing efforts towards travelers from Lawrenceville and Pittsburgh.
- Tailor amenities and listing descriptions to appeal to the dominant Post-2000s (Gen Z/Alpha) demographic (e.g., highlight fast WiFi, smart home features, local guides).
- Highlight unique local experiences or amenities relevant to the primary guest profile.
- Consider seasonal promotions aligned with peak travel times for key origin markets.
Nearby Short-Term Rental Market Comparison
How does the Williamson Airbnb market stack up against its neighbors? Compare key performance metrics like average monthly revenue, ADR, and occupancy rates in surrounding areas to understand the broader regional STR landscape.
| Market | Active Properties | Monthly Revenue | Daily Rate | Avg. Occupancy |
|---|---|---|---|---|
| Strawberry Plains | 13 | $3,880 | $222.81 | 54% |
| Victor | 21 | $3,854 | $450.02 | 33% |
| Lansing | 16 | $3,587 | $254.18 | 48% |
| Rogers | 115 | $3,484 | $255.43 | 45% |
| Watauga County | 47 | $3,370 | $314.71 | 39% |
| Maynardville | 20 | $3,257 | $348.95 | 43% |
| Blowing Rock | 426 | $3,209 | $339.38 | 38% |
| Valle Crucis | 57 | $3,158 | $343.61 | 36% |
| Campton | 194 | $3,132 | $272.21 | 40% |
| Frenchburg | 45 | $3,109 | $280.53 | 39% |