Shepherdstown Airbnb Market Analysis 2026: Short Term Rental Data & Vacation Rental Statistics in West Virginia, United States
Is Airbnb profitable in Shepherdstown in 2026? Explore comprehensive Airbnb analytics for Shepherdstown, West Virginia, United States to uncover income potential. This 2026 STR market report for Shepherdstown, based on AirROI data from February 2025 to January 2026, reveals key trends in the niche market of 43 active listings.
Whether you're considering an Airbnb investment in Shepherdstown, optimizing your existing vacation rental, or exploring rental arbitrage opportunities, understanding the Shepherdstown Airbnb data is crucial. Leveraging the low regulation environment is key to maximizing your short term rental income potential. Let's dive into the specifics.
Key Shepherdstown Airbnb Performance Metrics Overview
Monthly Airbnb Revenue Variations & Income Potential in Shepherdstown (2026)
Understanding the monthly revenue variations for Airbnb listings in Shepherdstown is key to maximizing your short term rental income potential. Seasonality significantly impacts earnings. Our analysis, based on data from the past 12 months, shows that the peak revenue month for STRs in Shepherdstown is typically July, while February often presents the lowest earnings, highlighting opportunities for strategic pricing adjustments during shoulder and low seasons. Explore the typical Airbnb income in Shepherdstown across different performance tiers:
- Best-in-class properties (Top 10%) achieve $5,439+ monthly, often utilizing dynamic pricing and superior guest experiences.
- Strong performing properties (Top 25%) earn $3,404 or more, indicating effective management and desirable locations/amenities.
- Typical properties (Median) generate around $2,185 per month, representing the average market performance.
- Entry-level properties (Bottom 25%) see earnings around $1,442, often with potential for optimization.
Average Monthly Airbnb Earnings Trend in Shepherdstown
Shepherdstown Airbnb Occupancy Rate Trends (2026)
Maximize your bookings by understanding the Shepherdstown STR occupancy trends. Seasonal demand shifts significantly influence how often properties are booked. Typically, Julysees the highest demand (peak season occupancy), while February experiences the lowest (low season). Effective strategies, like adjusting minimum stays or offering promotions, can boost occupancy during slower periods. Here's how different property tiers perform in Shepherdstown:
- Best-in-class properties (Top 10%) achieve 74%+ occupancy, indicating high desirability and potentially optimized availability.
- Strong performing properties (Top 25%) maintain 61% or higher occupancy, suggesting good market fit and guest satisfaction.
- Typical properties (Median) have an occupancy rate around 45%.
- Entry-level properties (Bottom 25%) average 32% occupancy, potentially facing higher vacancy.
Average Monthly Occupancy Rate Trend in Shepherdstown
Average Daily Rate (ADR) Airbnb Trends in Shepherdstown (2026)
Effective short term rental pricing strategy in Shepherdstown involves understanding monthly ADR fluctuations. The Average Daily Rate (ADR) for Airbnb in Shepherdstown typically peaks in November and dips lowest during March. Leveraging Airbnb dynamic pricing tools or strategies based on this seasonality can significantly boost revenue. Here's a look at the typical nightly rates achieved:
- Best-in-class properties (Top 10%) command rates of $390+ per night, often due to premium features or locations.
- Strong performing properties (Top 25%) achieve nightly rates of $232 or more.
- Typical properties (Median) charge around $163 per night.
- Entry-level properties (Bottom 25%) earn around $123 per night.
Average Daily Rate (ADR) Trend by Month in Shepherdstown
Get Live Shepherdstown Market Intelligence 👇

Explore Real-time Analytics
Airbnb Seasonality Analysis & Trends in Shepherdstown (2026)
Peak Season (July, November, October)
- Revenue averages $3,830 per month
- Occupancy rates average 56.0%
- Daily rates average $278
Shoulder Season
- Revenue averages $2,874 per month
- Occupancy maintains around 46.2%
- Daily rates hold near $268
Low Season (February, March, April)
- Revenue drops to average $2,318 per month
- Occupancy decreases to average 38.5%
- Daily rates adjust to average $246
Seasonality Insights for Shepherdstown
- The Airbnb seasonality in Shepherdstown shows moderate seasonality with distinct peak and low periods. While the sections above show seasonal averages, it's also insightful to look at the extremes:
- During the high season, the absolute peak month showcases Shepherdstown's highest earning potential, with monthly revenues capable of climbing to $3,988, occupancy reaching a high of 60.3%, and ADRs peaking at $283.
- Conversely, the slowest single month of the year, typically falling within the low season, marks the market's lowest point. In this month, revenue might dip to $2,126, occupancy could drop to 34.3%, and ADRs may adjust down to $243.
- Understanding both the seasonal averages and these monthly peaks and troughs in revenue, occupancy, and ADR is crucial for maximizing your Airbnb profit potential in Shepherdstown.
Seasonal Strategies for Maximizing Profit
- Peak Season: Maximize revenue through premium pricing and potentially longer minimum stays. Ensure high availability.
- Low Season: Offer competitive pricing, special promotions (e.g., extended stay discounts), and flexible cancellation policies. Target off-season travelers like remote workers or budget-conscious guests.
- Shoulder Seasons: Implement dynamic pricing that balances peak and low rates. Target weekend travelers or specific events. Offer slightly more flexible terms than peak season.
- Regularly analyze your own performance against these Shepherdstown seasonality benchmarks and adjust your pricing and availability strategy accordingly.
Best Areas for Airbnb Investment in Shepherdstown (2026)
Exploring the top neighborhoods for short-term rentals in Shepherdstown? This section highlights key areas, outlining why they are attractive for hosts and guests, along with notable local attractions. Consider these locations based on your target guest profile and investment strategy.
| Neighborhood / Area | Why Host Here? (Target Guests & Appeal) | Key Attractions & Landmarks |
|---|---|---|
| Historic Downtown | Charming and picturesque area known for its historic architecture, local shops, and cultural events. Ideal for visitors looking to explore shops, cafes, and the historical aspects of Shepherdstown. | Shepherdstown Museum, Antietam National Battlefield, The Shepherdstown Opera House, Cannon Hill, Local Art Galleries |
| Shepherd University | Home to Shepherd University, this area attracts students and visitors alike. Great for hosting stays during university events, graduations, and sporting events. | Shepherd University, Hustead's Park, Frank Center for the Arts, Campus events, Sports events |
| C&O Canal National Historical Park | A beautiful region with outdoor activities, perfect for nature lovers and those interested in hiking and biking along the historic canal. Good for visitors seeking outdoor adventures. | C&O Canal Towpath, Shepherdstown Riverfront Park, Harpers Ferry National Historical Park, Lock 38 Park, River Activities |
| Potomac River | This area offers scenic views and numerous water activities. Ideal for guests looking to relax by the river and enjoy water-based sports or simply the tranquil environment. | Potomac River, River Rafting, Fishing, Kayaking, Biking trails along the river |
| Marlowe | A small community nearby that offers a peaceful retreat while being close to Shepherdstown. Attractive for guests seeking a quieter atmosphere. | Local Parks, Countryside Views, Antique Shops, Small Cafes, Nature Trails |
| The Appalachian Trail | A well-known hiking trail that attracts outdoor enthusiasts. Ideal for guests looking to explore one of the most famous hiking routes in the U.S. | Segments of the Appalachian Trail, Hiking Opportunities, Scenic Overlooks, Wildlife Viewing, Camping Spots |
| Local Wineries | The surrounding area has several wineries that attract visitors for tastings and tours. Great for guests looking to experience local wine culture. | The Winery at La Grange, Blue Ridge Vineyard, Oregon Hollow Farm, Winery Tours, Wine Tasting Events |
| Local Festivals | Shepherdstown hosts various cultural and art festivals throughout the year, attracting visitors. Accommodations during festivals can be in high demand. | Shepherdstown Street Fest, The Contemporary American Theater Festival, Art in the Park, Local Craft Fairs, Seasonal Events |
Understanding Airbnb License Requirements & STR Laws in Shepherdstown (2026)
While Shepherdstown, West Virginia, United States currently shows low STR regulations, specific Airbnb license requirements might still exist or change. Always verify the latest short term rental regulations and Airbnb license requirements directly with local government authorities for Shepherdstown to ensure full compliance before hosting.
(Source: AirROI data, 2026, based on 2% licensed listings)
Top Performing Airbnb Properties in Shepherdstown (2026)
Benchmark your potential! Explore examples of top-performing Airbnb properties in Shepherdstownbased on Trailing Twelve Month (TTM) revenue. Analyze their characteristics, revenue, occupancy rate, and ADR to understand what drives success in this market.

Graycliff Retreat: 11BR Estate. Game Room+Hot tub.
Entire Place • 11 bedrooms
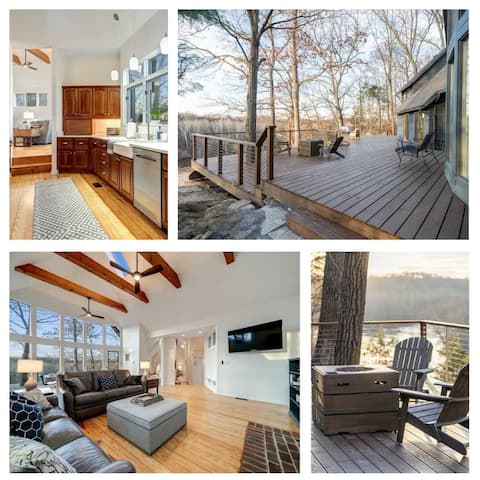
Exclusive Wooded Chalet w/ Magnificent River Views
Entire Place • 4 bedrooms

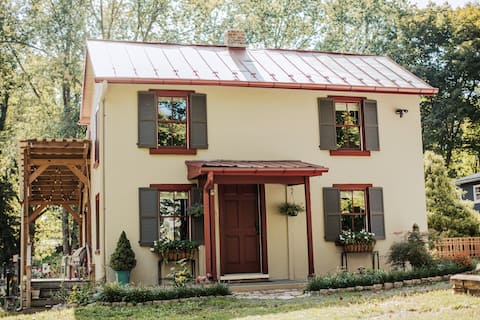
Comfortable and Large Historic House in Shep
Entire Place • 6 bedrooms
The Creekside Cottage: Downtown | Pet-Friendly
Entire Place • 2 bedrooms

NEW * The Getaway Cottage at Rocky Marsh Farm
Entire Place • 2 bedrooms

Graycliff Hall: Luxe Estate w/ Hot Tub, Riverfront
Entire Place • 11 bedrooms
Note: Performance varies based on location, size, amenities, seasonality, and management quality. Data reflects the past 12 months.
Top Performing Airbnb Hosts in Shepherdstown (2026)
Learn from the best! This table showcases top-performing Airbnb hosts in Shepherdstown based on the number of properties managed and estimated total revenue over the past year. Analyze their scale and performance metrics.
| Host Name | Properties | Grossing Revenue | Stay Reviews | Avg Rating |
|---|---|---|---|---|
| Zeb | 6 | $243,552 | 1364 | 4.96/5.0 |
| Luke | 1 | $107,398 | 2 | Not Rated |
| Tony | 1 | $103,379 | 80 | 4.95/5.0 |
| Bryan & Cathy | 2 | $81,999 | 259 | 4.85/5.0 |
| Claudine | 1 | $78,578 | 130 | 4.88/5.0 |
| David | 2 | $67,248 | 162 | 4.96/5.0 |
| Amy | 2 | $65,671 | 536 | 4.93/5.0 |
| Will | 2 | $55,418 | 1373 | 4.97/5.0 |
| Host #92340869 | 1 | $51,393 | 0 | Not Rated |
| Town Run | 3 | $51,259 | 763 | 4.93/5.0 |
Analyzing the strategies of top hosts, such as their property selection, pricing, and guest communication, can offer valuable lessons for optimizing your own Airbnb operations in Shepherdstown.
Dive Deeper: Advanced Shepherdstown STR Market Data (2026)
Ready to unlock more insights? AirROI provides access to advanced metrics and comprehensive Airbnb data for Shepherdstown. Explore detailed analytics beyond this report to refine your investment strategy, optimize pricing, and maximize your vacation rental profits.
Explore Advanced MetricsShepherdstown Short-Term Rental Market Composition (2026): Property & Room Types
Room Type Distribution
Property Type Distribution
Market Composition Insights for Shepherdstown
- The Shepherdstown Airbnb market composition is heavily skewed towards Entire Home/Apt listings, which make up 86% of the 43 active rentals. This indicates strong guest preference for privacy and space.
- Looking at the property type distribution in Shepherdstown, House properties are the most common (53.5%), reflecting the local real estate landscape.
- Houses represent a significant 53.5% portion, catering likely to families or larger groups.
- Smaller segments like others, unique stays (combined 9.4%) offer potential for unique stay experiences.
Shepherdstown Airbnb Room Capacity Analysis (2026): Bedroom Distribution
Distribution of Listings by Number of Bedrooms
Room Capacity Insights for Shepherdstown
- The dominant room capacity in Shepherdstown is 1 bedroom listings, making up 27.9% of the market. This suggests a strong demand for properties suitable for couples or solo travelers.
- Together, 1 bedroom and 2 bedrooms properties represent 48.8% of the active Airbnb listings in Shepherdstown, indicating a high concentration in these sizes.
- A significant 28.0% of listings offer 3+ bedrooms, catering to larger groups and families seeking more space in Shepherdstown.
Shepherdstown Vacation Rental Guest Capacity Trends (2026)
Distribution of Listings by Guest Capacity
Guest Capacity Insights for Shepherdstown
- The most common guest capacity trend in Shepherdstown vacation rentals is listings accommodating 2 guests (23.3%). This suggests the primary traveler segment is likely couples or solo travelers.
- Properties designed for 2 guests and 6 guests dominate the Shepherdstown STR market, accounting for 39.6% of listings.
- 32.6% of properties accommodate 6+ guests, serving the market segment for larger families or group travel in Shepherdstown.
- On average, properties in Shepherdstown are equipped to host 4.0 guests.
Shepherdstown Airbnb Booking Patterns (2026): Available vs. Booked Days
Available Days Distribution
Booked Days Distribution
Booking Pattern Insights for Shepherdstown
- The most common availability pattern in Shepherdstown falls within the 181-270 days range, representing 41.9% of listings. This suggests many properties have significant open periods on their calendars.
- Approximately 60.5% of listings show high availability (181+ days open annually), indicating potential for increased bookings or specific owner usage patterns.
- For booked days, the 181-270 days range is most frequent in Shepherdstown (39.5%), reflecting common guest stay durations or potential owner blocking patterns.
- A notable 41.8% of properties secure long booking periods (181+ days booked per year), highlighting successful long-term rental strategies or significant owner usage.
Shepherdstown Airbnb Minimum Stay Requirements Analysis
Distribution of Listings by Minimum Night Requirement
1 Night
21 listings
48.8% of total
2 Nights
8 listings
18.6% of total
3 Nights
3 listings
7% of total
7-29 Nights
1 listings
2.3% of total
30+ Nights
10 listings
23.3% of total
Key Insights
- The most prevalent minimum stay requirement in Shepherdstown is 1 Night, adopted by 48.8% of listings. This highlights the market's preference for shorter, flexible bookings.
- A strong majority (67.4%) of the Shepherdstown Airbnb data shows acceptance of very short stays (1-2 nights), indicating a dynamic, high-turnover market.
- A significant segment (23.3%) caters to monthly stays (30+ nights) in Shepherdstown, pointing to opportunities in the extended-stay market.
Recommendations
- Align with the market by considering a 1 Night minimum stay, as 48.8% of Shepherdstown hosts use this setting.
- Explore offering discounts for stays of 30+ nights to attract the 23.3% of the market seeking extended stays.
- Adjust minimum nights based on seasonality – potentially shorter during low season and longer during peak demand periods in Shepherdstown.
Shepherdstown Airbnb Cancellation Policy Trends Analysis (2026)
Limited
4 listings
9.3% of total
Flexible
7 listings
16.3% of total
Moderate
14 listings
32.6% of total
Firm
14 listings
32.6% of total
Strict
4 listings
9.3% of total
Cancellation Policy Insights for Shepherdstown
- The prevailing Airbnb cancellation policy trend in Shepherdstown is Moderate, used by 32.6% of listings.
- There's a relatively balanced mix between guest-friendly (48.9%) and stricter (41.9%) policies, offering choices for different guest needs.
- Strict cancellation policies are quite rare (9.3%), potentially making listings with this policy less competitive unless justified by high demand or property type.
Recommendations for Hosts
- Consider adopting a Moderate policy to align with the 32.6% market standard in Shepherdstown.
- Using a Strict policy might deter some guests, as only 9.3% of listings use it. Evaluate if potential revenue protection outweighs possible lower booking rates.
- Regularly review your cancellation policy against competitors and market demand shifts in Shepherdstown.
Shepherdstown STR Booking Lead Time Analysis (2026)
Average Booking Lead Time by Month
Booking Lead Time Insights for Shepherdstown
- The overall average booking lead time for vacation rentals in Shepherdstown is 42 days.
- Guests book furthest in advance for stays during October (average 67 days), likely coinciding with peak travel demand or local events.
- The shortest booking windows occur for stays in February (average 21 days), indicating more last-minute travel plans during this time.
- Seasonally, Fall (55 days avg.) sees the longest lead times, while Winter (30 days avg.) has the shortest, reflecting typical travel planning cycles.
Recommendations for Hosts
- Use the overall average lead time (42 days) as a baseline for your pricing and availability strategy in Shepherdstown.
- For October stays, consider implementing length-of-stay discounts or slightly higher rates for bookings made less than 67 days out to capitalize on advance planning.
- Target marketing efforts for the Fall season well in advance (at least 55 days) to capture early planners.
- Monitor your own booking lead times against these Shepherdstown averages to identify opportunities for dynamic pricing adjustments.
Popular & Essential Airbnb Amenities in Shepherdstown (2026)
Amenity Prevalence
Amenity Insights for Shepherdstown
- Essential amenities in Shepherdstown that guests expect include: Smoke alarm, Wifi, Heating, Free parking on premises, Essentials, Air conditioning. Lacking these (any) could significantly impact bookings.
- Popular amenities like Hot water, Fire extinguisher, Shampoo are common but not universal. Offering these can provide a competitive edge.
Recommendations for Hosts
- Ensure your listing includes all essential amenities for Shepherdstown: Smoke alarm, Wifi, Heating, Free parking on premises, Essentials, Air conditioning.
- Prioritize adding missing essentials: Smoke alarm, Wifi, Heating, Free parking on premises, Essentials, Air conditioning.
- Consider adding popular differentiators like Hot water or Fire extinguisher to increase appeal.
- Highlight unique or less common amenities you offer (e.g., hot tub, dedicated workspace, EV charger) in your listing description and photos.
- Regularly check competitor amenities in Shepherdstown to stay competitive.
Shepherdstown Airbnb Guest Demographics & Profile Analysis (2026)
Guest Profile Summary for Shepherdstown
- The typical guest profile for Airbnb in Shepherdstown consists of primarily domestic travelers (89%), often arriving from nearby Washington, typically belonging to the Post-2000s (Gen Z/Alpha) group (50%), primarily speaking English or Spanish.
- Domestic travelers account for 88.5% of guests.
- Key international markets include United States (88.5%) and DC (8.6%).
- Top languages spoken are English (70.4%) followed by Spanish (10.7%).
- A significant demographic segment is the Post-2000s (Gen Z/Alpha) group, representing 50% of guests.
Recommendations for Hosts
- Target domestic marketing efforts towards travelers from Washington and Baltimore.
- Tailor amenities and listing descriptions to appeal to the dominant Post-2000s (Gen Z/Alpha) demographic (e.g., highlight fast WiFi, smart home features, local guides).
- Highlight unique local experiences or amenities relevant to the primary guest profile.
- Consider seasonal promotions aligned with peak travel times for key origin markets.
Nearby Short-Term Rental Market Comparison
How does the Shepherdstown Airbnb market stack up against its neighbors? Compare key performance metrics like average monthly revenue, ADR, and occupancy rates in surrounding areas to understand the broader regional STR landscape.
| Market | Active Properties | Monthly Revenue | Daily Rate | Avg. Occupancy |
|---|---|---|---|---|
| Polk Township | 15 | $6,974 | $520.26 | 38% |
| Lemont | 21 | $6,940 | $873.93 | 37% |
| College Township | 83 | $6,551 | $848.63 | 36% |
| Centreville | 17 | $6,298 | $565.66 | 45% |
| McGaheysville | 83 | $6,156 | $431.72 | 45% |
| State College | 192 | $6,081 | $712.29 | 40% |
| Mayo | 13 | $5,915 | $447.58 | 51% |
| Shannondale | 45 | $5,808 | $337.30 | 54% |
| Hellam Township | 24 | $5,496 | $386.69 | 45% |
| Stevensville | 80 | $5,412 | $556.79 | 41% |