Pipestem Airbnb Market Analysis 2025: Short Term Rental Data & Vacation Rental Statistics in West Virginia, United States
Is Airbnb profitable in Pipestem in 2025? Explore comprehensive Airbnb analytics for Pipestem, West Virginia, United States to uncover income potential. This 2025 STR market report for Pipestem, based on AirROI data from July 2024 to June 2025, reveals key trends in the niche market of 18 active listings.
Whether you're considering an Airbnb investment in Pipestem, optimizing your existing vacation rental, or exploring rental arbitrage opportunities, understanding the Pipestem Airbnb data is crucial. Leveraging the low regulation environment is key to maximizing your short term rental income potential. Let's dive into the specifics.
Key Pipestem Airbnb Performance Metrics Overview
Monthly Airbnb Revenue Variations & Income Potential in Pipestem (2025)
Understanding the monthly revenue variations for Airbnb listings in Pipestem is key to maximizing your short term rental income potential. Seasonality significantly impacts earnings. Our analysis, based on data from the past 12 months, shows that the peak revenue month for STRs in Pipestem is typically June, while March often presents the lowest earnings, highlighting opportunities for strategic pricing adjustments during shoulder and low seasons. Explore the typical Airbnb income in Pipestem across different performance tiers:
- Best-in-class properties (Top 10%) achieve $4,454+ monthly, often utilizing dynamic pricing and superior guest experiences.
- Strong performing properties (Top 25%) earn $2,952 or more, indicating effective management and desirable locations/amenities.
- Typical properties (Median) generate around $2,108 per month, representing the average market performance.
- Entry-level properties (Bottom 25%) see earnings around $1,409, often with potential for optimization.
Average Monthly Airbnb Earnings Trend in Pipestem
Pipestem Airbnb Occupancy Rate Trends (2025)
Maximize your bookings by understanding the Pipestem STR occupancy trends. Seasonal demand shifts significantly influence how often properties are booked. Typically, Junesees the highest demand (peak season occupancy), while March experiences the lowest (low season). Effective strategies, like adjusting minimum stays or offering promotions, can boost occupancy during slower periods. Here's how different property tiers perform in Pipestem:
- Best-in-class properties (Top 10%) achieve 65%+ occupancy, indicating high desirability and potentially optimized availability.
- Strong performing properties (Top 25%) maintain 52% or higher occupancy, suggesting good market fit and guest satisfaction.
- Typical properties (Median) have an occupancy rate around 38%.
- Entry-level properties (Bottom 25%) average 22% occupancy, potentially facing higher vacancy.
Average Monthly Occupancy Rate Trend in Pipestem
Average Daily Rate (ADR) Airbnb Trends in Pipestem (2025)
Effective short term rental pricing strategy in Pipestem involves understanding monthly ADR fluctuations. The Average Daily Rate (ADR) for Airbnb in Pipestem typically peaks in June and dips lowest during January. Leveraging Airbnb dynamic pricing tools or strategies based on this seasonality can significantly boost revenue. Here's a look at the typical nightly rates achieved:
- Best-in-class properties (Top 10%) command rates of $373+ per night, often due to premium features or locations.
- Strong performing properties (Top 25%) achieve nightly rates of $301 or more.
- Typical properties (Median) charge around $164 per night.
- Entry-level properties (Bottom 25%) earn around $126 per night.
Average Daily Rate (ADR) Trend by Month in Pipestem
Get Live Pipestem Market Intelligence 👇

Explore Real-time Analytics
Airbnb Seasonality Analysis & Trends in Pipestem (2025)
Peak Season (June, July, May)
- Revenue averages $3,329 per month
- Occupancy rates average 51.6%
- Daily rates average $220
Shoulder Season
- Revenue averages $2,331 per month
- Occupancy maintains around 37.3%
- Daily rates hold near $201
Low Season (March, April, November)
- Revenue drops to average $1,493 per month
- Occupancy decreases to average 28.0%
- Daily rates adjust to average $203
Seasonality Insights for Pipestem
- The Airbnb seasonality in Pipestem shows highly seasonal trends requiring careful strategy. While the sections above show seasonal averages, it's also insightful to look at the extremes:
- During the high season, the absolute peak month showcases Pipestem's highest earning potential, with monthly revenues capable of climbing to $3,651, occupancy reaching a high of 57.7%, and ADRs peaking at $240.
- Conversely, the slowest single month of the year, typically falling within the low season, marks the market's lowest point. In this month, revenue might dip to $821, occupancy could drop to 16.7%, and ADRs may adjust down to $196.
- Understanding both the seasonal averages and these monthly peaks and troughs in revenue, occupancy, and ADR is crucial for maximizing your Airbnb profit potential in Pipestem.
Seasonal Strategies for Maximizing Profit
- Peak Season: Maximize revenue through premium pricing and potentially longer minimum stays. Ensure high availability.
- Low Season: Offer competitive pricing, special promotions (e.g., extended stay discounts), and flexible cancellation policies. Target off-season travelers like remote workers or budget-conscious guests.
- Shoulder Seasons: Implement dynamic pricing that balances peak and low rates. Target weekend travelers or specific events. Offer slightly more flexible terms than peak season.
- Regularly analyze your own performance against these Pipestem seasonality benchmarks and adjust your pricing and availability strategy accordingly.
Best Areas for Airbnb Investment in Pipestem (2025)
Exploring the top neighborhoods for short-term rentals in Pipestem? This section highlights key areas, outlining why they are attractive for hosts and guests, along with notable local attractions. Consider these locations based on your target guest profile and investment strategy.
| Neighborhood / Area | Why Host Here? (Target Guests & Appeal) | Key Attractions & Landmarks |
|---|---|---|
| Pipestem Resort State Park | A popular destination for outdoor enthusiasts, featuring stunning views, hiking trails, and a beautiful lodge. Ideal for travelers looking to connect with nature and engage in recreational activities. | Pipestem Resort State Park, Aerial Tramway, Lake Pipestem, Hiking Trails, Wildlife Watching |
| Bluestone Lake | This scenic lake area is known for its boating, fishing, and peaceful retreats. Visitors are drawn to the serene environment and nature-centered activities. | Bluestone Lake, Fishing, Boating, Bird Watching, Picnic Areas |
| Beckley | A nearby city offering urban amenities and attractions while serving as a gateway to the New River Gorge. It appeals to both adventure seekers and those looking for cultural experiences. | Beckley Exhibition Coal Mine, Tamarack, Grandview Park, New River Gorge National Park, Shopping and Dining |
| Huntington | This vibrant city is filled with arts, culture, and history. It attracts visitors looking for events, nightlife, and more urban exploration. | Heritage Farm Museum, Huntington Museum of Art, Pullman Square, Ritter Park, Dining and Entertainment |
| New River Gorge | Renowned for its stunning natural beauty and outdoor adventure opportunities, particularly for rock climbing and white-water rafting. A prime spot for adventure travelers. | New River Gorge National Park, Cliffside Viewpoints, Adventure Sports, Bridge Day Festival |
| Lewisburg | A charming small town known for its arts scene, shops, and historic landmarks. Perfect for visitors seeking a quaint, local experience. | Greenbrier Valley Theater, Lewisburg Historic District, Art Galleries, Local Farms |
| Fayetteville | Close to the New River Gorge, this town offers a mix of outdoor activities and small-town charm. It attracts visitors to its adventures and historical sites. | New River Gorge Bridge, Fayetteville ARTS, Hiking Trails, Local Festivals |
| Summers County | An area rich in history and natural beauty, offering a rural retreat for those looking to escape the hustle and bustle of city life. | Historic Sites, Natural Springs, Outdoor Recreation, Local Cuisine |
Understanding Airbnb License Requirements & STR Laws in Pipestem (2025)
While Pipestem, West Virginia, United States currently shows low STR regulations, specific Airbnb license requirements might still exist or change. Always verify the latest short term rental regulations and Airbnb license requirements directly with local government authorities for Pipestem to ensure full compliance before hosting.
(Source: AirROI data, 2025, finding no licensed listings among those analyzed)
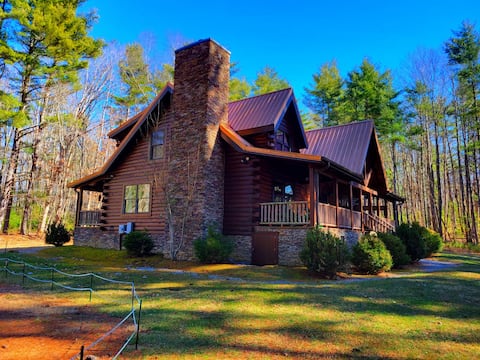
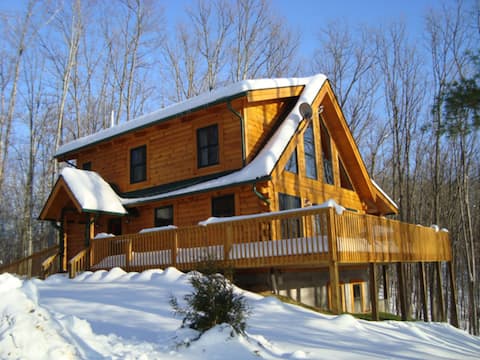
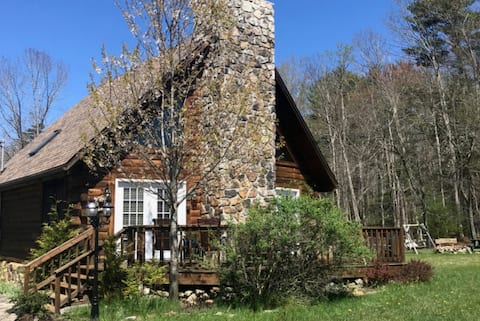
Top Performing Airbnb Properties in Pipestem (2025)
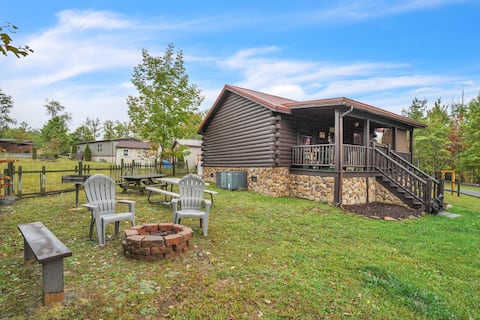
Benchmark your potential! Explore examples of top-performing Airbnb properties in Pipestembased on Trailing Twelve Month (TTM) revenue. Analyze their characteristics, revenue, occupancy rate, and ADR to understand what drives success in this market.
Simply Southern Vacation Paradise
Entire Place • 4 bedrooms
The Black Bear, log cabin with cathedral ceilings
Entire Place • 4 bedrooms
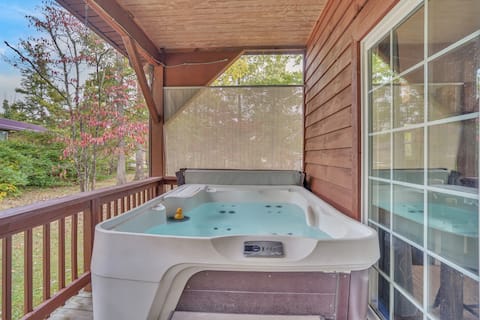
The Retreat at Rock Ridge/HotTub / Pet Friendly/
Entire Place • 2 bedrooms
The Robin at Pipestem Place
Entire Place • 2 bedrooms
Bear Claw Cove Pet friendly/ Hot tub
Entire Place • 1 bedroom
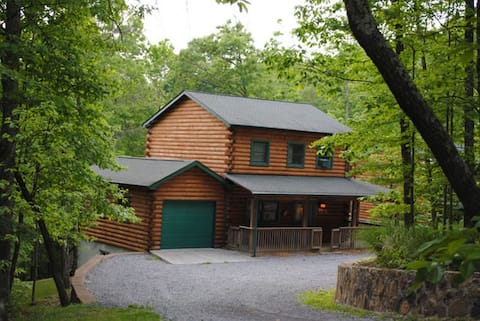
3-storey log cabin, in private woodland setting
Entire Place • 4 bedrooms
Note: Performance varies based on location, size, amenities, seasonality, and management quality. Data reflects the past 12 months.
Top Performing Airbnb Hosts in Pipestem (2025)
Learn from the best! This table showcases top-performing Airbnb hosts in Pipestem based on the number of properties managed and estimated total revenue over the past year. Analyze their scale and performance metrics.
| Host Name | Properties | Grossing Revenue | Stay Reviews | Avg Rating |
|---|---|---|---|---|
| Tammy | 3 | $108,183 | 147 | 4.86/5.0 |
| Coty | 3 | $81,690 | 265 | 4.90/5.0 |
| Lea Ann | 1 | $56,461 | 36 | 4.97/5.0 |
| Anna | 4 | $48,759 | 47 | 4.57/5.0 |
| Danna | 1 | $33,231 | 64 | 4.91/5.0 |
| Peyton | 1 | $20,431 | 60 | 4.88/5.0 |
| Dave | 1 | $20,292 | 180 | 4.96/5.0 |
| Edward | 1 | $18,343 | 58 | 4.90/5.0 |
| David | 1 | $15,782 | 55 | 4.89/5.0 |
| Madison | 2 | $4,778 | 12 | 4.82/5.0 |
Analyzing the strategies of top hosts, such as their property selection, pricing, and guest communication, can offer valuable lessons for optimizing your own Airbnb operations in Pipestem.
Dive Deeper: Advanced Pipestem STR Market Data (2025)
Ready to unlock more insights? AirROI provides access to advanced metrics and comprehensive Airbnb data for Pipestem. Explore detailed analytics beyond this report to refine your investment strategy, optimize pricing, and maximize your vacation rental profits.
Explore Advanced MetricsPipestem Short-Term Rental Market Composition (2025): Property & Room Types
Room Type Distribution
Property Type Distribution
Market Composition Insights for Pipestem
- The Pipestem Airbnb market composition is heavily skewed towards Entire Home/Apt listings, which make up 94.4% of the 18 active rentals. This indicates strong guest preference for privacy and space.
- Looking at the property type distribution in Pipestem, Outdoor/Unique properties are the most common (61.1%), reflecting the local real estate landscape.
- Houses represent a significant 33.3% portion, catering likely to families or larger groups.
- The presence of 5.6% Hotel/Boutique listings indicates integration with traditional hospitality.
Pipestem Airbnb Room Capacity Analysis (2025): Bedroom Distribution
Distribution of Listings by Number of Bedrooms
Room Capacity Insights for Pipestem
- The dominant room capacity in Pipestem is 2 bedrooms listings, making up 44.4% of the market. This suggests a strong demand for properties suitable for couples or solo travelers.
- Together, 2 bedrooms and 4 bedrooms properties represent 66.6% of the active Airbnb listings in Pipestem, indicating a high concentration in these sizes.
- A significant 33.3% of listings offer 3+ bedrooms, catering to larger groups and families seeking more space in Pipestem.
Pipestem Vacation Rental Guest Capacity Trends (2025)
Distribution of Listings by Guest Capacity
Guest Capacity Insights for Pipestem
- The most common guest capacity trend in Pipestem vacation rentals is listings accommodating 8+ guests (33.3%). This suggests the primary traveler segment is likely larger groups.
- Properties designed for 8+ guests and 4 guests dominate the Pipestem STR market, accounting for 61.1% of listings.
- 50.0% of properties accommodate 6+ guests, serving the market segment for larger families or group travel in Pipestem.
- On average, properties in Pipestem are equipped to host 5.6 guests.
Pipestem Airbnb Booking Patterns (2025): Available vs. Booked Days
Available Days Distribution
Booked Days Distribution
Booking Pattern Insights for Pipestem
- The most common availability pattern in Pipestem falls within the 181-270 days range, representing 61.1% of listings. This suggests many properties have significant open periods on their calendars.
- Approximately 94.4% of listings show high availability (181+ days open annually), indicating potential for increased bookings or specific owner usage patterns.
- For booked days, the 91-180 days range is most frequent in Pipestem (50%), reflecting common guest stay durations or potential owner blocking patterns.
- A notable 16.7% of properties secure long booking periods (181+ days booked per year), highlighting successful long-term rental strategies or significant owner usage.
Pipestem Airbnb Minimum Stay Requirements Analysis
Distribution of Listings by Minimum Night Requirement
1 Night
7 listings
41.2% of total
2 Nights
5 listings
29.4% of total
30+ Nights
5 listings
29.4% of total
Key Insights
- The most prevalent minimum stay requirement in Pipestem is 1 Night, adopted by 41.2% of listings. This highlights the market's preference for shorter, flexible bookings.
- A strong majority (70.6%) of the Pipestem Airbnb data shows acceptance of very short stays (1-2 nights), indicating a dynamic, high-turnover market.
- A significant segment (29.4%) caters to monthly stays (30+ nights) in Pipestem, pointing to opportunities in the extended-stay market.
Recommendations
- Align with the market by considering a 1 Night minimum stay, as 41.2% of Pipestem hosts use this setting.
- Explore offering discounts for stays of 30+ nights to attract the 29.4% of the market seeking extended stays.
- Adjust minimum nights based on seasonality – potentially shorter during low season and longer during peak demand periods in Pipestem.
Pipestem Airbnb Cancellation Policy Trends Analysis (2025)
Super Strict 30 Days
3 listings
17.6% of total
Flexible
5 listings
29.4% of total
Moderate
1 listings
5.9% of total
Firm
3 listings
17.6% of total
Strict
5 listings
29.4% of total
Cancellation Policy Insights for Pipestem
- The prevailing Airbnb cancellation policy trend in Pipestem is Flexible, used by 29.4% of listings.
- There's a relatively balanced mix between guest-friendly (35.3%) and stricter (47.0%) policies, offering choices for different guest needs.
Recommendations for Hosts
- Consider adopting a Flexible policy to align with the 29.4% market standard in Pipestem.
- Regularly review your cancellation policy against competitors and market demand shifts in Pipestem.
Pipestem STR Booking Lead Time Analysis (2025)
Average Booking Lead Time by Month
Booking Lead Time Insights for Pipestem
- The overall average booking lead time for vacation rentals in Pipestem is 53 days.
- Guests book furthest in advance for stays during June (average 105 days), likely coinciding with peak travel demand or local events.
- The shortest booking windows occur for stays in January (average 27 days), indicating more last-minute travel plans during this time.
- Seasonally, Summer (72 days avg.) sees the longest lead times, while Winter (39 days avg.) has the shortest, reflecting typical travel planning cycles.
Recommendations for Hosts
- Use the overall average lead time (53 days) as a baseline for your pricing and availability strategy in Pipestem.
- For June stays, consider implementing length-of-stay discounts or slightly higher rates for bookings made less than 105 days out to capitalize on advance planning.
- Target marketing efforts for the Summer season well in advance (at least 72 days) to capture early planners.
- Monitor your own booking lead times against these Pipestem averages to identify opportunities for dynamic pricing adjustments.
Popular & Essential Airbnb Amenities in Pipestem (2025)
Amenity data is currently unavailable for Pipestem.
Pipestem Airbnb Guest Demographics & Profile Analysis (2025)
Guest Profile Summary for Pipestem
- The typical guest profile for Airbnb in Pipestem consists of primarily domestic travelers (98%), often arriving from nearby Cincinnati, typically belonging to the Post-2000s (Gen Z/Alpha) group (50%), primarily speaking English or Spanish.
- Domestic travelers account for 98.1% of guests.
- Key international markets include United States (98.1%) and DC (1.3%).
- Top languages spoken are English (83.3%) followed by Spanish (10.7%).
- A significant demographic segment is the Post-2000s (Gen Z/Alpha) group, representing 50% of guests.
Recommendations for Hosts
- Target domestic marketing efforts towards travelers from Cincinnati and Houston.
- Tailor amenities and listing descriptions to appeal to the dominant Post-2000s (Gen Z/Alpha) demographic (e.g., highlight fast WiFi, smart home features, local guides).
- Highlight unique local experiences or amenities relevant to the primary guest profile.
- Consider seasonal promotions aligned with peak travel times for key origin markets.
Nearby Short-Term Rental Market Comparison
How does the Pipestem Airbnb market stack up against its neighbors? Compare key performance metrics like average monthly revenue, ADR, and occupancy rates in surrounding areas to understand the broader regional STR landscape.
| Market | Active Properties | Monthly Revenue | Daily Rate | Avg. Occupancy |
|---|---|---|---|---|
| Penhook | 17 | $5,132 | $579.83 | 37% |
| Slaty Fork | 38 | $4,294 | $406.72 | 34% |
| Caldwell | 10 | $4,280 | $370.62 | 46% |
| Rockbridge Baths | 12 | $3,928 | $293.26 | 44% |
| Blacksburg | 301 | $3,751 | $482.85 | 40% |
| Victor | 23 | $3,709 | $407.31 | 33% |
| State Road | 16 | $3,541 | $246.14 | 41% |
| Goodview | 26 | $3,481 | $332.99 | 48% |
| Radford | 31 | $3,446 | $369.75 | 41% |
| Semora | 51 | $3,327 | $364.56 | 39% |