Mullens Airbnb Market Analysis 2026: Short Term Rental Data & Vacation Rental Statistics in West Virginia, United States
Is Airbnb profitable in Mullens in 2026? Explore comprehensive Airbnb analytics for Mullens, West Virginia, United States to uncover income potential. This 2026 STR market report for Mullens, based on AirROI data from February 2025 to January 2026, reveals key trends in the niche market of 19 active listings.
Whether you're considering an Airbnb investment in Mullens, optimizing your existing vacation rental, or exploring rental arbitrage opportunities, understanding the Mullens Airbnb data is crucial. Leveraging the low regulation environment is key to maximizing your short term rental income potential. Let's dive into the specifics.
Key Mullens Airbnb Performance Metrics Overview
Monthly Airbnb Revenue Variations & Income Potential in Mullens (2026)
Understanding the monthly revenue variations for Airbnb listings in Mullens is key to maximizing your short term rental income potential. Seasonality significantly impacts earnings. Our analysis, based on data from the past 12 months, shows that the peak revenue month for STRs in Mullens is typically October, while January often presents the lowest earnings, highlighting opportunities for strategic pricing adjustments during shoulder and low seasons. Explore the typical Airbnb income in Mullens across different performance tiers:
- Best-in-class properties (Top 10%) achieve $4,616+ monthly, often utilizing dynamic pricing and superior guest experiences.
- Strong performing properties (Top 25%) earn $3,095 or more, indicating effective management and desirable locations/amenities.
- Typical properties (Median) generate around $2,073 per month, representing the average market performance.
- Entry-level properties (Bottom 25%) see earnings around $1,154, often with potential for optimization.
Average Monthly Airbnb Earnings Trend in Mullens
Mullens Airbnb Occupancy Rate Trends (2026)
Maximize your bookings by understanding the Mullens STR occupancy trends. Seasonal demand shifts significantly influence how often properties are booked. Typically, Octobersees the highest demand (peak season occupancy), while January experiences the lowest (low season). Effective strategies, like adjusting minimum stays or offering promotions, can boost occupancy during slower periods. Here's how different property tiers perform in Mullens:
- Best-in-class properties (Top 10%) achieve 63%+ occupancy, indicating high desirability and potentially optimized availability.
- Strong performing properties (Top 25%) maintain 52% or higher occupancy, suggesting good market fit and guest satisfaction.
- Typical properties (Median) have an occupancy rate around 37%.
- Entry-level properties (Bottom 25%) average 24% occupancy, potentially facing higher vacancy.
Average Monthly Occupancy Rate Trend in Mullens
Average Daily Rate (ADR) Airbnb Trends in Mullens (2026)
Effective short term rental pricing strategy in Mullens involves understanding monthly ADR fluctuations. The Average Daily Rate (ADR) for Airbnb in Mullens typically peaks in September and dips lowest during March. Leveraging Airbnb dynamic pricing tools or strategies based on this seasonality can significantly boost revenue. Here's a look at the typical nightly rates achieved:
- Best-in-class properties (Top 10%) command rates of $258+ per night, often due to premium features or locations.
- Strong performing properties (Top 25%) achieve nightly rates of $210 or more.
- Typical properties (Median) charge around $157 per night.
- Entry-level properties (Bottom 25%) earn around $133 per night.
Average Daily Rate (ADR) Trend by Month in Mullens
Get Live Mullens Market Intelligence 👇
Explore Real-time Analytics
Airbnb Seasonality Analysis & Trends in Mullens (2026)
Peak Season (October, May, August)
- Revenue averages $3,299 per month
- Occupancy rates average 52.4%
- Daily rates average $180
Shoulder Season
- Revenue averages $2,390 per month
- Occupancy maintains around 39.7%
- Daily rates hold near $177
Low Season (January, February, December)
- Revenue drops to average $1,247 per month
- Occupancy decreases to average 21.8%
- Daily rates adjust to average $177
Seasonality Insights for Mullens
- The Airbnb seasonality in Mullens shows highly seasonal trends requiring careful strategy. While the sections above show seasonal averages, it's also insightful to look at the extremes:
- During the high season, the absolute peak month showcases Mullens's highest earning potential, with monthly revenues capable of climbing to $3,870, occupancy reaching a high of 60.0%, and ADRs peaking at $187.
- Conversely, the slowest single month of the year, typically falling within the low season, marks the market's lowest point. In this month, revenue might dip to $1,066, occupancy could drop to 17.9%, and ADRs may adjust down to $162.
- Understanding both the seasonal averages and these monthly peaks and troughs in revenue, occupancy, and ADR is crucial for maximizing your Airbnb profit potential in Mullens.
Seasonal Strategies for Maximizing Profit
- Peak Season: Maximize revenue through premium pricing and potentially longer minimum stays. Ensure high availability.
- Low Season: Offer competitive pricing, special promotions (e.g., extended stay discounts), and flexible cancellation policies. Target off-season travelers like remote workers or budget-conscious guests.
- Shoulder Seasons: Implement dynamic pricing that balances peak and low rates. Target weekend travelers or specific events. Offer slightly more flexible terms than peak season.
- Regularly analyze your own performance against these Mullens seasonality benchmarks and adjust your pricing and availability strategy accordingly.
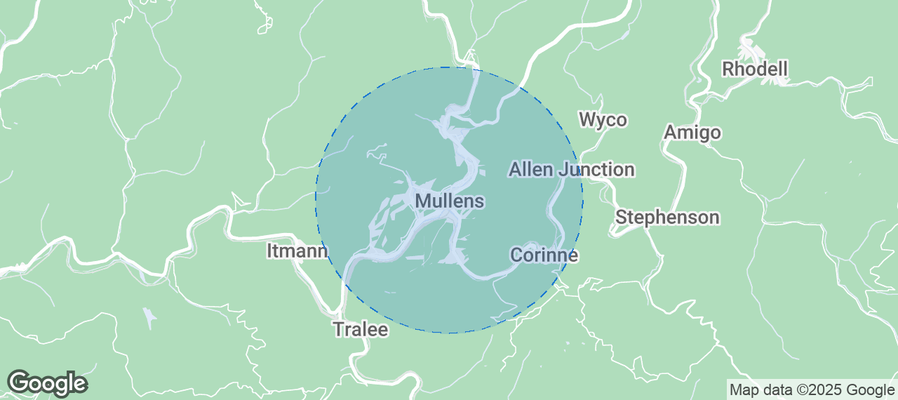
Best Areas for Airbnb Investment in Mullens (2026)
Exploring the top neighborhoods for short-term rentals in Mullens? This section highlights key areas, outlining why they are attractive for hosts and guests, along with notable local attractions. Consider these locations based on your target guest profile and investment strategy.
| Neighborhood / Area | Why Host Here? (Target Guests & Appeal) | Key Attractions & Landmarks |
|---|---|---|
| New River Gorge | A stunning natural area known for outdoor activities such as rock climbing, white-water rafting, and hiking. A favorite destination for adventure seekers and nature enthusiasts. | New River Gorge Bridge, Hawks Nest State Park, Kayaking and rafting on the New River, Rock climbing routes, Canyon Rim Visitor Center |
| Beckley | The largest city in southern West Virginia with a variety of amenities, shopping, and dining options. It's well positioned as a base for travelers exploring the surrounding area. | Beckley Exhibition Coal Mine, Tamarack, Theatre West Virginia, Beckley Art Center, Grandview State Park |
| Lewisburg | A charming small town known for its historic architecture and vibrant arts scene. It's popular with visitors for its shops, restaurants, and cultural events. | Greenbrier Valley Theatre, Lewisburg Historic District, North House Museum, Chemical Trail, The Greenbrier |
| Summersville | Gateway to the Summersville Lake, a popular spot for fishing, boating, and water sports. Attracts outdoor enthusiasts during the summer months. | Summersville Lake, Summersville Dam, Horseshoe Creek, Fishing and water sports, Caving adventures |
| White Sulphur Springs | Known for its natural mineral springs and charming downtown area, it's a great spot for relaxation and attracting spa-goers. | The Greenbrier, White Sulphur Springs Historic District, Natural Bridge, State Fair of West Virginia, Fishing and hiking nearby |
| Fayetteville | A small town located near the New River Gorge, it is known for its beautiful landscapes and is a hub for adventure activities, making it ideal for tourists. | New River Gorge National Park, Bridge Day Festival, White Water Rafting on the New River, Historic Town, Biking trails |
| South Charleston | A suburban area with easy access to Charleston, the state capital. It offers a mix of shopping, dining, and local attractions. | Little Creek Park, South Charleston Museum, Shopping centers, Restaurants, Nearby Kanawha State Forest |
| Clarksburg | A city with a rich history and plenty of cultural events. It provides a good opportunity for short-term rentals for both business and leisure travelers. | Clarksburg City Park, CIVIC Center, Cultural festivals, Historic downtown, Local wineries |
Understanding Airbnb License Requirements & STR Laws in Mullens (2026)
While Mullens, West Virginia, United States currently shows low STR regulations, specific Airbnb license requirements might still exist or change. Always verify the latest short term rental regulations and Airbnb license requirements directly with local government authorities for Mullens to ensure full compliance before hosting.
(Source: AirROI data, 2026, finding no licensed listings among those analyzed)
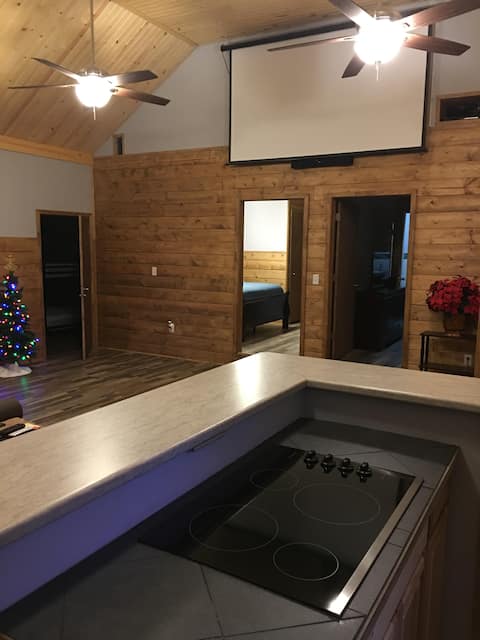
Top Performing Airbnb Properties in Mullens (2026)
Benchmark your potential! Explore examples of top-performing Airbnb properties in Mullensbased on Trailing Twelve Month (TTM) revenue. Analyze their characteristics, revenue, occupancy rate, and ADR to understand what drives success in this market.
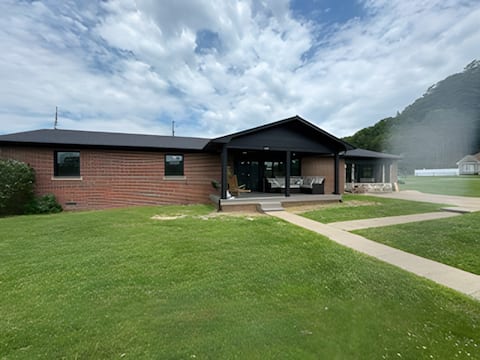
The Big House - 5 Bedroom/2 bath
Entire Place • 5 bedrooms

*NEW*- Large Cabin in Mullens- Close to trails
Entire Place • 3 bedrooms
The Bear Cave - Full Suite
Entire Place • 3 bedrooms

Cheerful four bedroom home invites adventurers
Entire Place • 4 bedrooms

Nest - 2 bedroom/1 bath
Entire Place • 2 bedrooms

The Mullins House on The Avenue
Entire Place • 2 bedrooms
Note: Performance varies based on location, size, amenities, seasonality, and management quality. Data reflects the past 12 months.
Top Performing Airbnb Hosts in Mullens (2026)
Learn from the best! This table showcases top-performing Airbnb hosts in Mullens based on the number of properties managed and estimated total revenue over the past year. Analyze their scale and performance metrics.
| Host Name | Properties | Grossing Revenue | Stay Reviews | Avg Rating |
|---|---|---|---|---|
| Casey Parr | 3 | $126,008 | 98 | 4.99/5.0 |
| Wanda | 3 | $98,473 | 146 | 4.99/5.0 |
| Evolve | 2 | $53,643 | 63 | 4.93/5.0 |
| Barry | 1 | $45,414 | 21 | 5.00/5.0 |
| Jacob | 3 | $38,518 | 36 | 4.56/5.0 |
| Daniel | 1 | $38,216 | 63 | 4.90/5.0 |
| Jason | 1 | $30,339 | 17 | 5.00/5.0 |
| Kevin | 1 | $25,383 | 21 | 4.95/5.0 |
| Nate | 1 | $20,873 | 45 | 4.89/5.0 |
| Jennifer | 2 | $12,806 | 45 | 4.91/5.0 |
Analyzing the strategies of top hosts, such as their property selection, pricing, and guest communication, can offer valuable lessons for optimizing your own Airbnb operations in Mullens.
Dive Deeper: Advanced Mullens STR Market Data (2026)
Ready to unlock more insights? AirROI provides access to advanced metrics and comprehensive Airbnb data for Mullens. Explore detailed analytics beyond this report to refine your investment strategy, optimize pricing, and maximize your vacation rental profits.
Explore Advanced MetricsMullens Short-Term Rental Market Composition (2026): Property & Room Types
Room Type Distribution
Property Type Distribution
Market Composition Insights for Mullens
- The Mullens Airbnb market composition is heavily skewed towards Entire Home/Apt listings, which make up 100% of the 19 active rentals. This indicates strong guest preference for privacy and space.
- Looking at the property type distribution in Mullens, House properties are the most common (52.6%), reflecting the local real estate landscape.
- Houses represent a significant 52.6% portion, catering likely to families or larger groups.
Mullens Airbnb Room Capacity Analysis (2026): Bedroom Distribution
Distribution of Listings by Number of Bedrooms
Room Capacity Insights for Mullens
- The dominant room capacity in Mullens is 2 bedrooms listings, making up 31.6% of the market. This suggests a strong demand for properties suitable for couples or solo travelers.
- Together, 2 bedrooms and 3 bedrooms properties represent 52.7% of the active Airbnb listings in Mullens, indicating a high concentration in these sizes.
- A significant 42.1% of listings offer 3+ bedrooms, catering to larger groups and families seeking more space in Mullens.
Mullens Vacation Rental Guest Capacity Trends (2026)
Distribution of Listings by Guest Capacity
Guest Capacity Insights for Mullens
- The most common guest capacity trend in Mullens vacation rentals is listings accommodating 8+ guests (52.6%). This suggests the primary traveler segment is likely larger groups.
- Properties designed for 8+ guests and 4 guests dominate the Mullens STR market, accounting for 78.9% of listings.
- 63.1% of properties accommodate 6+ guests, serving the market segment for larger families or group travel in Mullens.
- On average, properties in Mullens are equipped to host 6.5 guests.
Mullens Airbnb Booking Patterns (2026): Available vs. Booked Days
Available Days Distribution
Booked Days Distribution
Booking Pattern Insights for Mullens
- The most common availability pattern in Mullens falls within the 181-270 days range, representing 63.2% of listings. This suggests many properties have significant open periods on their calendars.
- Approximately 89.5% of listings show high availability (181+ days open annually), indicating potential for increased bookings or specific owner usage patterns.
- For booked days, the 91-180 days range is most frequent in Mullens (63.2%), reflecting common guest stay durations or potential owner blocking patterns.
- A notable 15.8% of properties secure long booking periods (181+ days booked per year), highlighting successful long-term rental strategies or significant owner usage.
Mullens Airbnb Minimum Stay Requirements Analysis
Distribution of Listings by Minimum Night Requirement
1 Night
7 listings
36.8% of total
2 Nights
8 listings
42.1% of total
30+ Nights
4 listings
21.1% of total
Key Insights
- The most prevalent minimum stay requirement in Mullens is 2 Nights, adopted by 42.1% of listings. This highlights the market's preference for shorter, flexible bookings.
- A strong majority (78.9%) of the Mullens Airbnb data shows acceptance of very short stays (1-2 nights), indicating a dynamic, high-turnover market.
- A significant segment (21.1%) caters to monthly stays (30+ nights) in Mullens, pointing to opportunities in the extended-stay market.
Recommendations
- Align with the market by considering a 2 Nights minimum stay, as 42.1% of Mullens hosts use this setting.
- Explore offering discounts for stays of 30+ nights to attract the 21.1% of the market seeking extended stays.
- Adjust minimum nights based on seasonality – potentially shorter during low season and longer during peak demand periods in Mullens.
Mullens Airbnb Cancellation Policy Trends Analysis (2026)
Flexible
3 listings
15.8% of total
Moderate
12 listings
63.2% of total
Firm
2 listings
10.5% of total
Strict
2 listings
10.5% of total
Cancellation Policy Insights for Mullens
- The prevailing Airbnb cancellation policy trend in Mullens is Moderate, used by 63.2% of listings.
- The market strongly favors guest-friendly terms, with 79.0% of listings offering Flexible or Moderate policies. This suggests guests in Mullens may expect booking flexibility.
Recommendations for Hosts
- Consider adopting a Moderate policy to align with the 63.2% market standard in Mullens.
- Using a Strict policy might deter some guests, as only 10.5% of listings use it. Evaluate if potential revenue protection outweighs possible lower booking rates.
- Regularly review your cancellation policy against competitors and market demand shifts in Mullens.
Mullens STR Booking Lead Time Analysis (2026)
Average Booking Lead Time by Month
Booking Lead Time Insights for Mullens
- The overall average booking lead time for vacation rentals in Mullens is 42 days.
- Guests book furthest in advance for stays during May (average 67 days), likely coinciding with peak travel demand or local events.
- The shortest booking windows occur for stays in February (average 26 days), indicating more last-minute travel plans during this time.
- Seasonally, Spring (55 days avg.) sees the longest lead times, while Winter (30 days avg.) has the shortest, reflecting typical travel planning cycles.
Recommendations for Hosts
- Use the overall average lead time (42 days) as a baseline for your pricing and availability strategy in Mullens.
- For May stays, consider implementing length-of-stay discounts or slightly higher rates for bookings made less than 67 days out to capitalize on advance planning.
- Target marketing efforts for the Spring season well in advance (at least 55 days) to capture early planners.
- Monitor your own booking lead times against these Mullens averages to identify opportunities for dynamic pricing adjustments.
Popular & Essential Airbnb Amenities in Mullens (2026)
Amenity Prevalence
Amenity Insights for Mullens
- Essential amenities in Mullens that guests expect include: Wifi. Lacking these (this) could significantly impact bookings.
- Popular amenities like BBQ grill, Air conditioning, TV are common but not universal. Offering these can provide a competitive edge.
Recommendations for Hosts
- Ensure your listing includes all essential amenities for Mullens: Wifi.
- Consider adding popular differentiators like BBQ grill or Air conditioning to increase appeal.
- Highlight unique or less common amenities you offer (e.g., hot tub, dedicated workspace, EV charger) in your listing description and photos.
- Regularly check competitor amenities in Mullens to stay competitive.
Mullens Airbnb Guest Demographics & Profile Analysis (2026)
Guest Profile Summary for Mullens
- The typical guest profile for Airbnb in Mullens consists of primarily domestic travelers (100%), often arriving from nearby Cleveland, typically belonging to the Post-2000s (Gen Z/Alpha) group (50%), primarily speaking English or Bengali.
- Domestic travelers account for 100.0% of guests.
- Top languages spoken are English (88.5%) followed by Bengali (3.8%).
- A significant demographic segment is the Post-2000s (Gen Z/Alpha) group, representing 50% of guests.
Recommendations for Hosts
- Target domestic marketing efforts towards travelers from Cleveland and Pelham.
- Tailor amenities and listing descriptions to appeal to the dominant Post-2000s (Gen Z/Alpha) demographic (e.g., highlight fast WiFi, smart home features, local guides).
- Highlight unique local experiences or amenities relevant to the primary guest profile.
- Consider seasonal promotions aligned with peak travel times for key origin markets.
Nearby Short-Term Rental Market Comparison
How does the Mullens Airbnb market stack up against its neighbors? Compare key performance metrics like average monthly revenue, ADR, and occupancy rates in surrounding areas to understand the broader regional STR landscape.
| Market | Active Properties | Monthly Revenue | Daily Rate | Avg. Occupancy |
|---|---|---|---|---|
| Blacksburg | 297 | $4,116 | $509.14 | 40% |
| Victor | 21 | $3,854 | $450.02 | 33% |
| Slaty Fork | 48 | $3,687 | $424.67 | 32% |
| Lansing | 16 | $3,587 | $254.18 | 48% |
| Dublin | 30 | $3,580 | $287.49 | 43% |
| Watauga County | 47 | $3,370 | $314.71 | 39% |
| Blowing Rock | 426 | $3,209 | $339.38 | 38% |
| Valle Crucis | 57 | $3,158 | $343.61 | 36% |
| Radford | 36 | $3,058 | $325.91 | 41% |
| Piney Flats | 23 | $3,040 | $317.38 | 39% |