Marlinton Airbnb Market Analysis 2026: Short Term Rental Data & Vacation Rental Statistics in West Virginia, United States
Is Airbnb profitable in Marlinton in 2026? Explore comprehensive Airbnb analytics for Marlinton, West Virginia, United States to uncover income potential. This 2026 STR market report for Marlinton, based on AirROI data from February 2025 to January 2026, reveals key trends in the niche market of 67 active listings.
Whether you're considering an Airbnb investment in Marlinton, optimizing your existing vacation rental, or exploring rental arbitrage opportunities, understanding the Marlinton Airbnb data is crucial. Leveraging the low regulation environment is key to maximizing your short term rental income potential. Let's dive into the specifics.
Key Marlinton Airbnb Performance Metrics Overview
Monthly Airbnb Revenue Variations & Income Potential in Marlinton (2026)
Understanding the monthly revenue variations for Airbnb listings in Marlinton is key to maximizing your short term rental income potential. Seasonality significantly impacts earnings. Our analysis, based on data from the past 12 months, shows that the peak revenue month for STRs in Marlinton is typically October, while March often presents the lowest earnings, highlighting opportunities for strategic pricing adjustments during shoulder and low seasons. Explore the typical Airbnb income in Marlinton across different performance tiers:
- Best-in-class properties (Top 10%) achieve $3,650+ monthly, often utilizing dynamic pricing and superior guest experiences.
- Strong performing properties (Top 25%) earn $2,568 or more, indicating effective management and desirable locations/amenities.
- Typical properties (Median) generate around $1,652 per month, representing the average market performance.
- Entry-level properties (Bottom 25%) see earnings around $905, often with potential for optimization.
Average Monthly Airbnb Earnings Trend in Marlinton
Marlinton Airbnb Occupancy Rate Trends (2026)
Maximize your bookings by understanding the Marlinton STR occupancy trends. Seasonal demand shifts significantly influence how often properties are booked. Typically, Octobersees the highest demand (peak season occupancy), while March experiences the lowest (low season). Effective strategies, like adjusting minimum stays or offering promotions, can boost occupancy during slower periods. Here's how different property tiers perform in Marlinton:
- Best-in-class properties (Top 10%) achieve 72%+ occupancy, indicating high desirability and potentially optimized availability.
- Strong performing properties (Top 25%) maintain 54% or higher occupancy, suggesting good market fit and guest satisfaction.
- Typical properties (Median) have an occupancy rate around 37%.
- Entry-level properties (Bottom 25%) average 21% occupancy, potentially facing higher vacancy.
Average Monthly Occupancy Rate Trend in Marlinton
Average Daily Rate (ADR) Airbnb Trends in Marlinton (2026)
Effective short term rental pricing strategy in Marlinton involves understanding monthly ADR fluctuations. The Average Daily Rate (ADR) for Airbnb in Marlinton typically peaks in January and dips lowest during April. Leveraging Airbnb dynamic pricing tools or strategies based on this seasonality can significantly boost revenue. Here's a look at the typical nightly rates achieved:
- Best-in-class properties (Top 10%) command rates of $208+ per night, often due to premium features or locations.
- Strong performing properties (Top 25%) achieve nightly rates of $176 or more.
- Typical properties (Median) charge around $142 per night.
- Entry-level properties (Bottom 25%) earn around $121 per night.
Average Daily Rate (ADR) Trend by Month in Marlinton
Get Live Marlinton Market Intelligence 👇
Explore Real-time Analytics
Airbnb Seasonality Analysis & Trends in Marlinton (2026)
Peak Season (October, July, August)
- Revenue averages $2,371 per month
- Occupancy rates average 48.4%
- Daily rates average $153
Shoulder Season
- Revenue averages $1,926 per month
- Occupancy maintains around 39.3%
- Daily rates hold near $160
Low Season (March, April, May)
- Revenue drops to average $1,352 per month
- Occupancy decreases to average 29.7%
- Daily rates adjust to average $135
Seasonality Insights for Marlinton
- The Airbnb seasonality in Marlinton shows highly seasonal trends requiring careful strategy. While the sections above show seasonal averages, it's also insightful to look at the extremes:
- During the high season, the absolute peak month showcases Marlinton's highest earning potential, with monthly revenues capable of climbing to $2,525, occupancy reaching a high of 50.9%, and ADRs peaking at $180.
- Conversely, the slowest single month of the year, typically falling within the low season, marks the market's lowest point. In this month, revenue might dip to $1,163, occupancy could drop to 27.0%, and ADRs may adjust down to $132.
- Understanding both the seasonal averages and these monthly peaks and troughs in revenue, occupancy, and ADR is crucial for maximizing your Airbnb profit potential in Marlinton.
Seasonal Strategies for Maximizing Profit
- Peak Season: Maximize revenue through premium pricing and potentially longer minimum stays. Ensure high availability.
- Low Season: Offer competitive pricing, special promotions (e.g., extended stay discounts), and flexible cancellation policies. Target off-season travelers like remote workers or budget-conscious guests.
- Shoulder Seasons: Implement dynamic pricing that balances peak and low rates. Target weekend travelers or specific events. Offer slightly more flexible terms than peak season.
- Regularly analyze your own performance against these Marlinton seasonality benchmarks and adjust your pricing and availability strategy accordingly.
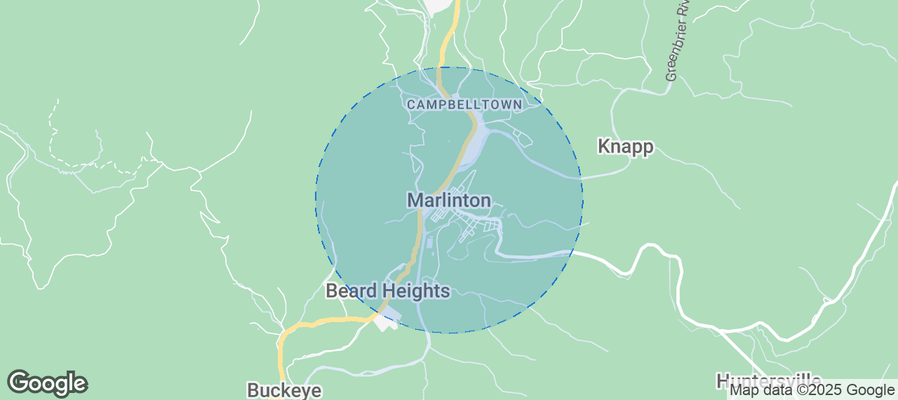
Best Areas for Airbnb Investment in Marlinton (2026)
Exploring the top neighborhoods for short-term rentals in Marlinton? This section highlights key areas, outlining why they are attractive for hosts and guests, along with notable local attractions. Consider these locations based on your target guest profile and investment strategy.
| Neighborhood / Area | Why Host Here? (Target Guests & Appeal) | Key Attractions & Landmarks |
|---|---|---|
| Downtown Marlinton | The heart of Marlinton, offering charming local shops, restaurants, and easy access to outdoor activities. Ideal for visitors who want to explore the local culture and community. | Marlinton Railroad Depot, Greenbrier River Trail, Marlinton City Park, local dining options, historic buildings |
| Watoga State Park | A beautiful state park located just outside Marlinton, popular for nature lovers and outdoor enthusiasts. It attracts visitors looking for camping, hiking, and fishing experiences. | Watoga State Park, Lake Sherwood, hiking trails, wildlife viewing, picnic areas |
| Snowshoe Mountain | A premier ski resort near Marlinton, known for its winter sports and summer mountain biking. A great location for year-round outdoor adventure lovers. | Snowshoe Ski Resort, Mountain biking trails, winter sports activities, Scenic views, Alpine Lake |
| Greenbrier River | Offering serene views and recreational opportunities, this area attracts those looking for river activities like fishing and kayaking, as well as peaceful retreats. | Greenbrier River, fishing spots, kayaking, scenic trails, local wildlife |
| Highland Scenic Highway | A scenic byway that offers breathtaking views of the Appalachian Mountains, popular for travelers seeking picturesque drives and hiking. | Highland Scenic Highway, Bald Knob overlook, hiking trails, nature photography, camping spots |
| Cranberry Wilderness | A remote wilderness area known for its rugged terrain and beautiful landscapes, perfect for those looking for a back-to-nature experience. | Cranberry Glades Botanical Area, hiking trails, wild camping, moorland ecosystems, birdwatching |
| Pocahontas County Historical Society | A rich historical area where visitors can learn about local history, culture, and heritage, appealing to history buffs and families. | Historical exhibits, local artifacts, community events, heritage preservation, guided tours |
| Local Farms and Villages | Surrounding Marlinton, these areas offer farm experiences and community events, perfect for tourists interested in agritourism and local produce. | local farmer's markets, community events, cider mills, U-pick farms, farm tours |
Understanding Airbnb License Requirements & STR Laws in Marlinton (2026)
While Marlinton, West Virginia, United States currently shows low STR regulations, specific Airbnb license requirements might still exist or change. Always verify the latest short term rental regulations and Airbnb license requirements directly with local government authorities for Marlinton to ensure full compliance before hosting.
(Source: AirROI data, 2026, finding no licensed listings among those analyzed)
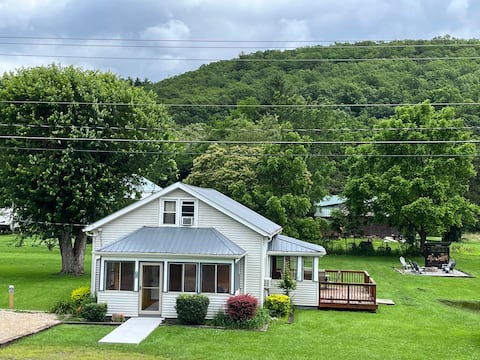
Top Performing Airbnb Properties in Marlinton (2026)
Benchmark your potential! Explore examples of top-performing Airbnb properties in Marlintonbased on Trailing Twelve Month (TTM) revenue. Analyze their characteristics, revenue, occupancy rate, and ADR to understand what drives success in this market.

Loring Cabin
Entire Place • 4 bedrooms

Guesthouse on Lonesome Hollow: Hot Tub & Mtn Views
Entire Place • 1 bedroom

Historic Pre-Civil War Cabin w/Hot Tub & Fireplace
Entire Place • 1 bedroom
Riverside Oasis-Large Backyard with Firepit
Entire Place • 2 bedrooms

Historic Secluded Log Cabin near Snowshoe Mountain
Entire Place • 2 bedrooms

Lee Cabin
Entire Place • 2 bedrooms
Note: Performance varies based on location, size, amenities, seasonality, and management quality. Data reflects the past 12 months.
Top Performing Airbnb Hosts in Marlinton (2026)
Learn from the best! This table showcases top-performing Airbnb hosts in Marlinton based on the number of properties managed and estimated total revenue over the past year. Analyze their scale and performance metrics.
| Host Name | Properties | Grossing Revenue | Stay Reviews | Avg Rating |
|---|---|---|---|---|
| Lindie | 5 | $156,152 | 417 | 4.91/5.0 |
| Evolve | 8 | $143,307 | 183 | 4.73/5.0 |
| Olivia | 10 | $124,373 | 1033 | 4.92/5.0 |
| Caley | 3 | $103,334 | 189 | 4.98/5.0 |
| Geoffrey | 9 | $101,721 | 74 | 4.89/5.0 |
| Melinda | 2 | $82,491 | 240 | 5.00/5.0 |
| Craig | 1 | $45,518 | 151 | 4.97/5.0 |
| Joseph | 3 | $45,111 | 61 | 4.98/5.0 |
| Patricia | 2 | $40,475 | 100 | 4.93/5.0 |
| Kristie | 1 | $31,721 | 489 | 4.95/5.0 |
Analyzing the strategies of top hosts, such as their property selection, pricing, and guest communication, can offer valuable lessons for optimizing your own Airbnb operations in Marlinton.
Dive Deeper: Advanced Marlinton STR Market Data (2026)
Ready to unlock more insights? AirROI provides access to advanced metrics and comprehensive Airbnb data for Marlinton. Explore detailed analytics beyond this report to refine your investment strategy, optimize pricing, and maximize your vacation rental profits.
Explore Advanced MetricsMarlinton Short-Term Rental Market Composition (2026): Property & Room Types
Room Type Distribution
Property Type Distribution
Market Composition Insights for Marlinton
- The Marlinton Airbnb market composition is heavily skewed towards Entire Home/Apt listings, which make up 83.6% of the 67 active rentals. This indicates strong guest preference for privacy and space.
- Looking at the property type distribution in Marlinton, Outdoor/Unique properties are the most common (37.3%), reflecting the local real estate landscape.
- Houses represent a significant 25.4% portion, catering likely to families or larger groups.
- The presence of 16.4% Hotel/Boutique listings indicates integration with traditional hospitality.
- Smaller segments like others (combined 4.5%) offer potential for unique stay experiences.
Marlinton Airbnb Room Capacity Analysis (2026): Bedroom Distribution
Distribution of Listings by Number of Bedrooms
Room Capacity Insights for Marlinton
- The dominant room capacity in Marlinton is 1 bedroom listings, making up 44.8% of the market. This suggests a strong demand for properties suitable for couples or solo travelers.
- Together, 1 bedroom and 2 bedrooms properties represent 80.6% of the active Airbnb listings in Marlinton, indicating a high concentration in these sizes.
Marlinton Vacation Rental Guest Capacity Trends (2026)
Distribution of Listings by Guest Capacity
Guest Capacity Insights for Marlinton
- The most common guest capacity trend in Marlinton vacation rentals is listings accommodating 2 guests (29.9%). This suggests the primary traveler segment is likely couples or solo travelers.
- Properties designed for 2 guests and 4 guests dominate the Marlinton STR market, accounting for 59.8% of listings.
- 23.9% of properties accommodate 6+ guests, serving the market segment for larger families or group travel in Marlinton.
- On average, properties in Marlinton are equipped to host 4.0 guests.
Marlinton Airbnb Booking Patterns (2026): Available vs. Booked Days
Available Days Distribution
Booked Days Distribution
Booking Pattern Insights for Marlinton
- The most common availability pattern in Marlinton falls within the 271-366 days range, representing 41.8% of listings. This suggests many properties have significant open periods on their calendars.
- Approximately 83.6% of listings show high availability (181+ days open annually), indicating potential for increased bookings or specific owner usage patterns.
- For booked days, the 91-180 days range is most frequent in Marlinton (43.3%), reflecting common guest stay durations or potential owner blocking patterns.
- A notable 17.9% of properties secure long booking periods (181+ days booked per year), highlighting successful long-term rental strategies or significant owner usage.
Marlinton Airbnb Minimum Stay Requirements Analysis
Distribution of Listings by Minimum Night Requirement
1 Night
28 listings
41.8% of total
2 Nights
29 listings
43.3% of total
30+ Nights
10 listings
14.9% of total
Key Insights
- The most prevalent minimum stay requirement in Marlinton is 2 Nights, adopted by 43.3% of listings. This highlights the market's preference for shorter, flexible bookings.
- A strong majority (85.1%) of the Marlinton Airbnb data shows acceptance of very short stays (1-2 nights), indicating a dynamic, high-turnover market.
- A significant segment (14.9%) caters to monthly stays (30+ nights) in Marlinton, pointing to opportunities in the extended-stay market.
Recommendations
- Align with the market by considering a 2 Nights minimum stay, as 43.3% of Marlinton hosts use this setting.
- Explore offering discounts for stays of 30+ nights to attract the 14.9% of the market seeking extended stays.
- Adjust minimum nights based on seasonality – potentially shorter during low season and longer during peak demand periods in Marlinton.
Marlinton Airbnb Cancellation Policy Trends Analysis (2026)
Limited
6 listings
9% of total
Flexible
5 listings
7.5% of total
Moderate
31 listings
46.3% of total
Firm
18 listings
26.9% of total
Strict
7 listings
10.4% of total
Cancellation Policy Insights for Marlinton
- The prevailing Airbnb cancellation policy trend in Marlinton is Moderate, used by 46.3% of listings.
- There's a relatively balanced mix between guest-friendly (53.8%) and stricter (37.3%) policies, offering choices for different guest needs.
Recommendations for Hosts
- Consider adopting a Moderate policy to align with the 46.3% market standard in Marlinton.
- Using a Strict policy might deter some guests, as only 10.4% of listings use it. Evaluate if potential revenue protection outweighs possible lower booking rates.
- Regularly review your cancellation policy against competitors and market demand shifts in Marlinton.
Marlinton STR Booking Lead Time Analysis (2026)
Average Booking Lead Time by Month
Booking Lead Time Insights for Marlinton
- The overall average booking lead time for vacation rentals in Marlinton is 45 days.
- Guests book furthest in advance for stays during July (average 71 days), likely coinciding with peak travel demand or local events.
- The shortest booking windows occur for stays in February (average 19 days), indicating more last-minute travel plans during this time.
- Seasonally, Fall (58 days avg.) sees the longest lead times, while Winter (26 days avg.) has the shortest, reflecting typical travel planning cycles.
Recommendations for Hosts
- Use the overall average lead time (45 days) as a baseline for your pricing and availability strategy in Marlinton.
- For July stays, consider implementing length-of-stay discounts or slightly higher rates for bookings made less than 71 days out to capitalize on advance planning.
- Target marketing efforts for the Fall season well in advance (at least 58 days) to capture early planners.
- Monitor your own booking lead times against these Marlinton averages to identify opportunities for dynamic pricing adjustments.
Popular & Essential Airbnb Amenities in Marlinton (2026)
Amenity Prevalence
Amenity Insights for Marlinton
- Essential amenities in Marlinton that guests expect include: Smoke alarm, Fire extinguisher, Coffee maker. Lacking these (any) could significantly impact bookings.
- Popular amenities like Bed linens, TV, Microwave are common but not universal. Offering these can provide a competitive edge.
- Warning: Wifi is not universally provided but is considered essential globally. Ensure reliable Wifi is offered.
Recommendations for Hosts
- Ensure your listing includes all essential amenities for Marlinton: Smoke alarm, Fire extinguisher, Coffee maker.
- Prioritize adding missing essentials: Fire extinguisher, Coffee maker.
- Consider adding popular differentiators like Bed linens or TV to increase appeal.
- Highlight unique or less common amenities you offer (e.g., hot tub, dedicated workspace, EV charger) in your listing description and photos.
- Regularly check competitor amenities in Marlinton to stay competitive.
Marlinton Airbnb Guest Demographics & Profile Analysis (2026)
Guest Profile Summary for Marlinton
- The typical guest profile for Airbnb in Marlinton consists of primarily domestic travelers (97%), often arriving from nearby Richmond, typically belonging to the Post-2000s (Gen Z/Alpha) group (50%), primarily speaking English or Spanish.
- Domestic travelers account for 96.8% of guests.
- Key international markets include United States (96.8%) and DC (1.9%).
- Top languages spoken are English (75.6%) followed by Spanish (9%).
- A significant demographic segment is the Post-2000s (Gen Z/Alpha) group, representing 50% of guests.
Recommendations for Hosts
- Target domestic marketing efforts towards travelers from Richmond and Pittsburgh.
- Tailor amenities and listing descriptions to appeal to the dominant Post-2000s (Gen Z/Alpha) demographic (e.g., highlight fast WiFi, smart home features, local guides).
- Highlight unique local experiences or amenities relevant to the primary guest profile.
- Consider seasonal promotions aligned with peak travel times for key origin markets.
Nearby Short-Term Rental Market Comparison
How does the Marlinton Airbnb market stack up against its neighbors? Compare key performance metrics like average monthly revenue, ADR, and occupancy rates in surrounding areas to understand the broader regional STR landscape.
| Market | Active Properties | Monthly Revenue | Daily Rate | Avg. Occupancy |
|---|---|---|---|---|
| Penhook | 18 | $5,675 | $678.75 | 37% |
| Rockbridge Baths | 12 | $4,144 | $298.35 | 45% |
| Blacksburg | 297 | $4,116 | $509.14 | 40% |
| Goodview | 31 | $3,953 | $401.90 | 44% |
| McHenry | 605 | $3,928 | $598.59 | 28% |
| Swanton | 250 | $3,870 | $639.77 | 30% |
| Victor | 21 | $3,854 | $450.02 | 33% |
| Garrett County | 11 | $3,848 | $705.84 | 24% |
| Hot Springs | 27 | $3,785 | $336.52 | 41% |
| Slaty Fork | 48 | $3,687 | $424.67 | 32% |