Lost City Airbnb Market Analysis 2026: Short Term Rental Data & Vacation Rental Statistics in West Virginia, United States
Is Airbnb profitable in Lost City in 2026? Explore comprehensive Airbnb analytics for Lost City, West Virginia, United States to uncover income potential. This 2026 STR market report for Lost City, based on AirROI data from February 2025 to January 2026, reveals key trends in the niche market of 37 active listings.
Whether you're considering an Airbnb investment in Lost City, optimizing your existing vacation rental, or exploring rental arbitrage opportunities, understanding the Lost City Airbnb data is crucial. Leveraging the low regulation environment is key to maximizing your short term rental income potential. Let's dive into the specifics.
Key Lost City Airbnb Performance Metrics Overview
Monthly Airbnb Revenue Variations & Income Potential in Lost City (2026)
Understanding the monthly revenue variations for Airbnb listings in Lost City is key to maximizing your short term rental income potential. Seasonality significantly impacts earnings. Our analysis, based on data from the past 12 months, shows that the peak revenue month for STRs in Lost City is typically October, while February often presents the lowest earnings, highlighting opportunities for strategic pricing adjustments during shoulder and low seasons. Explore the typical Airbnb income in Lost City across different performance tiers:
- Best-in-class properties (Top 10%) achieve $5,699+ monthly, often utilizing dynamic pricing and superior guest experiences.
- Strong performing properties (Top 25%) earn $3,947 or more, indicating effective management and desirable locations/amenities.
- Typical properties (Median) generate around $2,582 per month, representing the average market performance.
- Entry-level properties (Bottom 25%) see earnings around $1,471, often with potential for optimization.
Average Monthly Airbnb Earnings Trend in Lost City
Lost City Airbnb Occupancy Rate Trends (2026)
Maximize your bookings by understanding the Lost City STR occupancy trends. Seasonal demand shifts significantly influence how often properties are booked. Typically, Novembersees the highest demand (peak season occupancy), while January experiences the lowest (low season). Effective strategies, like adjusting minimum stays or offering promotions, can boost occupancy during slower periods. Here's how different property tiers perform in Lost City:
- Best-in-class properties (Top 10%) achieve 70%+ occupancy, indicating high desirability and potentially optimized availability.
- Strong performing properties (Top 25%) maintain 56% or higher occupancy, suggesting good market fit and guest satisfaction.
- Typical properties (Median) have an occupancy rate around 38%.
- Entry-level properties (Bottom 25%) average 21% occupancy, potentially facing higher vacancy.
Average Monthly Occupancy Rate Trend in Lost City
Average Daily Rate (ADR) Airbnb Trends in Lost City (2026)
Effective short term rental pricing strategy in Lost City involves understanding monthly ADR fluctuations. The Average Daily Rate (ADR) for Airbnb in Lost City typically peaks in October and dips lowest during March. Leveraging Airbnb dynamic pricing tools or strategies based on this seasonality can significantly boost revenue. Here's a look at the typical nightly rates achieved:
- Best-in-class properties (Top 10%) command rates of $336+ per night, often due to premium features or locations.
- Strong performing properties (Top 25%) achieve nightly rates of $299 or more.
- Typical properties (Median) charge around $239 per night.
- Entry-level properties (Bottom 25%) earn around $182 per night.
Average Daily Rate (ADR) Trend by Month in Lost City
Get Live Lost City Market Intelligence 👇

Explore Real-time Analytics
Airbnb Seasonality Analysis & Trends in Lost City (2026)
Peak Season (October, November, July)
- Revenue averages $3,925 per month
- Occupancy rates average 50.5%
- Daily rates average $259
Shoulder Season
- Revenue averages $3,010 per month
- Occupancy maintains around 40.4%
- Daily rates hold near $244
Low Season (January, February, March)
- Revenue drops to average $2,103 per month
- Occupancy decreases to average 29.4%
- Daily rates adjust to average $234
Seasonality Insights for Lost City
- The Airbnb seasonality in Lost City shows highly seasonal trends requiring careful strategy. While the sections above show seasonal averages, it's also insightful to look at the extremes:
- During the high season, the absolute peak month showcases Lost City's highest earning potential, with monthly revenues capable of climbing to $4,019, occupancy reaching a high of 53.2%, and ADRs peaking at $267.
- Conversely, the slowest single month of the year, typically falling within the low season, marks the market's lowest point. In this month, revenue might dip to $1,900, occupancy could drop to 25.1%, and ADRs may adjust down to $223.
- Understanding both the seasonal averages and these monthly peaks and troughs in revenue, occupancy, and ADR is crucial for maximizing your Airbnb profit potential in Lost City.
Seasonal Strategies for Maximizing Profit
- Peak Season: Maximize revenue through premium pricing and potentially longer minimum stays. Ensure high availability.
- Low Season: Offer competitive pricing, special promotions (e.g., extended stay discounts), and flexible cancellation policies. Target off-season travelers like remote workers or budget-conscious guests.
- Shoulder Seasons: Implement dynamic pricing that balances peak and low rates. Target weekend travelers or specific events. Offer slightly more flexible terms than peak season.
- Regularly analyze your own performance against these Lost City seasonality benchmarks and adjust your pricing and availability strategy accordingly.
Best Areas for Airbnb Investment in Lost City (2026)
Exploring the top neighborhoods for short-term rentals in Lost City? This section highlights key areas, outlining why they are attractive for hosts and guests, along with notable local attractions. Consider these locations based on your target guest profile and investment strategy.
| Neighborhood / Area | Why Host Here? (Target Guests & Appeal) | Key Attractions & Landmarks |
|---|---|---|
| Blackwater Falls State Park | A stunning natural attraction known for its beautiful falls and hiking trails. It's a popular destination for outdoor enthusiasts and nature lovers, making it ideal for Airbnb hosting. | Blackwater Falls, Elakala Falls, Dolly Sods Wilderness, Trails and hiking, Scenic viewpoints |
| Davis | A small, charming town that serves as a gateway to outdoor adventures, especially for skiing and mountain biking. Has a growing number of visitors looking for cozy accommodations. | Canaan Valley Resort, Timberline Four Seasons Resort, Blackwater Falls, Mountain biking trails, Local restaurants and shops |
| Elkins | A historic town with a vibrant arts scene and access to the Monongahela National Forest. Attracts visitors interested in history, arts, and outdoor activities. | Randolph County Museum, Gatto’s Pizza, B&O Railroad Heritage Center, National Radio Astronomy Observatory, Outdoor activities in the national forest |
| Harpers Ferry | Though just outside the declared area, it’s a historic town at the confluence of two rivers and the Appalachian Trail, attracting tourists for its rich history and adventure activities. | Harpers Ferry National Historical Park, Appalachian Trail, John Brown’s Fort, Historic downtown area, Outdoor recreation like hiking and rafting |
| Seneca Rocks | A natural rock formation that is a popular spot for rock climbing and hiking. It attracts adventure seekers and nature lovers from various backgrounds. | Seneca Rocks, Rock climbing, Hiking trails, Scenic viewpoints, National Forest |
| Berkeley Springs | Known for its warm springs and wellness retreats, it attracts visitors looking for relaxation and rejuvenation, which makes it an appealing investment for Airbnb hosts. | Berkeley Springs State Park, Warm Springs, Spa resorts, Local art galleries, Historic downtown area |
| Canaan Valley | This area offers skiing in winter and beautiful landscapes year-round, making it a year-round destination for tourists. | Canaan Valley Resort, Skiing, Hiking trails, Wildlife watching, Scenic beauty |
| Lost River | A quiet, serene area known for its natural beauty and outdoor activities. Popular with those looking to escape city life for a weekend retreat. | Lost River State Park, Hiking trails, Fishing, Peaceful countryside, Cabin rentals |
Understanding Airbnb License Requirements & STR Laws in Lost City (2026)
While Lost City, West Virginia, United States currently shows low STR regulations, specific Airbnb license requirements might still exist or change. Always verify the latest short term rental regulations and Airbnb license requirements directly with local government authorities for Lost City to ensure full compliance before hosting.
(Source: AirROI data, 2026, finding no licensed listings among those analyzed)
Top Performing Airbnb Properties in Lost City (2026)
Benchmark your potential! Explore examples of top-performing Airbnb properties in Lost Citybased on Trailing Twelve Month (TTM) revenue. Analyze their characteristics, revenue, occupancy rate, and ADR to understand what drives success in this market.
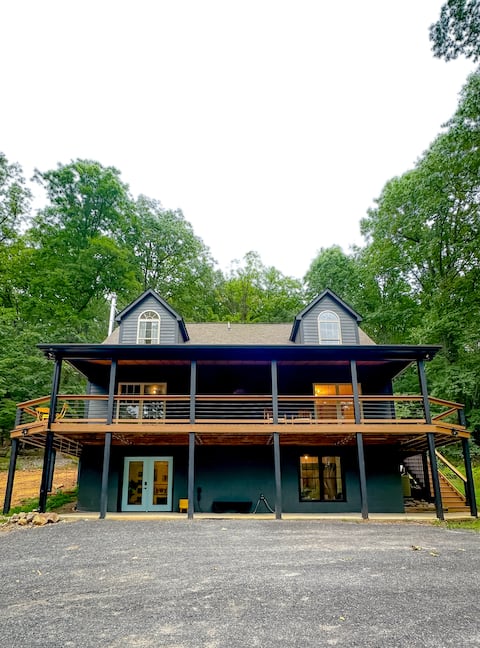
Forest Retreat w/Outdoor Amenities 4BR
Entire Place • 4 bedrooms

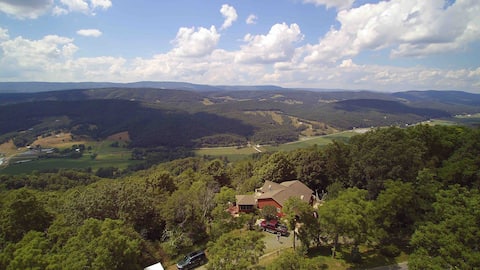
Mountain Retreat-Stunning View/Hot tub/Pool
Entire Place • 3 bedrooms

Modern Mountain Retreat, Hot Tub & Views
Entire Place • 3 bedrooms
Mountaintop Chalet w/ views + HOT TUB + 5 Bedrooms
Entire Place • 5 bedrooms

WV Mountain Paradise With Hot Tub and Game Room
Entire Place • 3 bedrooms

Cozy & Private Mountaintop Escape
Entire Place • 2 bedrooms
Note: Performance varies based on location, size, amenities, seasonality, and management quality. Data reflects the past 12 months.
Top Performing Airbnb Hosts in Lost City (2026)
Learn from the best! This table showcases top-performing Airbnb hosts in Lost City based on the number of properties managed and estimated total revenue over the past year. Analyze their scale and performance metrics.
| Host Name | Properties | Grossing Revenue | Stay Reviews | Avg Rating |
|---|---|---|---|---|
| Luna De Honey | 1 | $79,951 | 73 | 4.85/5.0 |
| Tania | 1 | $70,470 | 146 | 5.00/5.0 |
| Alex | 1 | $61,120 | 221 | 4.96/5.0 |
| Katherine | 1 | $57,898 | 82 | 4.96/5.0 |
| Rob | 1 | $57,602 | 57 | 4.96/5.0 |
| Collin | 1 | $57,410 | 90 | 4.96/5.0 |
| Derek | 1 | $56,435 | 229 | 4.90/5.0 |
| Nicholas | 1 | $42,972 | 67 | 4.96/5.0 |
| Jane G. | 1 | $42,588 | 158 | 4.80/5.0 |
| Corinne | 1 | $39,107 | 9 | 5.00/5.0 |
Analyzing the strategies of top hosts, such as their property selection, pricing, and guest communication, can offer valuable lessons for optimizing your own Airbnb operations in Lost City.
Dive Deeper: Advanced Lost City STR Market Data (2026)
Ready to unlock more insights? AirROI provides access to advanced metrics and comprehensive Airbnb data for Lost City. Explore detailed analytics beyond this report to refine your investment strategy, optimize pricing, and maximize your vacation rental profits.
Explore Advanced MetricsLost City Short-Term Rental Market Composition (2026): Property & Room Types
Room Type Distribution
Property Type Distribution
Market Composition Insights for Lost City
- The Lost City Airbnb market composition is heavily skewed towards Entire Home/Apt listings, which make up 94.6% of the 37 active rentals. This indicates strong guest preference for privacy and space.
- Looking at the property type distribution in Lost City, Outdoor/Unique properties are the most common (56.8%), reflecting the local real estate landscape.
- Houses represent a significant 37.8% portion, catering likely to families or larger groups.
- The presence of 5.4% Hotel/Boutique listings indicates integration with traditional hospitality.
Lost City Airbnb Room Capacity Analysis (2026): Bedroom Distribution
Distribution of Listings by Number of Bedrooms
Room Capacity Insights for Lost City
- The dominant room capacity in Lost City is 3 bedrooms listings, making up 32.4% of the market. This suggests a strong demand for properties suitable for families or small groups.
- Together, 3 bedrooms and 2 bedrooms properties represent 62.1% of the active Airbnb listings in Lost City, indicating a high concentration in these sizes.
- A significant 45.9% of listings offer 3+ bedrooms, catering to larger groups and families seeking more space in Lost City.
Lost City Vacation Rental Guest Capacity Trends (2026)
Distribution of Listings by Guest Capacity
Guest Capacity Insights for Lost City
- The most common guest capacity trend in Lost City vacation rentals is listings accommodating 4 guests (32.4%). This suggests the primary traveler segment is likely small families or groups.
- Properties designed for 4 guests and 6 guests dominate the Lost City STR market, accounting for 62.1% of listings.
- 48.6% of properties accommodate 6+ guests, serving the market segment for larger families or group travel in Lost City.
- On average, properties in Lost City are equipped to host 5.1 guests.
Lost City Airbnb Booking Patterns (2026): Available vs. Booked Days
Available Days Distribution
Booked Days Distribution
Booking Pattern Insights for Lost City
- The most common availability pattern in Lost City falls within the 181-270 days range, representing 37.8% of listings. This suggests many properties have significant open periods on their calendars.
- Approximately 72.9% of listings show high availability (181+ days open annually), indicating potential for increased bookings or specific owner usage patterns.
- For booked days, the 91-180 days range is most frequent in Lost City (37.8%), reflecting common guest stay durations or potential owner blocking patterns.
- A notable 27.0% of properties secure long booking periods (181+ days booked per year), highlighting successful long-term rental strategies or significant owner usage.
Lost City Airbnb Minimum Stay Requirements Analysis
Distribution of Listings by Minimum Night Requirement
1 Night
1 listings
2.7% of total
2 Nights
22 listings
59.5% of total
4-6 Nights
2 listings
5.4% of total
30+ Nights
12 listings
32.4% of total
Key Insights
- The most prevalent minimum stay requirement in Lost City is 2 Nights, adopted by 59.5% of listings. This highlights the market's preference for shorter, flexible bookings.
- A strong majority (62.2%) of the Lost City Airbnb data shows acceptance of very short stays (1-2 nights), indicating a dynamic, high-turnover market.
- A significant segment (32.4%) caters to monthly stays (30+ nights) in Lost City, pointing to opportunities in the extended-stay market.
Recommendations
- Align with the market by considering a 2 Nights minimum stay, as 59.5% of Lost City hosts use this setting.
- If feasible, allowing 1-night stays, especially midweek or during low season, could capture last-minute bookings, as only 2.7% currently do.
- A 2-night minimum appears standard (59.5%). Consider this for weekends or peak periods.
- Explore offering discounts for stays of 30+ nights to attract the 32.4% of the market seeking extended stays.
- Adjust minimum nights based on seasonality – potentially shorter during low season and longer during peak demand periods in Lost City.
Lost City Airbnb Cancellation Policy Trends Analysis (2026)
Limited
2 listings
5.4% of total
Flexible
5 listings
13.5% of total
Moderate
14 listings
37.8% of total
Firm
13 listings
35.1% of total
Strict
3 listings
8.1% of total
Cancellation Policy Insights for Lost City
- The prevailing Airbnb cancellation policy trend in Lost City is Moderate, used by 37.8% of listings.
- There's a relatively balanced mix between guest-friendly (51.3%) and stricter (43.2%) policies, offering choices for different guest needs.
- Strict cancellation policies are quite rare (8.1%), potentially making listings with this policy less competitive unless justified by high demand or property type.
Recommendations for Hosts
- Consider adopting a Moderate policy to align with the 37.8% market standard in Lost City.
- Using a Strict policy might deter some guests, as only 8.1% of listings use it. Evaluate if potential revenue protection outweighs possible lower booking rates.
- Regularly review your cancellation policy against competitors and market demand shifts in Lost City.
Lost City STR Booking Lead Time Analysis (2026)
Average Booking Lead Time by Month
Booking Lead Time Insights for Lost City
- The overall average booking lead time for vacation rentals in Lost City is 43 days.
- Guests book furthest in advance for stays during October (average 55 days), likely coinciding with peak travel demand or local events.
- The shortest booking windows occur for stays in March (average 28 days), indicating more last-minute travel plans during this time.
- Seasonally, Summer (46 days avg.) sees the longest lead times, while Spring (31 days avg.) has the shortest, reflecting typical travel planning cycles.
Recommendations for Hosts
- Use the overall average lead time (43 days) as a baseline for your pricing and availability strategy in Lost City.
- For October stays, consider implementing length-of-stay discounts or slightly higher rates for bookings made less than 55 days out to capitalize on advance planning.
- Target marketing efforts for the Summer season well in advance (at least 46 days) to capture early planners.
- Monitor your own booking lead times against these Lost City averages to identify opportunities for dynamic pricing adjustments.
Popular & Essential Airbnb Amenities in Lost City (2026)
Amenity Prevalence
Amenity Insights for Lost City
- Essential amenities in Lost City that guests expect include: Free parking on premises, Heating, Air conditioning, Wifi, Kitchen, Smoke alarm, Hot water, Refrigerator. Lacking these (any) could significantly impact bookings.
- Popular amenities like Coffee maker, BBQ grill are common but not universal. Offering these can provide a competitive edge.
Recommendations for Hosts
- Ensure your listing includes all essential amenities for Lost City: Free parking on premises, Heating, Air conditioning, Wifi, Kitchen, Smoke alarm, Hot water, Refrigerator.
- Prioritize adding missing essentials: Kitchen, Smoke alarm, Hot water, Refrigerator.
- Consider adding popular differentiators like Coffee maker or BBQ grill to increase appeal.
- Highlight unique or less common amenities you offer (e.g., hot tub, dedicated workspace, EV charger) in your listing description and photos.
- Regularly check competitor amenities in Lost City to stay competitive.
Lost City Airbnb Guest Demographics & Profile Analysis (2026)
Guest Profile Summary for Lost City
- The typical guest profile for Airbnb in Lost City consists of primarily domestic travelers (76%), often arriving from nearby Washington, typically belonging to the Post-2000s (Gen Z/Alpha) group (50%), primarily speaking English or Spanish.
- Domestic travelers account for 75.6% of guests.
- Key international markets include United States (75.6%) and DC (21.3%).
- Top languages spoken are English (67.6%) followed by Spanish (13.8%).
- A significant demographic segment is the Post-2000s (Gen Z/Alpha) group, representing 50% of guests.
Recommendations for Hosts
- Target domestic marketing efforts towards travelers from Washington and Baltimore.
- Tailor amenities and listing descriptions to appeal to the dominant Post-2000s (Gen Z/Alpha) demographic (e.g., highlight fast WiFi, smart home features, local guides).
- Highlight unique local experiences or amenities relevant to the primary guest profile.
- Consider seasonal promotions aligned with peak travel times for key origin markets.
Nearby Short-Term Rental Market Comparison
How does the Lost City Airbnb market stack up against its neighbors? Compare key performance metrics like average monthly revenue, ADR, and occupancy rates in surrounding areas to understand the broader regional STR landscape.
| Market | Active Properties | Monthly Revenue | Daily Rate | Avg. Occupancy |
|---|---|---|---|---|
| McGaheysville | 83 | $6,156 | $431.72 | 45% |
| Shannondale | 45 | $5,808 | $337.30 | 54% |
| Penhook | 18 | $5,675 | $678.75 | 37% |
| Bentonville | 23 | $5,372 | $420.82 | 51% |
| Nellysford | 62 | $5,276 | $426.33 | 39% |
| Bumpass | 120 | $4,851 | $553.01 | 33% |
| Mineral | 231 | $4,800 | $474.55 | 36% |
| Shenandoah | 104 | $4,778 | $354.44 | 47% |
| Middleburg | 39 | $4,681 | $485.11 | 41% |
| Skyland Estates | 14 | $4,649 | $280.30 | 55% |